|
|
|
|
|
|
|
|
|
|
|
|
|
|
|
|
|
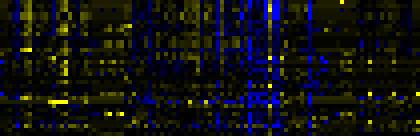
| Pathways co-expressed in the Organ and Tissue data set (with more than 10 annotation points) |
|
CYP705A5 (At5g47990) |
|
|
|
|
|
|
|
|
| max. difference between log2-ratios: |
7.5 |
|
|
|
|
|
|
|
|
|
|
|
|
| max. difference between log2-ratios excluding lowest and highest 5%: |
5.5 |
|
|
|
|
|
|
|
|
|
|
|
|
| Pathway |
Source |
Scores of Genes |
p[Score] |
No. of Genes |
p[genes] |
Link to organ heatmap |
|
|
|
|
|
|
|
| Stilbene, coumarine and lignin biosynthesis |
KEGG |
42 |
0.000 |
15 |
0.000 |

|
|
|
| Methane metabolism |
KEGG |
36 |
0.000 |
15 |
0.000 |
|
|
| Phenylalanine metabolism |
KEGG |
32 |
0.000 |
14 |
0.000 |
|
|
| Prostaglandin and leukotriene metabolism |
KEGG |
32 |
0.000 |
14 |
0.000 |
|
|
| monoterpenoid biosynthesis |
TAIR-GO |
19 |
0.000 |
2 |
0.000 |
|
|
| mono-/sesqui-/di-terpene biosynthesis |
LitPath |
19 |
0.000 |
2 |
0.044 |
|
|
| monoterpene biosynthesis |
LitPath |
19 |
0.000 |
2 |
0.000 |
|
|
| terpenoid metabolism |
LitPath |
19 |
0.000 |
2 |
0.048 |
|
|
| detoxification |
FunCat |
17 |
0.000 |
5 |
0.000 |
|
|
| triterpene, sterol, and brassinosteroid metabolism |
LitPath |
17 |
0.006 |
4 |
0.025 |
|
|
| Phenylpropanoid Metabolism |
BioPath |
16 |
0.000 |
3 |
0.003 |
|
|
| isoprenoid biosynthesis |
FunCat |
14 |
0.000 |
3 |
0.004 |
|
|
| lipid, fatty acid and isoprenoid biosynthesis |
FunCat |
14 |
0.000 |
3 |
0.002 |
|
|
| Miscellaneous acyl lipid metabolism |
AcylLipid |
14 |
0.001 |
7 |
0.001 |
|
|
|
|
|
|
|
|
|
|
|
| Biosynthesis of steroids |
KEGG |
13 |
0.000 |
2 |
0.052 |
|
|
|
|
|
|
|
|
|
|
|
| triterpene biosynthesis |
LitPath |
13 |
0.000 |
2 |
0.002 |
|
|
|
|
|
|
|
|
|
|
|
| detoxification involving cytochrome P450 |
FunCat |
11 |
0.000 |
2 |
0.000 |
|
|
|
|
|
|
|
|
|
|
|
|
|
|
|
|
|
|
|
|
|
|
|
|
|
|
|
|
|
|
|
|
|
|
|
|
|
|
|
|
|
|
|
|
|
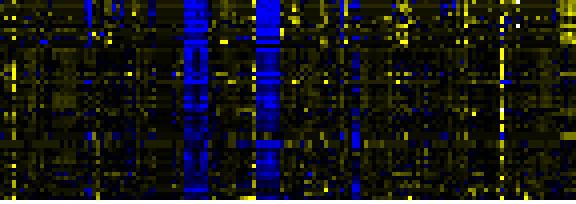
| Pathways co-expressed in the Hormone etc. data set (with more than 10 annotation points) |
|
CYP705A5 (At5g47990) |
|
|
|
|
|
|
|
|
| max. difference between log2-ratios: |
7.4 |
|
|
|
|
|
|
|
|
|
|
|
|
| max. difference between log2-ratios excluding lowest and highest 5%: |
2.3 |
|
|
|
|
|
|
|
|
|
|
|
|
| Pathway |
Source |
Scores of Genes |
p[Score] |
No. of Genes |
p[genes] |
Link to hormones etc. heatmap |
|
|
|
|
|
|
|
| Stilbene, coumarine and lignin biosynthesis |
KEGG |
32 |
0.000 |
4 |
0.000 |
|
|
|
|
|
|
| Phenylpropanoid Metabolism |
BioPath |
30 |
0.000 |
4 |
0.003 |
|
|
|
|
|
| response to UV |
TAIR-GO |
20 |
0.000 |
2 |
0.000 |
|
|
|
|
|
| Ascorbate and aldarate metabolism |
KEGG |
20 |
0.000 |
2 |
0.000 |
|
|
|
|
|
| Fluorene degradation |
KEGG |
20 |
0.000 |
2 |
0.000 |
|
|
|
|
|
| gamma-Hexachlorocyclohexane degradation |
KEGG |
20 |
0.000 |
2 |
0.000 |
|
|
|
|
|
| flavonoid, anthocyanin, and proanthocyanidin biosynthesis |
LitPath |
20 |
0.000 |
2 |
0.003 |
|
|
|
|
|
| proanthocyanidin biosynthesis |
LitPath |
20 |
0.000 |
2 |
0.003 |
|
|
|
|
|
| monoterpenoid biosynthesis |
TAIR-GO |
19 |
0.000 |
2 |
0.000 |
|
|
|
|
|
| mono-/sesqui-/di-terpene biosynthesis |
LitPath |
19 |
0.000 |
2 |
0.051 |
|
|
|
|
|
|
|
|
|
|
|
| monoterpene biosynthesis |
LitPath |
19 |
0.000 |
2 |
0.000 |
|
|
|
|
|
|
|
|
|
|
|
| terpenoid metabolism |
LitPath |
19 |
0.000 |
2 |
0.055 |
|
|
|
|
|
|
|
|
|
|
|
| Biosynthesis of Amino Acids and Derivatives |
BioPath |
18 |
0.000 |
2 |
0.074 |
|
|
|
|
|
|
|
|
|
|
|
| Glutathione metabolism |
BioPath |
18 |
0.000 |
2 |
0.007 |
|
|
|
|
|
|
|
|
|
|
|
| anthocyanin biosynthesis |
AraCyc |
14 |
0.000 |
2 |
0.000 |
|
|
|
|
|
|
|
|
|
|
|
| Flavonoid biosynthesis |
KEGG |
14 |
0.000 |
2 |
0.000 |
|
|
|
|
|
|
|
|
|
|
|
| core phenylpropanoid metabolism |
BioPath |
12 |
0.000 |
2 |
0.002 |
|
|
|
|
|
|
|
|
|
|
|
| colanic acid building blocks biosynthesis |
AraCyc |
12 |
0.000 |
3 |
0.001 |
|
|
|
|
|
|
|
|
|
|
|
| detoxification |
FunCat |
11 |
0.000 |
2 |
0.000 |
|
|
|
|
|
|
|
|
|
|
|
| detoxification involving cytochrome P450 |
FunCat |
11 |
0.000 |
2 |
0.000 |
|
|
|
|
|
|
|
|
|
|
|
|
|
|
|
|
|
|
|
|
|
|
|
|
|
|
|
|
|
|
|
|
|
|
|
|
|
|
|
|
|
|
|
|
|
|
|
|
|
|
|
|
|
|
|
|
|
|
|
|
|
|
| Pathways co-expressed in the Mutant data set (with more than 20 annotation points) |
|
CYP705A5 (At5g47990) |
|
|
|
|
|
|
|
|
| max. difference between log2-ratios: |
7.9 |
|
|
|
|
|
|
|
|
|
|
|
|
| max. difference between log2-ratios excluding lowest and highest 5%: |
4.3 |
|
|
|
|
|
|
|
|
|
|
|
|
| Pathway |
Source |
Scores of Genes |
p[Score] |
No. of Genes |
p[genes] |
Link to mutants heatmap |
|
|
|
|
|
|
|
| Photosystems |
BioPath |
64 |
0.000 |
9 |
0.000 |
|
|
|
|
| glycolysis and gluconeogenesis |
FunCat |
62 |
0.000 |
8 |
0.001 |
|
|
|
| Intermediary Carbon Metabolism |
BioPath |
52 |
0.000 |
7 |
0.010 |
|
|
|
| C-compound and carbohydrate metabolism |
FunCat |
52 |
0.000 |
6 |
0.293 |
|
|
|
| acetate fermentation |
AraCyc |
38 |
0.000 |
6 |
0.000 |
|
|
|
| fructose degradation (anaerobic) |
AraCyc |
38 |
0.000 |
6 |
0.000 |
|
|
|
| glycolysis I |
AraCyc |
38 |
0.000 |
6 |
0.012 |
|
|
|
| glycolysis IV |
AraCyc |
38 |
0.000 |
6 |
0.000 |
|
|
|
| sorbitol fermentation |
AraCyc |
38 |
0.000 |
6 |
0.000 |
|
|
|
| additional photosystem II components |
BioPath |
36 |
0.000 |
4 |
0.001 |
|
|
|
| Carbon fixation |
KEGG |
36 |
0.000 |
5 |
0.000 |
|
|
|
| glycerol degradation II |
AraCyc |
34 |
0.000 |
5 |
0.000 |
|
|
|
| gluconeogenesis |
AraCyc |
28 |
0.000 |
4 |
0.002 |
|
|
|
|
|
|
|
|
|
|
|
| glyceraldehyde 3-phosphate degradation |
AraCyc |
28 |
0.000 |
4 |
0.000 |
|
|
|
|
|
|
|
|
|
|
|
| protein synthesis |
FunCat |
28 |
0.002 |
5 |
0.041 |
|
|
|
|
|
|
|
|
|
|
|
| ATP synthase components |
BioPath |
26 |
0.000 |
3 |
0.000 |
|
|
|
|
|
|
|
|
|
|
|
| Gluconeogenesis from lipids in seeds |
BioPath |
26 |
0.000 |
4 |
0.010 |
|
|
|
|
|
|
|
|
|
|
|
| ATP synthesis coupled proton transport |
TAIR-GO |
26 |
0.000 |
3 |
0.000 |
|
|
|
|
|
|
|
|
|
|
|
| proton transport |
TAIR-GO |
26 |
0.000 |
3 |
0.000 |
|
|
|
|
|
|
|
|
|
|
|
| Calvin cycle |
AraCyc |
26 |
0.000 |
4 |
0.001 |
|
|
|
|
|
|
|
|
|
|
|
| photosynthesis |
FunCat |
26 |
0.000 |
3 |
0.012 |
|
|
|
|
|
|
|
|
|
|
|
| Glycolysis / Gluconeogenesis |
KEGG |
26 |
0.000 |
4 |
0.006 |
|
|
|
|
|
|
|
|
|
|
|
| isoprenoid biosynthesis |
FunCat |
25 |
0.000 |
5 |
0.001 |
|
|
|
|
|
|
|
|
|
|
|
| lipid, fatty acid and isoprenoid biosynthesis |
FunCat |
25 |
0.000 |
5 |
0.001 |
|
|
|
|
|
|
|
|
|
|
|
|
|
|
|
|
|
|
|
|
|
|
|
|
|
|
|
|