|
|
|
|
|
|
|
|
|
|
|
|
|
|
|
|
|
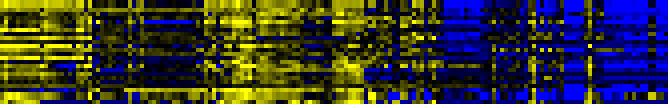
| Pathways co-expressed in the Organ and Tissue data set (with more than 9 annotation points) |
|
CYP706A1 (At4g22690) |
|
|
|
|
|
|
|
|
| max. difference between log2-ratios: |
7.5 |
|
|
|
|
|
|
|
|
|
|
|
|
| max. difference between log2-ratios excluding lowest and highest 5%: |
6.4 |
|
|
|
|
|
|
|
|
|
|
|
|
| Pathway |
Source |
Scores of Genes |
p[Score] |
No. of Genes |
p[genes] |
Link to organ heatmap |
|
|
|
|
|
|
|
| Biosynthesis of Amino Acids and Derivatives |
BioPath |
46 |
0.000 |
6 |
0.000 |
|
|
|
|
| Glutathione metabolism |
BioPath |
22 |
0.000 |
3 |
0.001 |
|
|
|
| toxin catabolism |
TAIR-GO |
22 |
0.000 |
3 |
0.001 |
|
|
|
| Glutathione metabolism |
KEGG |
22 |
0.000 |
3 |
0.000 |
|
|
|
| Stilbene, coumarine and lignin biosynthesis |
KEGG |
19 |
0.000 |
3 |
0.006 |
|
|
|
| Methionin/SAM/ethylene metabolism from cysteine and aspartate |
BioPath |
16 |
0.000 |
2 |
0.001 |
|
|
|
| intracellular signalling |
FunCat |
13 |
0.000 |
3 |
0.000 |
|
|
|
| Benzoate degradation via CoA ligation |
KEGG |
13 |
0.000 |
3 |
0.004 |
|
|
|
|
|
|
|
|
|
|
|
| Inositol phosphate metabolism |
KEGG |
13 |
0.000 |
3 |
0.005 |
|
|
|
|
|
|
|
|
|
|
|
| Nicotinate and nicotinamide metabolism |
KEGG |
13 |
0.000 |
3 |
0.003 |
|
|
|
|
|
|
|
|
|
|
|
| lignin biosynthesis |
AraCyc |
12 |
0.000 |
2 |
0.000 |
|
|
|
|
|
|
|
|
|
|
|
| Phenylpropanoid pathway |
LitPath |
12 |
0.000 |
2 |
0.002 |
|
|
|
|
|
|
|
|
|
|
|
| core phenylpropanoid metabolism |
BioPath |
10 |
0.000 |
1 |
0.033 |
|
|
|
|
|
|
|
|
|
|
|
| aging |
TAIR-GO |
10 |
0.000 |
1 |
0.002 |
|
|
|
|
|
|
|
|
|
|
|
| lignin biosynthesis |
TAIR-GO |
10 |
0.000 |
1 |
0.003 |
|
|
|
|
|
|
|
|
|
|
|
| response to stress |
TAIR-GO |
10 |
0.000 |
1 |
0.001 |
|
|
|
|
|
|
|
|
|
|
|
| response to water deprivation |
TAIR-GO |
10 |
0.000 |
1 |
0.000 |
|
|
|
|
|
|
|
|
|
|
|
| triacylglycerol degradation |
AraCyc |
10 |
0.000 |
1 |
0.006 |
|
|
|
|
|
|
|
|
|
|
|
| biogenesis of cell wall |
FunCat |
10 |
0.000 |
1 |
0.037 |
|
|
|
|
|
|
|
|
|
|
|
| Miscellaneous acyl lipid metabolism |
AcylLipid |
10 |
0.000 |
1 |
0.000 |
|
|
|
|
|
|
|
|
|
|
|
|
|
|
|
|
|
|
|
|
|
|
|
|
|
|
|
|
|
|
|
|
|
|
|
|
|
|
|
|
|
|
|
|
|
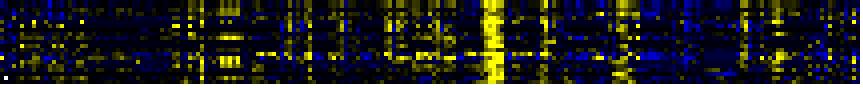
| Pathways co-expressed in the Stress data set ( with more than 6 annotation points) |
|
CYP706A1 (At4g22690) |
|
|
|
|
|
|
|
|
| max. difference between log2-ratios: |
6.4 |
|
|
|
|
|
|
|
|
|
|
|
|
| max. difference between log2-ratios excluding lowest and highest 5%: |
2.7 |
|
|
|
|
|
|
|
|
|
|
|
|
| Pathway |
Source |
Scores of Genes |
p[Score] |
No. of Genes |
p[genes] |
Link to stress heatmap |
|
|
|
|
|
|
|
| Biosynthesis of Amino Acids and Derivatives |
BioPath |
12 |
0.000 |
2 |
0.004 |
|
| Glutathione metabolism |
BioPath |
12 |
0.000 |
2 |
0.000 |
| sulfate assimilation |
TAIR-GO |
10 |
0.000 |
1 |
0.000 |
| dissimilatory sulfate reduction |
AraCyc |
10 |
0.000 |
1 |
0.000 |
| sulfate assimilation III |
AraCyc |
10 |
0.000 |
1 |
0.002 |
| biogenesis of chloroplast |
FunCat |
10 |
0.000 |
1 |
0.007 |
| nitrogen and sulfur utilization |
FunCat |
10 |
0.000 |
1 |
0.000 |
|
|
|
|
|
|
|
|
|
|
|
| Purine metabolism |
KEGG |
10 |
0.000 |
1 |
0.022 |
|
|
|
|
|
|
|
|
|
|
|
| Selenoamino acid metabolism |
KEGG |
10 |
0.000 |
1 |
0.006 |
|
|
|
|
|
|
|
|
|
|
|
| Sulfur metabolism |
KEGG |
10 |
0.000 |
1 |
0.003 |
|
|
|
|
|
|
|
|
|
|
|
| nucleotide metabolism |
TAIR-GO |
9 |
0.000 |
1 |
0.000 |
|
|
|
|
|
|
|
|
|
|
|
| de novo biosynthesis of purine nucleotides I |
AraCyc |
9 |
0.000 |
1 |
0.015 |
|
|
|
|
|
|
|
|
|
|
|
|
|
|
|
|
|
|
|
|
|
|
|
|
|
|
|
|
|
|
|
|
|
|
|
|
|
|
|
|
|
|
|
|
|
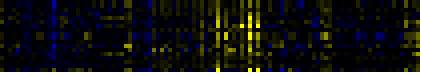
| Pathways co-expressed in the Hormone etc. data set (with more than 6 annotation points) |
|
CYP706A1 (At4g22690) |
|
|
|
|
|
|
|
|
| max. difference between log2-ratios: |
3.4 |
|
|
|
|
|
|
|
|
|
|
|
|
| max. difference between log2-ratios excluding lowest and highest 5%: |
1.2 |
|
|
|
|
|
|
|
|
|
|
|
|
| Pathway |
Source |
Scores of Genes |
p[Score] |
No. of Genes |
p[genes] |
Link to hormones etc. heatmap |
|
|
|
|
|
|
|
| Miscellaneous acyl lipid metabolism |
AcylLipid |
12 |
0.000 |
2 |
0.019 |
|
|
|
|
|
|
|
| Gluconeogenesis from lipids in seeds |
BioPath |
10 |
0.000 |
1 |
0.006 |
|
|
|
|
|
|
| fatty acid biosynthesis |
TAIR-GO |
10 |
0.000 |
1 |
0.002 |
|
|
|
|
|
|
| fatty acid oxidation pathway |
AraCyc |
10 |
0.000 |
1 |
0.000 |
|
|
|
|
|
|
| octane oxidation |
AraCyc |
10 |
0.000 |
1 |
0.000 |
|
|
|
|
|
|
| degradation |
FunCat |
10 |
0.000 |
1 |
0.002 |
|
|
|
|
|
|
|
|
|
|
|
| degradation of lipids, fatty acids and isoprenoids |
FunCat |
10 |
0.000 |
1 |
0.000 |
|
|
|
|
|
|
|
|
|
|
|
| Carbon fixation |
KEGG |
10 |
0.000 |
2 |
0.005 |
|
|
|
|
|
|
|
|
|
|
|
| Fatty acid metabolism |
KEGG |
10 |
0.000 |
1 |
0.014 |
|
|
|
|
|
|
|
|
|
|
|
| auxin mediated signaling pathway |
TAIR-GO |
9 |
0.000 |
1 |
0.000 |
|
|
|
|
|
|
|
|
|
|
|
| calcium ion binding |
TAIR-GO |
9 |
0.000 |
1 |
0.000 |
|
|
|
|
|
|
|
|
|
|
|
| Mo-molybdopterin cofactor biosynthesis |
TAIR-GO |
9 |
0.000 |
1 |
0.000 |
|
|
|
|
|
|
|
|
|
|
|
| molybdenum ion binding |
TAIR-GO |
9 |
0.000 |
1 |
0.000 |
|
|
|
|
|
|
|
|
|
|
|
| response to absence of light |
TAIR-GO |
9 |
0.000 |
1 |
0.000 |
|
|
|
|
|
|
|
|
|
|
|
| response to mechanical stimulus |
TAIR-GO |
9 |
0.000 |
1 |
0.000 |
|
|
|
|
|
|
|
|
|
|
|
| response to temperature |
TAIR-GO |
9 |
0.000 |
1 |
0.000 |
|
|
|
|
|
|
|
|
|
|
|
| thigmotropism |
TAIR-GO |
9 |
0.000 |
1 |
0.000 |
|
|
|
|
|
|
|
|
|
|
|
| biosynthesis of vitamins, cofactors, and prosthetic groups |
FunCat |
9 |
0.000 |
1 |
0.001 |
|
|
|
|
|
|
|
|
|
|
|
| Folate biosynthesis |
KEGG |
9 |
0.000 |
1 |
0.003 |
|
|
|
|
|
|
|
|
|
|
|
| Phosphatidylinositol signaling system |
KEGG |
9 |
0.000 |
1 |
0.014 |
|
|
|
|
|
|
|
|
|
|
|
| Signal Transduction |
KEGG |
9 |
0.000 |
1 |
0.015 |
|
|
|
|
|
|
|
|
|
|
|
|
|
|
|
|
|
|
|
|
|
|
|
|
|
|
|
|
|
|
|
|
|
|
|
|
|
|
|
|
|
|
|
|
|
|
|
|
|
|
|
|
|
|
|
|
|
|
|
|
|
|
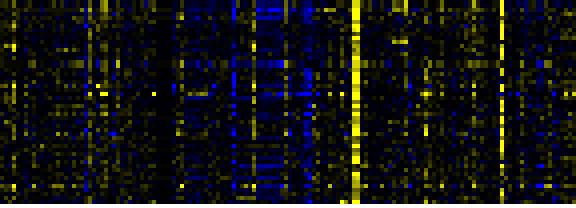
| Pathways co-expressed in the Mutant data set (with more than 10 annotation points) |
|
CYP706A1 (At4g22690) |
|
|
|
|
|
|
|
|
| max. difference between log2-ratios: |
4.8 |
|
|
|
|
|
|
|
|
|
|
|
|
| max. difference between log2-ratios excluding lowest and highest 5%: |
2.2 |
|
|
|
|
|
|
|
|
|
|
|
|
| Pathway |
Source |
Scores of Genes |
p[Score] |
No. of Genes |
p[genes] |
Link to mutants heatmap |
|
|
|
|
|
|
|
| Benzoate degradation via CoA ligation |
KEGG |
37 |
0.000 |
8 |
0.000 |
|
|
|
|
|
| Inositol phosphate metabolism |
KEGG |
37 |
0.000 |
8 |
0.000 |
|
|
|
|
| Nicotinate and nicotinamide metabolism |
KEGG |
37 |
0.000 |
8 |
0.000 |
|
|
|
|
| Phenylpropanoid Metabolism |
BioPath |
32 |
0.000 |
5 |
0.009 |
|
|
|
|
| Miscellaneous acyl lipid metabolism |
AcylLipid |
24 |
0.000 |
5 |
0.002 |
|
|
|
|
| Biosynthesis of Amino Acids and Derivatives |
BioPath |
22 |
0.004 |
3 |
0.104 |
|
|
|
|
| Aromatic amino acid (Phe, Tyr, Trp) metabolism |
BioPath |
20 |
0.000 |
3 |
0.003 |
|
|
|
|
| Phenylpropanoid pathway |
LitPath |
20 |
0.000 |
4 |
0.005 |
|
|
|
|
| N-terminal protein myristoylation |
TAIR-GO |
18 |
0.000 |
2 |
0.000 |
|
|
|
|
| degradation |
FunCat |
18 |
0.000 |
2 |
0.002 |
|
|
|
|
| tryptophan biosynthesis |
AraCyc |
16 |
0.000 |
3 |
0.000 |
|
|
|
|
| Glutamate metabolism |
KEGG |
16 |
0.000 |
2 |
0.014 |
|
|
|
|
| tryptophan biosynthesis |
TAIR-GO |
14 |
0.000 |
2 |
0.001 |
|
|
|
|
| Shikimate pathway |
LitPath |
14 |
0.000 |
2 |
0.022 |
|
|
|
|
|
|
|
|
|
|
|
| Trp biosyntesis |
LitPath |
14 |
0.000 |
2 |
0.002 |
|
|
|
|
|
|
|
|
|
|
|
| Glutathione metabolism |
BioPath |
12 |
0.002 |
2 |
0.038 |
|
|
|
|
|
|
|
|
|
|
|
| nucleotide metabolism |
FunCat |
12 |
0.000 |
2 |
0.000 |
|
|
|
|
|
|
|
|
|
|
|
| trehalose biosynthesis I |
AraCyc |
11 |
0.000 |
2 |
0.026 |
|
|
|
|
|
|
|
|
|
|
|
| trehalose biosynthesis II |
AraCyc |
11 |
0.000 |
2 |
0.010 |
|
|
|
|
|
|
|
|
|
|
|
| trehalose biosynthesis III |
AraCyc |
11 |
0.000 |
2 |
0.002 |
|
|
|
|
|
|
|
|
|
|
|
| energy |
FunCat |
11 |
0.000 |
2 |
0.000 |
|
|
|
|
|
|
|
|
|
|
|
| metabolism of energy reserves (e.g. glycogen, trehalose) |
FunCat |
11 |
0.000 |
2 |
0.000 |
|
|
|
|
|
|
|
|
|
|
|
|
|
|
|
|
|
|
|
|
|
|
|
|
|
|
|
|