|
|
|
|
|
|
|
|
|
|
|
|
|
|
|
|
|
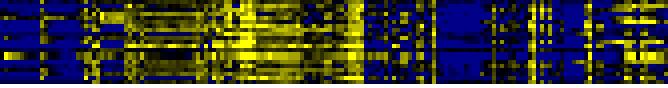
| Pathways co-expressed in the Organ and Tissue data set (with more than 6 annotation points) |
|
CYP706A4 (At4g12300) |
|
|
|
|
|
|
|
|
| max. difference between log2-ratios: |
3.9 |
|
|
|
|
|
|
|
|
|
|
|
|
| max. difference between log2-ratios excluding lowest and highest 5%: |
2.8 |
|
|
|
|
|
|
|
|
|
|
|
|
| Pathway |
Source |
Scores of Genes |
p[Score] |
No. of Genes |
p[genes] |
Link to organ heatmap |
|
|
|
|
|
|
|
| Biosynthesis of Amino Acids and Derivatives |
BioPath |
22 |
0.000 |
3 |
0.005 |
|
|
|
|
|
|
|
|
|
|
|
| Glutathione metabolism |
BioPath |
22 |
0.000 |
3 |
0.000 |
|
|
|
|
|
|
|
|
|
|
|
| toxin catabolism |
TAIR-GO |
12 |
0.000 |
2 |
0.002 |
|
|
|
|
|
|
|
|
|
|
|
| Glutathione metabolism |
KEGG |
12 |
0.000 |
2 |
0.000 |
|
|
|
|
|
|
|
|
|
|
|
| Chloroplastic protein turnover |
BioPath |
10 |
0.000 |
1 |
0.001 |
|
|
|
|
|
|
|
|
|
|
|
| ERD1 protease (ClpC-like) |
BioPath |
10 |
0.000 |
1 |
0.000 |
|
|
|
|
|
|
|
|
|
|
|
| Plastidial Isoprenoids (Chlorophylls, Carotenoids, Tocopherols, Plastoquinone, Phylloquinone) |
BioPath |
10 |
0.002 |
1 |
0.052 |
|
|
|
|
|
|
|
|
|
|
|
| Regulatory enzymes |
BioPath |
10 |
0.000 |
1 |
0.000 |
|
|
|
|
|
|
|
|
|
|
|
| ATP-dependent proteolysis |
TAIR-GO |
10 |
0.000 |
1 |
0.002 |
|
|
|
|
|
|
|
|
|
|
|
| carotenoid biosynthesis |
TAIR-GO |
10 |
0.000 |
1 |
0.001 |
|
|
|
|
|
|
|
|
|
|
|
| cellular response to sulfate starvation |
TAIR-GO |
10 |
0.000 |
1 |
0.000 |
|
|
|
|
|
|
|
|
|
|
|
| plastid organization and biogenesis |
TAIR-GO |
10 |
0.000 |
1 |
0.000 |
|
|
|
|
|
|
|
|
|
|
|
| response to high light intensity |
TAIR-GO |
10 |
0.000 |
1 |
0.000 |
|
|
|
|
|
|
|
|
|
|
|
| response to temperature |
TAIR-GO |
10 |
0.000 |
1 |
0.000 |
|
|
|
|
|
|
|
|
|
|
|
| cysteine biosynthesis I |
AraCyc |
10 |
0.000 |
1 |
0.002 |
|
|
|
|
|
|
|
|
|
|
|
| sulfate assimilation III |
AraCyc |
10 |
0.000 |
1 |
0.001 |
|
|
|
|
|
|
|
|
|
|
|
| biosynthesis of phenylpropanoids |
FunCat |
10 |
0.000 |
1 |
0.002 |
|
|
|
|
|
|
|
|
|
|
|
| biosynthesis of secondary products derived from L-phenylalanine and L-tyrosine |
FunCat |
10 |
0.000 |
1 |
0.002 |
|
|
|
|
|
|
|
|
|
|
|
| nitrogen and sulfur metabolism |
FunCat |
10 |
0.000 |
1 |
0.001 |
|
|
|
|
|
|
|
|
|
|
|
| stress response |
FunCat |
10 |
0.000 |
1 |
0.000 |
|
|
|
|
|
|
|
|
|
|
|
| Cysteine metabolism |
KEGG |
10 |
0.000 |
1 |
0.001 |
|
|
|
|
|
|
|
|
|
|
|
| Sulfur metabolism |
KEGG |
10 |
0.000 |
1 |
0.000 |
|
|
|
|
|
|
|
|
|
|
|
| Accessory protein/regulatory protein |
LitPath |
10 |
0.000 |
1 |
0.000 |
|
|
|
|
|
|
|
|
|
|
|
| response to ethylene stimulus |
TAIR-GO |
8 |
0.000 |
2 |
0.000 |
|
|
|
|
|
|
|
|
|
|
|
|
|
|
|
|
|
|
|
|
|
|
|
|
|
|
|
|
|
|
|
|
|
|
|
|
|
|
|
|
|
|
|
|
|
| Pathways co-expressed in the Hormone etc. data set (with more than 8 annotation points) |
|
CYP706A4 (At4g12300) |
|
|
|
|
|
|
|
|
| max. difference between log2-ratios: |
2.0 |
|
|
|
|
|
|
|
|
|
|
|
|
| max. difference between log2-ratios excluding lowest and highest 5%: |
0.8 |
|
|
|
|
|
|
|
|
|
|
|
|
| Pathway |
Source |
Scores of Genes |
p[Score] |
No. of Genes |
p[genes] |
Link to hormones etc. heatmap |
|
|
|
|
|
|
|
| serine-isocitrate lyase pathway |
AraCyc |
14 |
0.000 |
2 |
0.002 |

|
|
|
|
|
|
| core phenylpropanoid metabolism |
BioPath |
10 |
0.000 |
1 |
0.003 |
|
|
|
|
|
| Phenylpropanoid Metabolism |
BioPath |
10 |
0.000 |
1 |
0.037 |
|
|
|
|
|
| lignin biosynthesis |
TAIR-GO |
10 |
0.000 |
1 |
0.001 |
|
|
|
|
|
|
|
|
|
|
|
| phenylpropanoid biosynthesis |
TAIR-GO |
10 |
0.000 |
1 |
0.000 |
|
|
|
|
|
|
|
|
|
|
|
| aerobic respiration -- electron donors reaction list |
AraCyc |
10 |
0.000 |
1 |
0.007 |
|
|
|
|
|
|
|
|
|
|
|
| glycerol degradation II |
AraCyc |
10 |
0.000 |
1 |
0.027 |
|
|
|
|
|
|
|
|
|
|
|
| glycerol metabolism |
AraCyc |
10 |
0.000 |
1 |
0.003 |
|
|
|
|
|
|
|
|
|
|
|
| lignin biosynthesis |
AraCyc |
10 |
0.000 |
1 |
0.026 |
|
|
|
|
|
|
|
|
|
|
|
| phenylpropanoid biosynthesis |
AraCyc |
10 |
0.000 |
1 |
0.000 |
|
|
|
|
|
|
|
|
|
|
|
| suberin biosynthesis |
AraCyc |
10 |
0.000 |
1 |
0.005 |
|
|
|
|
|
|
|
|
|
|
|
| glycolysis and gluconeogenesis |
FunCat |
10 |
0.000 |
1 |
0.062 |
|
|
|
|
|
|
|
|
|
|
|
| isoprenoid biosynthesis |
FunCat |
10 |
0.000 |
1 |
0.019 |
|
|
|
|
|
|
|
|
|
|
|
| lipid, fatty acid and isoprenoid biosynthesis |
FunCat |
10 |
0.000 |
1 |
0.014 |
|
|
|
|
|
|
|
|
|
|
|
| phospholipid biosynthesis |
FunCat |
10 |
0.000 |
1 |
0.000 |
|
|
|
|
|
|
|
|
|
|
|
| Ascorbate and aldarate metabolism |
KEGG |
10 |
0.000 |
1 |
0.003 |
|
|
|
|
|
|
|
|
|
|
|
| Fluorene degradation |
KEGG |
10 |
0.000 |
1 |
0.001 |
|
|
|
|
|
|
|
|
|
|
|
| gamma-Hexachlorocyclohexane degradation |
KEGG |
10 |
0.000 |
1 |
0.001 |
|
|
|
|
|
|
|
|
|
|
|
| Glycerophospholipid metabolism |
KEGG |
10 |
0.000 |
1 |
0.003 |
|
|
|
|
|
|
|
|
|
|
|
| Stilbene, coumarine and lignin biosynthesis |
KEGG |
10 |
0.000 |
1 |
0.042 |
|
|
|
|
|
|
|
|
|
|
|
| metabolism of acyl-lipids in mitochondria |
AcylLipid |
10 |
0.000 |
1 |
0.006 |
|
|
|
|
|
|
|
|
|
|
|
| Phenylpropanoid pathway |
LitPath |
10 |
0.000 |
1 |
0.000 |
|
|
|
|
|
|
|
|
|
|
|
|
|
|
|
|
|
|
|
|
|
|
|
|
|
|
|
|