|
|
|
|
|
|
|
|
|
|
|
|
|
|
|
|
|
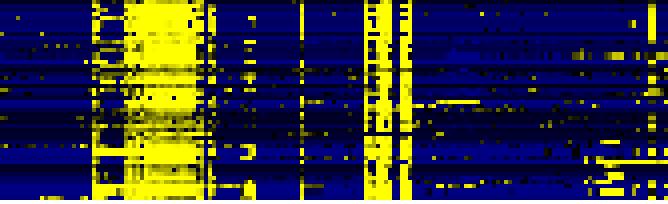
| Pathways co-expressed in the Organ and Tissue data set (with more than 9 annotation points) |
|
CYP706A7 (At4g12330) |
|
|
|
|
|
|
|
|
| max. difference between log2-ratios: |
3.8 |
|
|
|
|
|
|
|
|
|
|
|
|
| max. difference between log2-ratios excluding lowest and highest 5%: |
2.8 |
|
|
|
|
|
|
|
|
|
|
|
|
| Pathway |
Source |
Scores of Genes |
p[Score] |
No. of Genes |
p[genes] |
Link to organ heatmap |
|
|
|
|
|
|
|
| Stilbene, coumarine and lignin biosynthesis |
KEGG |
32 |
0.000 |
10 |
0.000 |
|
|
|
| Methane metabolism |
KEGG |
22 |
0.000 |
9 |
0.000 |
|
|
| Phenylalanine metabolism |
KEGG |
22 |
0.000 |
9 |
0.000 |
|
|
| Prostaglandin and leukotriene metabolism |
KEGG |
22 |
0.000 |
9 |
0.000 |
|
|
| monoterpenoid biosynthesis |
TAIR-GO |
19 |
0.000 |
2 |
0.000 |
|
|
| mono-/sesqui-/di-terpene biosynthesis |
LitPath |
19 |
0.000 |
2 |
0.027 |
|
|
| monoterpene biosynthesis |
LitPath |
19 |
0.000 |
2 |
0.000 |
|
|
| terpenoid metabolism |
LitPath |
19 |
0.000 |
2 |
0.029 |
|
|
| detoxification |
FunCat |
16 |
0.000 |
5 |
0.000 |
|
|
| triterpene, sterol, and brassinosteroid metabolism |
LitPath |
15 |
0.018 |
3 |
0.051 |
|
|
| Phenylpropanoid Metabolism |
BioPath |
14 |
0.000 |
2 |
0.005 |
|
|
| isoprenoid biosynthesis |
FunCat |
14 |
0.000 |
3 |
0.002 |
|
|
| lipid, fatty acid and isoprenoid biosynthesis |
FunCat |
14 |
0.000 |
3 |
0.001 |
|
|
| Biosynthesis of steroids |
KEGG |
13 |
0.000 |
2 |
0.013 |
|
|
|
|
|
|
|
|
|
|
|
| triterpene biosynthesis |
LitPath |
13 |
0.000 |
2 |
0.001 |
|
|
|
|
|
|
|
|
|
|
|
| detoxification involving cytochrome P450 |
FunCat |
12 |
0.000 |
3 |
0.000 |
|
|
|
|
|
|
|
|
|
|
|
| Glucosyltransferases for benzoic acids |
BioPath |
10 |
0.000 |
1 |
0.000 |
|
|
|
|
|
|
|
|
|
|
|
| fatty acid metabolism |
TAIR-GO |
10 |
0.000 |
1 |
0.010 |
|
|
|
|
|
|
|
|
|
|
|
| Ascorbate and aldarate metabolism |
KEGG |
10 |
0.000 |
1 |
0.029 |
|
|
|
|
|
|
|
|
|
|
|
| Fluorene degradation |
KEGG |
10 |
0.000 |
1 |
0.011 |
|
|
|
|
|
|
|
|
|
|
|
| gamma-Hexachlorocyclohexane degradation |
KEGG |
10 |
0.000 |
1 |
0.014 |
|
|
|
|
|
|
|
|
|
|
|
| Fatty acid elongation and wax and cutin metabolism |
AcylLipid |
10 |
0.000 |
1 |
0.232 |
|
|
|
|
|
|
|
|
|
|
|
| Miscellaneous acyl lipid metabolism |
AcylLipid |
10 |
0.020 |
5 |
0.006 |
|
|
|
|
|
|
|
|
|
|
|
| fatty acid modulation |
LitPath |
10 |
0.000 |
1 |
0.000 |
|
|
|
|
|
|
|
|
|
|
|
|
|
|
|
|
|
|
|
|
|
|
|
|
|
|
|
|
|
|
|
|
|
|
|
|
|
|
|
|
|
|
|
|
|
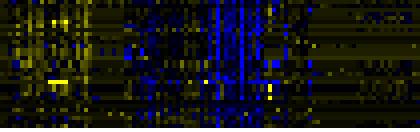
| Pathways co-expressed in the Hormone etc. data set (with more than 6 annotation points) |
|
CYP706A7 (At4g12330) |
|
|
|
|
|
|
|
|
| max. difference between log2-ratios: |
3.8 |
|
|
|
|
|
|
|
|
|
|
|
|
| max. difference between log2-ratios excluding lowest and highest 5%: |
2.4 |
|
|
|
|
|
|
|
|
|
|
|
|
| Pathway |
Source |
Scores of Genes |
p[Score] |
No. of Genes |
p[genes] |
Link to hormones etc. heatmap |
|
|
|
|
|
|
|
| Oxidative phosphorylation |
KEGG |
16 |
0.000 |
3 |
0.004 |
|
|
|
|
|
|
| Methane metabolism |
KEGG |
14 |
0.000 |
7 |
0.000 |
|
|
|
|
|
| Phenylalanine metabolism |
KEGG |
14 |
0.000 |
7 |
0.000 |
|
|
|
|
|
| Prostaglandin and leukotriene metabolism |
KEGG |
14 |
0.000 |
7 |
0.000 |
|
|
|
|
|
| Stilbene, coumarine and lignin biosynthesis |
KEGG |
14 |
0.000 |
7 |
0.000 |
|
|
|
|
|
| Cell Wall Carbohydrate Metabolism |
BioPath |
12.5 |
0.004 |
4 |
0.023 |
|
|
|
|
|
| pectin metabolism |
BioPath |
12.5 |
0.000 |
4 |
0.001 |
|
|
|
|
|
| Lipid signaling |
AcylLipid |
12 |
0.000 |
3 |
0.004 |
|
|
|
|
|
| Glucosyltransferases for benzoic acids |
BioPath |
10 |
0.000 |
1 |
0.002 |
|
|
|
|
|
|
|
|
|
|
|
| Phenylpropanoid Metabolism |
BioPath |
10 |
0.001 |
1 |
0.229 |
|
|
|
|
|
|
|
|
|
|
|
| flavonol biosynthesis |
AraCyc |
10 |
0.000 |
1 |
0.002 |
|
|
|
|
|
|
|
|
|
|
|
| biogenesis of cell wall |
FunCat |
8 |
0.000 |
2 |
0.006 |
|
|
|
|
|
|
|
|
|
|
|
| C-compound and carbohydrate metabolism |
FunCat |
8 |
0.017 |
2 |
0.212 |
|
|
|
|
|
|
|
|
|
|
|
| storage protein |
FunCat |
8 |
0.000 |
2 |
0.000 |
|
|
|
|
|
|
|
|
|
|
|
| Biosynthesis of steroids |
KEGG |
8 |
0.000 |
2 |
0.008 |
|
|
|
|
|
|
|
|
|
|
|
| Terpenoid biosynthesis |
KEGG |
8 |
0.000 |
2 |
0.001 |
|
|
|
|
|
|
|
|
|
|
|
|
|
|
|
|
|
|
|
|
|
|
|
|
|
|
|
|
|
|
|
|
|
|
|
|
|
|
|
|
|
|
|
|
|
|
|
|
|
|
|
|
|
|
|
|
|
|
|
|
|
|
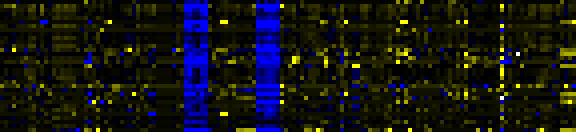
| Pathways co-expressed in the Mutant data set (with more than 10 annotation points) |
|
CYP706A7 (At4g12330) |
|
|
|
|
|
|
|
|
| max. difference between log2-ratios: |
4.2 |
|
|
|
|
|
|
|
|
|
|
|
|
| max. difference between log2-ratios excluding lowest and highest 5%: |
2.2 |
|
|
|
|
|
|
|
|
|
|
|
|
| Pathway |
Source |
Scores of Genes |
p[Score] |
No. of Genes |
p[genes] |
Link to mutants heatmap |
|
|
|
|
|
|
|
| Ribosome |
KEGG |
30 |
0.000 |
5 |
0.004 |
|
|
|
|
| Intermediary Carbon Metabolism |
BioPath |
26 |
0.000 |
3 |
0.032 |
|
|
|
| C-compound and carbohydrate metabolism |
FunCat |
26 |
0.011 |
3 |
0.225 |
|
|
|
| glycolysis and gluconeogenesis |
FunCat |
26 |
0.000 |
3 |
0.022 |
|
|
|
| Photosystems |
BioPath |
22 |
0.000 |
3 |
0.009 |
|
|
|
| additional photosystem II components |
BioPath |
16 |
0.000 |
2 |
0.003 |
|
|
|
| ATP synthase components |
BioPath |
16 |
0.000 |
2 |
0.000 |
|
|
|
| Gluconeogenesis from lipids in seeds |
BioPath |
16 |
0.000 |
2 |
0.015 |
|
|
|
| ATP synthesis coupled proton transport |
TAIR-GO |
16 |
0.000 |
2 |
0.000 |
|
|
|
|
|
|
|
|
|
|
|
| proton transport |
TAIR-GO |
16 |
0.000 |
2 |
0.000 |
|
|
|
|
|
|
|
|
|
|
|
| acetate fermentation |
AraCyc |
16 |
0.000 |
2 |
0.007 |
|
|
|
|
|
|
|
|
|
|
|
| fructose degradation (anaerobic) |
AraCyc |
16 |
0.000 |
2 |
0.005 |
|
|
|
|
|
|
|
|
|
|
|
| gluconeogenesis |
AraCyc |
16 |
0.000 |
2 |
0.002 |
|
|
|
|
|
|
|
|
|
|
|
| glyceraldehyde 3-phosphate degradation |
AraCyc |
16 |
0.000 |
2 |
0.000 |
|
|
|
|
|
|
|
|
|
|
|
| glycerol degradation II |
AraCyc |
16 |
0.000 |
2 |
0.002 |
|
|
|
|
|
|
|
|
|
|
|
| glycolysis I |
AraCyc |
16 |
0.000 |
2 |
0.036 |
|
|
|
|
|
|
|
|
|
|
|
| glycolysis IV |
AraCyc |
16 |
0.000 |
2 |
0.006 |
|
|
|
|
|
|
|
|
|
|
|
| sorbitol fermentation |
AraCyc |
16 |
0.000 |
2 |
0.006 |
|
|
|
|
|
|
|
|
|
|
|
| Glycolysis / Gluconeogenesis |
KEGG |
16 |
0.000 |
2 |
0.013 |
|
|
|
|
|
|
|
|
|
|
|
| isoprenoid biosynthesis |
FunCat |
11 |
0.003 |
2 |
0.018 |
|
|
|
|
|
|
|
|
|
|
|
| lipid, fatty acid and isoprenoid biosynthesis |
FunCat |
11 |
0.001 |
2 |
0.012 |
|
|
|
|
|
|
|
|
|
|
|
|
|
|
|
|
|
|
|
|
|
|
|
|
|
|
|
|