| _________________________________________ |
|
|
|
|
|
|
|
|
|
|
|
|
|
|
|
| Pathways co-expressed in the 2 data sets with co-expressed pathways (with more than 6 annotation points each) |
|
Find below a list of pathways that are co-expressed with the bait. First a list of pathways is given that are co-expressed in all data sets. Lists for each individual dataset are shown underneath. Depending on the number of co-expressed pathways only the top scoring pathways are given; all data can be saved as text using the link above. |
|
|
|
|
|
|
| Pathway |
Source |
Sum of scores |
Sum of genes |
|
|
|
|
|
|
|
| secondary metabolism |
FunCat |
42 |
7 |
|
|
|
|
|
|
|
| Biosynthesis of Amino Acids and Derivatives |
BioPath |
40 |
7 |
|
|
|
|
|
|
|
| jasmonic acid biosynthesis |
TAIR-GO |
40 |
8 |
|
|
|
|
|
|
|
|
|
| jasmonic acid biosynthesis |
TAIR-GO |
40 |
8 |
|
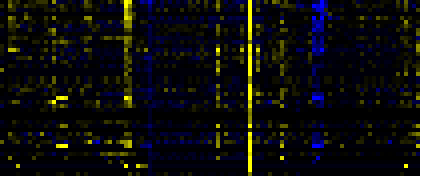
To the right of each table a thumbnail of the actual co-expression heatmap is given. Klick on the link to see the heatmap containing all co-expressed genes. |
|
|
|
|
|
|
|
|
| Methionin/SAM/ethylene metabolism from cysteine and aspartate |
BioPath |
34 |
6 |
|
|
|
|
|
|
|
|
|
| Benzoate degradation via CoA ligation |
KEGG |
31 |
11 |
|
|
|
|
|
|
|
|
|
| Inositol phosphate metabolism |
KEGG |
31 |
11 |
|
For more information on how these pathway maps were generated please read the methods page |
|
|
|
|
|
|
|
|
| Nicotinate and nicotinamide metabolism |
KEGG |
31 |
11 |
|
|
|
|
|
|
|
|
|
| Chlorophyll biosynthesis and breakdown |
BioPath |
30 |
3 |
|
|
|
|
|
|
|
|
|
|
|
|
|
| biosynthesis of proto- and siroheme |
AraCyc |
30 |
3 |
|
|
|
|
|
|
|
|
|
|
|
|
|
| Porphyrin and chlorophyll metabolism |
KEGG |
30 |
3 |
|
|
|
|
|
|
|
|
|
|
|
|
|
| chlorophyll and phytochromobilin metabolism |
LitPath |
30 |
3 |
|
|
|
|
|
|
|
|
|
|
|
|
|
| response to wounding |
TAIR-GO |
28 |
6 |
|
|
|
|
|
|
|
|
|
|
|
|
|
| defense response |
TAIR-GO |
23 |
5 |
|
|
|
|
|
|
|
|
|
|
|
|
|
| phospholipid biosynthesis II |
AraCyc |
22 |
3 |
|
|
|
|
|
|
|
|
|
|
|
|
|
| Leaf Glycerolipid Biosynthesis in Plastid |
BioPath |
20 |
2 |
|
|
|
|
|
|
|
|
|
|
|
|
|
| gibberellic acid catabolism |
TAIR-GO |
20 |
2 |
|
|
|
|
|
|
|
|
|
|
|
|
|
| growth |
TAIR-GO |
20 |
4 |
|
|
|
|
|
|
|
|
|
|
|
|
|
| lipid metabolism |
TAIR-GO |
20 |
2 |
|
|
|
|
|
|
|
|
|
|
|
|
|
| phenylpropanoid metabolism |
TAIR-GO |
20 |
2 |
|
|
|
|
|
|
|
|
|
|
|
|
|
| phospholipid metabolism |
TAIR-GO |
20 |
2 |
|
|
|
|
|
|
|
|
|
|
|
|
|
| lipoxygenase pathway |
AraCyc |
20 |
4 |
|
|
|
|
|
|
|
|
|
|
|
|
|
| triacylglycerol biosynthesis |
AraCyc |
20 |
2 |
|
|
|
|
|
|
|
|
|
|
|
|
|
| aerobic respiration |
FunCat |
20 |
2 |
|
|
|
|
|
|
|
|
|
|
|
|
|
| biogenesis of chloroplast |
FunCat |
20 |
2 |
|
|
|
|
|
|
|
|
|
|
|
|
|
| respiration |
FunCat |
20 |
2 |
|
|
|
|
|
|
|
|
|
|
|
|
|
| Diterpenoid biosynthesis |
KEGG |
20 |
2 |
|
|
|
|
|
|
|
|
|
|
|
|
|
| Synthesis of membrane lipids in plastids |
AcylLipid |
20 |
2 |
|
|
|
|
|
|
|
|
|
|
|
|
|
| Gibberellin metabolism |
LitPath |
20 |
2 |
|
|
|
|
|
|
|
|
|
|
|
|
|
| giberelin catabolism |
LitPath |
20 |
2 |
|
|
|
|
|
|
|
|
|
|
|
|
|
| phytochromobilin biosynthesis |
LitPath |
20 |
2 |
|
|
|
|
|
|
|
|
|
|
|
|
|
| biogenesis of cell wall |
FunCat |
18 |
3 |
|
|
|
|
|
|
|
|
|
|
|
|
|
| cellulose biosynthesis |
BioPath |
16 |
2 |
|
|
|
|
|
|
|
|
|
|
|
|
|
| hemicellulose biosynthesis |
BioPath |
16 |
2 |
|
|
|
|
|
|
|
|
|
|
|
|
|
|
|
|
|
|
|
|
|
|
|
|
|
|
|
|
|
|
|
|
|
|
|
|
|
|
|
|
|
|
|
|
|
|
|
| Pathways co-expressed in the Hormone etc. data set (with more than 10 annotation points) |
|
CYP707A3 (At5g45340) |
|
|
|
|
|
|
|
|
| max. difference between log2-ratios: |
10.4 |
|
|
|
|
|
|
|
|
|
|
|
|
| max. difference between log2-ratios excluding lowest and highest 5%: |
2.2 |
|
|
|
|
|
|
|
|
|
|
|
|
| Pathway |
Source |
Scores of Genes |
p[Score] |
No. of Genes |
p[genes] |
Link to hormones etc. heatmap |
|
|
|
|
|
|
|
| secondary metabolism |
FunCat |
22 |
0.000 |
4 |
0.000 |
|
|
|
|
|
|
| Plastidial Isoprenoids (Chlorophylls, Carotenoids, Tocopherols, Plastoquinone, Phylloquinone) |
BioPath |
20 |
0.000 |
2 |
0.055 |
|
|
|
|
|
| Chlorophyll biosynthesis and breakdown |
BioPath |
20 |
0.000 |
2 |
0.005 |
|
|
|
|
|
| Biosynthesis of Amino Acids and Derivatives |
BioPath |
20 |
0.001 |
4 |
0.027 |
|
|
|
|
|
| biosynthesis of proto- and siroheme |
AraCyc |
20 |
0.000 |
2 |
0.006 |
|
|
|
|
|
| Porphyrin and chlorophyll metabolism |
KEGG |
20 |
0.000 |
2 |
0.002 |
|
|
|
|
|
| chlorophyll and phytochromobilin metabolism |
LitPath |
20 |
0.000 |
2 |
0.010 |
|
|
|
|
|
| Lipid signaling |
AcylLipid |
18 |
0.004 |
4 |
0.112 |
|
|
|
|
|
| Methionin/SAM/ethylene metabolism from cysteine and aspartate |
BioPath |
14 |
0.000 |
3 |
0.000 |
|
|
|
|
|
| response to wounding |
TAIR-GO |
14 |
0.000 |
3 |
0.000 |
|
|
|
|
|
| defense response |
TAIR-GO |
13 |
0.000 |
3 |
0.000 |
|
|
|
|
|
|
|
|
|
|
|
|
|
|
|
|
|
|
|
|
|
|
|
|
|
|
|
|
|
|
|
|
|
|
|
|
|
|
|
|
|
|
|
|
|
|
|
|
|
|
|
|
|
|
|
|
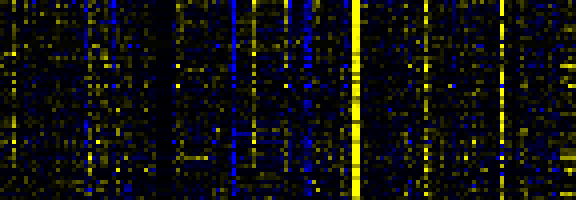
| Pathways co-expressed in the Mutant data set (with more than 10 annotation points) |
|
CYP707A3 (At5g45340) |
|
|
|
|
|
|
|
|
| max. difference between log2-ratios: |
9.7 |
|
|
|
|
|
|
|
|
|
|
|
|
| max. difference between log2-ratios excluding lowest and highest 5%: |
3.2 |
|
|
|
|
|
|
|
|
|
|
|
|
| Pathway |
Source |
Scores of Genes |
p[Score] |
No. of Genes |
p[genes] |
Link to mutants heatmap |
|
|
|
|
|
|
|
| Benzoate degradation via CoA ligation |
KEGG |
21 |
0.000 |
7 |
0.000 |
|
|
|
|
| Inositol phosphate metabolism |
KEGG |
21 |
0.000 |
7 |
0.000 |
|
|
|
| Nicotinate and nicotinamide metabolism |
KEGG |
21 |
0.000 |
7 |
0.000 |
|
|
|
| Biosynthesis of Amino Acids and Derivatives |
BioPath |
20 |
0.007 |
3 |
0.104 |
|
|
|
| Methionin/SAM/ethylene metabolism from cysteine and aspartate |
BioPath |
20 |
0.000 |
3 |
0.000 |
|
|
|
| secondary metabolism |
FunCat |
20 |
0.000 |
3 |
0.002 |
|
|
|
| Miscellaneous acyl lipid metabolism |
AcylLipid |
16 |
0.021 |
3 |
0.339 |
|
|
|
| Nucleotide sugars metabolism |
KEGG |
15 |
0.000 |
2 |
0.002 |
|
|
|
| Aromatic amino acid (Phe, Tyr, Trp) metabolism |
BioPath |
14 |
0.000 |
3 |
0.003 |
|
|
|
| response to wounding |
TAIR-GO |
14 |
0.000 |
3 |
0.000 |
|
|
|
| Phenylpropanoid pathway |
LitPath |
14 |
0.003 |
3 |
0.041 |
|
|
|
| colanic acid building blocks biosynthesis |
AraCyc |
12 |
0.000 |
2 |
0.029 |
|
|
|
| phospholipid biosynthesis II |
AraCyc |
12 |
0.000 |
2 |
0.002 |
|
|
|
|
|
|
|
|
|
|
|
| C-compound and carbohydrate utilization |
FunCat |
12 |
0.000 |
2 |
0.000 |
|
|
|
|
|
|
|
|
|
|
|
| nucleotide metabolism |
FunCat |
12 |
0.000 |
2 |
0.000 |
|
|
|
|
|
|
|
|
|
|
|
|
|
|
|
|
|
|
|
|
|
|
|
|
|
|
|
|