|
|
|
|
|
|
|
|
|
|
|
|
|
|
|
|
|
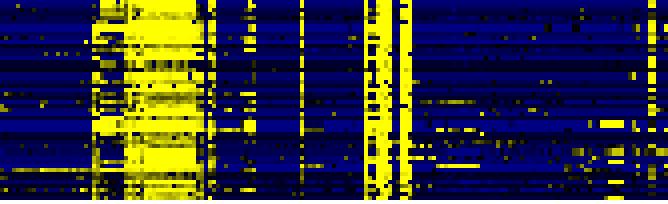
| Pathways co-expressed in the Organ and Tissue data set (with more than 10 annotation points) |
|
CYP708A2 (At5g48000) |
|
|
|
|
|
|
|
|
| max. difference between log2-ratios: |
8.5 |
|
|
|
|
|
|
|
|
|
|
|
|
| max. difference between log2-ratios excluding lowest and highest 5%: |
7.1 |
|
|
|
|
|
|
|
|
|
|
|
|
| Pathway |
Source |
Scores of Genes |
p[Score] |
No. of Genes |
p[genes] |
Link to organ heatmap |
|
|
|
|
|
|
|
| Stilbene, coumarine and lignin biosynthesis |
KEGG |
46 |
0.000 |
17 |
0.000 |
|
|
|
| Phenylalanine metabolism |
KEGG |
45 |
0.000 |
17 |
0.000 |
|
|
| Methane metabolism |
KEGG |
40 |
0.000 |
17 |
0.000 |
|
|
| Prostaglandin and leukotriene metabolism |
KEGG |
36 |
0.000 |
16 |
0.000 |
|
|
| Phenylpropanoid Metabolism |
BioPath |
22 |
0.000 |
5 |
0.003 |
|
|
| isoprenoid biosynthesis |
FunCat |
22 |
0.000 |
5 |
0.001 |
|
|
| lipid, fatty acid and isoprenoid biosynthesis |
FunCat |
22 |
0.000 |
5 |
0.000 |
|
|
| Miscellaneous acyl lipid metabolism |
AcylLipid |
20 |
0.003 |
10 |
0.000 |
|
|
| monoterpenoid biosynthesis |
TAIR-GO |
19 |
0.000 |
2 |
0.000 |
|
|
| detoxification |
FunCat |
19 |
0.000 |
6 |
0.000 |
|
|
| mono-/sesqui-/di-terpene biosynthesis |
LitPath |
19 |
0.000 |
2 |
0.066 |
|
|
| monoterpene biosynthesis |
LitPath |
19 |
0.000 |
2 |
0.000 |
|
|
| terpenoid metabolism |
LitPath |
19 |
0.000 |
2 |
0.071 |
|
|
| Fatty acid elongation and wax and cutin metabolism |
AcylLipid |
18 |
0.000 |
3 |
0.100 |
|
|
|
|
|
|
|
|
|
|
|
| Lipid signaling |
AcylLipid |
18 |
0.042 |
3 |
0.596 |
|
|
|
|
|
|
|
|
|
|
|
| cation transport (Na, K, Ca , NH4, etc.) |
FunCat |
17 |
0.000 |
2 |
0.000 |
|
|
|
|
|
|
|
|
|
|
|
| heavy metal ion transport (Cu, Fe, etc.) |
FunCat |
17 |
0.000 |
2 |
0.000 |
|
|
|
|
|
|
|
|
|
|
|
| ion transport |
FunCat |
17 |
0.000 |
2 |
0.000 |
|
|
|
|
|
|
|
|
|
|
|
| transport |
FunCat |
17 |
0.000 |
2 |
0.000 |
|
|
|
|
|
|
|
|
|
|
|
| transport facilitation |
FunCat |
17 |
0.000 |
2 |
0.000 |
|
|
|
|
|
|
|
|
|
|
|
| transported compounds (substrates) |
FunCat |
17 |
0.000 |
2 |
0.000 |
|
|
|
|
|
|
|
|
|
|
|
| triterpene, sterol, and brassinosteroid metabolism |
LitPath |
17 |
0.015 |
4 |
0.047 |
|
|
|
|
|
|
|
|
|
|
|
| Biosynthesis of steroids |
KEGG |
13 |
0.008 |
2 |
0.111 |
|
|
|
|
|
|
|
|
|
|
|
| Tryptophan metabolism |
KEGG |
13 |
0.000 |
2 |
0.054 |
|
|
|
|
|
|
|
|
|
|
|
| Tyrosine metabolism |
KEGG |
13 |
0.000 |
2 |
0.080 |
|
|
|
|
|
|
|
|
|
|
|
| triterpene biosynthesis |
LitPath |
13 |
0.000 |
2 |
0.003 |
|
|
|
|
|
|
|
|
|
|
|
| biosynthesis of secondary products derived from primary amino acids |
FunCat |
11 |
0.000 |
3 |
0.000 |
|
|
|
|
|
|
|
|
|
|
|
| detoxification involving cytochrome P450 |
FunCat |
11 |
0.000 |
2 |
0.001 |
|
|
|
|
|
|
|
|
|
|
|
| Arginine and proline metabolism |
KEGG |
11 |
0.001 |
2 |
0.090 |
|
|
|
|
|
|
|
|
|
|
|
|
|
|
|
|
|
|
|
|
|
|
|
|
|
|
|
|
|
|
|
|
|
|
|
|
|
|
|
|
|
|
|
|
|
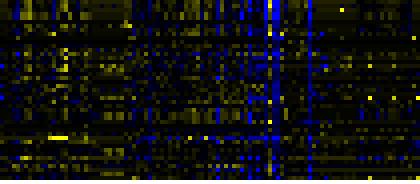
| Pathways co-expressed in the Hormone etc. data set (with more than 6 annotation points) |
|
CYP708A2 (At5g48000) |
|
|
|
|
|
|
|
|
| max. difference between log2-ratios: |
7.6 |
|
|
|
|
|
|
|
|
|
|
|
|
| max. difference between log2-ratios excluding lowest and highest 5%: |
2.3 |
|
|
|
|
|
|
|
|
|
|
|
|
| Pathway |
Source |
Scores of Genes |
p[Score] |
No. of Genes |
p[genes] |
Link to hormones etc. heatmap |
|
|
|
|
|
|
|
| Stilbene, coumarine and lignin biosynthesis |
KEGG |
34 |
0.000 |
5 |
0.000 |
|
|
|
|
|
|
| Phenylpropanoid Metabolism |
BioPath |
33 |
0.000 |
6 |
0.002 |
|
|
|
|
|
| glucosinolate biosynthesis |
TAIR-GO |
20 |
0.000 |
2 |
0.000 |
|
|
|
|
|
| response to UV |
TAIR-GO |
20 |
0.000 |
2 |
0.000 |
|
|
|
|
|
| glucosinolate biosynthesis from homomethionine |
AraCyc |
20 |
0.000 |
2 |
0.000 |
|
|
|
|
|
| secondary metabolism |
FunCat |
20 |
0.000 |
4 |
0.000 |
|
|
|
|
|
| Ascorbate and aldarate metabolism |
KEGG |
20 |
0.000 |
2 |
0.001 |
|
|
|
|
|
| Fluorene degradation |
KEGG |
20 |
0.000 |
2 |
0.000 |
|
|
|
|
|
| gamma-Hexachlorocyclohexane degradation |
KEGG |
20 |
0.000 |
2 |
0.000 |
|
|
|
|
|
| flavonoid, anthocyanin, and proanthocyanidin biosynthesis |
LitPath |
20 |
0.000 |
2 |
0.004 |
|
|
|
|
|
| Glucosinolate Metabolism |
LitPath |
20 |
0.000 |
2 |
0.020 |
|
|
|
|
|
| proanthocyanidin biosynthesis |
LitPath |
20 |
0.000 |
2 |
0.004 |
|
|
|
|
|
|
|
|
|
|
|
| monoterpenoid biosynthesis |
TAIR-GO |
19 |
0.000 |
2 |
0.000 |
|
|
|
|
|
|
|
|
|
|
|
| mono-/sesqui-/di-terpene biosynthesis |
LitPath |
19 |
0.000 |
2 |
0.074 |
|
|
|
|
|
|
|
|
|
|
|
| monoterpene biosynthesis |
LitPath |
19 |
0.000 |
2 |
0.000 |
|
|
|
|
|
|
|
|
|
|
|
| terpenoid metabolism |
LitPath |
19 |
0.000 |
2 |
0.080 |
|
|
|
|
|
|
|
|
|
|
|
| dTDP-rhamnose biosynthesis |
AraCyc |
15 |
0.000 |
3 |
0.001 |
|
|
|
|
|
|
|
|
|
|
|
| anthocyanin biosynthesis |
AraCyc |
14 |
0.000 |
2 |
0.000 |
|
|
|
|
|
|
|
|
|
|
|
| Flavonoid biosynthesis |
KEGG |
14 |
0.000 |
2 |
0.000 |
|
|
|
|
|
|
|
|
|
|
|
| Flavonoid and anthocyanin metabolism |
BioPath |
13 |
0.000 |
3 |
0.002 |
|
|
|
|
|
|
|
|
|
|
|
| detoxification |
FunCat |
13 |
0.000 |
3 |
0.000 |
|
|
|
|
|
|
|
|
|
|
|
| core phenylpropanoid metabolism |
BioPath |
12 |
0.000 |
2 |
0.011 |
|
|
|
|
|
|
|
|
|
|
|
| colanic acid building blocks biosynthesis |
AraCyc |
12 |
0.000 |
3 |
0.002 |
|
|
|
|
|
|
|
|
|
|
|
| detoxification involving cytochrome P450 |
FunCat |
11 |
0.000 |
2 |
0.000 |
|
|
|
|
|
|
|
|
|
|
|
|
|
|
|
|
|
|
|
|
|
|
|
|
|
|
|
|
|
|
|
|
|
|
|
|
|
|
|
|
|
|
|
|
|
|
|
|
|
|
|
|
|
|
|
|
|
|
|
|
|
|
| Pathways co-expressed in the Mutant data set (with more than 6 annotation points) |
|
CYP708A2 (At5g48000) |
|
|
|
|
|
|
|
|
| max. difference between log2-ratios: |
8.3 |
|
|
|
|
|
|
|
|
|
|
|
|
| max. difference between log2-ratios excluding lowest and highest 5%: |
4.5 |
|
|
|
|
|
|
|
|
|
|
|
|
| Pathway |
Source |
Scores of Genes |
p[Score] |
No. of Genes |
p[genes] |
Link to mutants heatmap |
|
|
|
|
|
|
|
| isoprenoid biosynthesis |
FunCat |
17 |
0.000 |
3 |
0.000 |

|
|
|
|
| lipid, fatty acid and isoprenoid biosynthesis |
FunCat |
17 |
0.000 |
3 |
0.000 |
|
|
|
| triterpene, sterol, and brassinosteroid metabolism |
LitPath |
15 |
0.000 |
3 |
0.004 |
|
|
|
| Fatty acid elongation and wax and cutin metabolism |
AcylLipid |
14 |
0.000 |
2 |
0.000 |
|
|
|
| Biosynthesis of steroids |
KEGG |
13 |
0.000 |
2 |
0.000 |
|
|
|
| triterpene biosynthesis |
LitPath |
13 |
0.000 |
2 |
0.000 |
|
|
|
|
|
|
|
|
|
|
|
| detoxification |
FunCat |
11 |
0.000 |
2 |
0.000 |
|
|
|
|
|
|
|
|
|
|
|
| detoxification involving cytochrome P450 |
FunCat |
11 |
0.000 |
2 |
0.000 |
|
|
|
|
|
|
|
|
|
|
|
| additional photosystem II components |
BioPath |
10 |
0.000 |
1 |
0.001 |
|
|
|
|
|
|
|
|
|
|
|
| ATP synthase components |
BioPath |
10 |
0.000 |
1 |
0.000 |
|
|
|
|
|
|
|
|
|
|
|
| Intermediary Carbon Metabolism |
BioPath |
10 |
0.000 |
1 |
0.019 |
|
|
|
|
|
|
|
|
|
|
|
| Photosystems |
BioPath |
10 |
0.000 |
1 |
0.009 |
|
|
|
|
|
|
|
|
|
|
|
| ATP synthesis coupled proton transport |
TAIR-GO |
10 |
0.000 |
1 |
0.000 |
|
|
|
|
|
|
|
|
|
|
|
| fatty acid metabolism |
TAIR-GO |
10 |
0.000 |
1 |
0.002 |
|
|
|
|
|
|
|
|
|
|
|
| proton transport |
TAIR-GO |
10 |
0.000 |
1 |
0.000 |
|
|
|
|
|
|
|
|
|
|
|
| proton-transporting ATP synthase, catalytic core (sensu Eukaryota) |
TAIR-GO |
10 |
0.000 |
1 |
0.000 |
|
|
|
|
|
|
|
|
|
|
|
| Calvin cycle |
AraCyc |
10 |
0.000 |
1 |
0.002 |
|
|
|
|
|
|
|
|
|
|
|
| glycolysis and gluconeogenesis |
FunCat |
10 |
0.001 |
1 |
0.132 |
|
|
|
|
|
|
|
|
|
|
|
| photosynthesis |
FunCat |
10 |
0.000 |
1 |
0.023 |
|
|
|
|
|
|
|
|
|
|
|
| Ascorbate and aldarate metabolism |
KEGG |
10 |
0.000 |
1 |
0.002 |
|
|
|
|
|
|
|
|
|
|
|
| Carbon fixation |
KEGG |
10 |
0.000 |
1 |
0.011 |
|
|
|
|
|
|
|
|
|
|
|
| Fluorene degradation |
KEGG |
10 |
0.000 |
1 |
0.001 |
|
|
|
|
|
|
|
|
|
|
|
| gamma-Hexachlorocyclohexane degradation |
KEGG |
10 |
0.000 |
1 |
0.001 |
|
|
|
|
|
|
|
|
|
|
|
| Glyoxylate and dicarboxylate metabolism |
KEGG |
10 |
0.000 |
1 |
0.002 |
|
|
|
|
|
|
|
|
|
|
|
| Stilbene, coumarine and lignin biosynthesis |
KEGG |
10 |
0.000 |
1 |
0.025 |
|
|
|
|
|
|
|
|
|
|
|
| fatty acid modulation |
LitPath |
10 |
0.000 |
1 |
0.000 |
|
|
|
|
|
|
|
|
|
|
|
| secondary metabolism |
FunCat |
8 |
0.000 |
2 |
0.004 |
|
|
|
|
|
|
|
|
|
|
|
| pentacyclic triterpenoid biosynthesis |
TAIR-GO |
7 |
0.000 |
1 |
0.000 |
|
|
|
|
|
|
|
|
|
|
|
|
|
|
|
|
|
|
|
|
|
|
|
|
|
|
|
|