|
|
|
|
|
|
|
|
|
|
|
|
|
|
|
|
|
| Pathways co-expressed in the 2 data sets applicable (with more than 6 annotation points each) |
|
|
|
|
|
|
|
|
|
|
|
|
|
| Pathway |
Source |
Sum of scores |
Sum of genes |
|
Find below lists of pathways that are co-expressed with the bait. First a list of pathways is given that are co-expressed in all data sets. Lists for each individual dataset are shown underneath. To the right of each table a thumbnail of the actual co-expression heatmap is given. Klick on the link to see the heatmap containing all co-expressed genes. |
|
|
|
|
|
|
|
|
|
| gamma-Hexachlorocyclohexane degradation |
KEGG |
60 |
6 |
|
|
|
|
|
|
|
|
|
|
| Fluorene degradation |
KEGG |
50 |
7 |
|
|
|
|
|
|
|
|
|
|
| Ascorbate and aldarate metabolism |
KEGG |
49 |
5 |
|
|
|
|
|
|
|
|
|
|
| Prostaglandin and leukotriene metabolism |
KEGG |
49 |
5 |
|
|
|
|
|
|
|
|
|
|
| Phenylalanine metabolism |
KEGG |
49 |
5 |
|
For more information on how these pathway maps were generated please read the methods page |
|
|
|
|
|
|
|
|
|
| Methane metabolism |
KEGG |
49 |
5 |
|
|
|
|
|
|
|
|
|
|
| Glucosinolate Metabolism |
LitPath |
42 |
5 |
|
|
|
|
|
|
|
|
|
|
|
|
|
| Stilbene, coumarine and lignin biosynthesis |
KEGG |
40 |
5 |
|
|
|
|
|
|
|
|
|
|
|
|
|
| mono-/sesqui-/di-terpene biosynthesis |
LitPath |
40 |
4 |
|
|
|
|
|
|
|
|
|
|
|
|
|
| terpenoid metabolism |
LitPath |
40 |
4 |
|
|
|
|
|
|
|
|
|
|
|
|
|
| monoterpene biosynthesis |
LitPath |
40 |
4 |
|
|
|
|
|
|
|
|
|
|
|
|
|
| response to UV |
TAIR-GO |
28 |
4 |
|
|
|
|
|
|
|
|
|
|
|
|
|
| tryptophan catabolism |
TAIR-GO |
28 |
4 |
|
|
|
|
|
|
|
|
|
|
|
|
|
| chloroplast thylakoid membrane protein import |
TAIR-GO |
28 |
4 |
|
|
|
|
|
|
|
|
|
|
|
|
|
| monoterpenoid biosynthesis |
TAIR-GO |
28 |
4 |
|
|
|
|
|
|
|
|
|
|
|
|
|
| glucosinolate biosynthesis |
TAIR-GO |
28 |
4 |
|
|
|
|
|
|
|
|
|
|
|
|
|
|
|
|
|
|
|
|
|
|
|
|
|
|
|
|
|
|
|
|
|
|
|
|
|
|
|
|
|
|
|
|
|
|
|
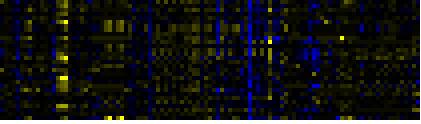
| Pathways co-expressed in the Hormone etc. data set (with more than 6 annotation points) |
|
CYP710A2 (At2g34490) |
|
|
|
|
|
|
|
|
| max. difference between log2-ratios: |
3.52 |
|
|
|
|
|
|
|
|
|
|
|
|
| max. difference between log2-ratios excluding lowest and highest 5%: |
1.49 |
|
|
|
|
|
|
|
|
|
|
|
|
| Pathway |
Source |
Scores of Genes |
p[Score] |
No. of Genes |
p[genes] |
Link to hormones etc. heatmap |
|
|
|
|
|
|
|
| Glucosinolate Metabolism |
LitPath |
30 |
0.000 |
3 |
0.000 |
|
|
|
|
|
|
|
| Stilbene, coumarine and lignin biosynthesis |
KEGG |
20 |
0.000 |
4 |
0.000 |
|
|
|
|
|
|
| monoterpenoid biosynthesis |
TAIR-GO |
19 |
0.000 |
2 |
0.000 |
|
|
|
|
|
|
| mono-/sesqui-/di-terpene biosynthesis |
LitPath |
19 |
0.000 |
2 |
0.008 |
|
|
|
|
|
|
| monoterpene biosynthesis |
LitPath |
19 |
0.000 |
2 |
0.000 |
|
|
|
|
|
|
| terpenoid metabolism |
LitPath |
19 |
0.000 |
2 |
0.009 |
|
|
|
|
|
|
| Phenylpropanoid Metabolism |
BioPath |
12 |
0.000 |
2 |
0.023 |
|
|
|
|
|
|
| Biosynthesis of Amino Acids and Derivatives |
BioPath |
10 |
0.003 |
2 |
0.021 |
|
|
|
|
|
|
| Flavonoid and anthocyanin metabolism |
BioPath |
10 |
0.000 |
1 |
0.017 |
|
|
|
|
|
|
|
|
|
|
|
| Pathway for nuclear-encoded, thylakoid-localized proteins |
BioPath |
10 |
0.000 |
1 |
0.001 |
|
|
|
|
|
|
|
|
|
|
|
| SRP (signal recognition particle)-dependent pathway for integral membrane proteins |
BioPath |
10 |
0.000 |
1 |
0.000 |
|
|
|
|
|
|
|
|
|
|
|
| chloroplast thylakoid membrane protein import |
TAIR-GO |
10 |
0.000 |
1 |
0.000 |
|
|
|
|
|
|
|
|
|
|
|
| glucosinolate biosynthesis |
TAIR-GO |
10 |
0.000 |
1 |
0.001 |
|
|
|
|
|
|
|
|
|
|
|
| response to UV |
TAIR-GO |
10 |
0.000 |
1 |
0.002 |
|
|
|
|
|
|
|
|
|
|
|
| tryptophan catabolism |
TAIR-GO |
10 |
0.000 |
1 |
0.000 |
|
|
|
|
|
|
|
|
|
|
|
| glucosinolate biosynthesis from homomethionine |
AraCyc |
10 |
0.000 |
1 |
0.000 |
|
|
|
|
|
|
|
|
|
|
|
| glucosinolate biosynthesis from phenylalanine |
AraCyc |
10 |
0.000 |
1 |
0.000 |
|
|
|
|
|
|
|
|
|
|
|
| glucosinolate biosynthesis from tryptophan |
AraCyc |
10 |
0.000 |
1 |
0.000 |
|
|
|
|
|
|
|
|
|
|
|
| IAA biosynthesis |
AraCyc |
10 |
0.000 |
1 |
0.001 |
|
|
|
|
|
|
|
|
|
|
|
| IAA biosynthesis I |
AraCyc |
10 |
0.000 |
1 |
0.000 |
|
|
|
|
|
|
|
|
|
|
|
| Ascorbate and aldarate metabolism |
KEGG |
10 |
0.000 |
1 |
0.006 |
|
|
|
|
|
|
|
|
|
|
|
| Fluorene degradation |
KEGG |
10 |
0.000 |
1 |
0.002 |
|
|
|
|
|
|
|
|
|
|
|
| gamma-Hexachlorocyclohexane degradation |
KEGG |
10 |
0.000 |
1 |
0.003 |
|
|
|
|
|
|
|
|
|
|
|
| Methane metabolism |
KEGG |
10 |
0.000 |
3 |
0.001 |
|
|
|
|
|
|
|
|
|
|
|
| Phenylalanine metabolism |
KEGG |
10 |
0.000 |
3 |
0.001 |
|
|
|
|
|
|
|
|
|
|
|
| Prostaglandin and leukotriene metabolism |
KEGG |
10 |
0.000 |
3 |
0.000 |
|
|
|
|
|
|
|
|
|
|
|
| monoterpene biosynthesis |
AraCyc |
9 |
0.000 |
1 |
0.000 |
|
|
|
|
|
|
|
|
|
|
|
| plant monoterpene biosynthesis |
AraCyc |
9 |
0.000 |
1 |
0.000 |
|
|
|
|
|
|
|
|
|
|
|
| Lipid signaling |
AcylLipid |
8 |
0.000 |
2 |
0.050 |
|
|
|
|
|
|
|
|
|
|
|
|
|
|
|
|
|
|
|
|
|
|
|
|
|
|
|
|
|
|
|
|
|
|
|
|
|
|
|
|
|
|
|
|
|
|
|
|
|
|
|
|
|
|
|
|
|
|
|
|
|
|
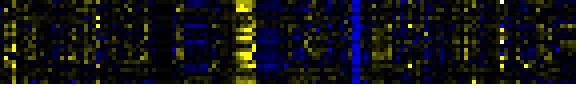
| Pathways co-expressed in the Mutant data set (with more than 9 annotation points) |
|
CYP710A2 (At2g34490) |
|
|
|
|
|
|
|
|
| max. difference between log2-ratios: |
4.73 |
|
|
|
|
|
|
|
|
|
|
|
|
| max. difference between log2-ratios excluding lowest and highest 5%: |
2.23 |
|
|
|
|
|
|
|
|
|
|
|
|
| Pathway |
Source |
Scores of Genes |
p[Score] |
No. of Genes |
p[genes] |
Link to mutants heatmap |
|
|
|
|
|
|
|
| Glucosinolate Metabolism |
LitPath |
30 |
0.000 |
3 |
0.000 |
|
|
|
|
|
| Phenylpropanoid Metabolism |
BioPath |
22 |
0.000 |
3 |
0.013 |
|
|
|
|
| Biosynthesis of Amino Acids and Derivatives |
BioPath |
18 |
0.000 |
3 |
0.012 |
|
|
|
|
| Branched-chain amino acids from aspartate |
BioPath |
18 |
0.000 |
3 |
0.000 |
|
|
|
|
| gamma-Hexachlorocyclohexane degradation |
KEGG |
18 |
0.000 |
3 |
0.000 |
|
|
|
|
| transport |
FunCat |
15 |
0.000 |
2 |
0.000 |
|
|
|
|
| transport ATPases |
FunCat |
15 |
0.000 |
2 |
0.000 |
|
|
|
|
|
|
|
|
|
|
|
| transport facilitation |
FunCat |
15 |
0.000 |
2 |
0.000 |
|
|
|
|
|
|
|
|
|
|
|
| leucine biosynthesis |
AraCyc |
14 |
0.000 |
2 |
0.000 |
|
|
|
|
|
|
|
|
|
|
|
| amino acid metabolism |
FunCat |
14 |
0.000 |
2 |
0.010 |
|
|
|
|
|
|
|
|
|
|
|
| core phenylpropanoid metabolism |
BioPath |
12 |
0.000 |
2 |
0.002 |
|
|
|
|
|
|
|
|
|
|
|
| Phenylpropanoid pathway |
LitPath |
12 |
0.000 |
2 |
0.013 |
|
|
|
|
|
|
|
|
|
|
|
| Flavonoid and anthocyanin metabolism |
BioPath |
10 |
0.000 |
1 |
0.037 |
|
|
|
|
|
|
|
|
|
|
|
| glucosinolate biosynthesis |
TAIR-GO |
10 |
0.000 |
1 |
0.000 |
|
|
|
|
|
|
|
|
|
|
|
| leucine biosynthesis |
TAIR-GO |
10 |
0.000 |
1 |
0.000 |
|
|
|
|
|
|
|
|
|
|
|
| lignin biosynthesis |
TAIR-GO |
10 |
0.000 |
1 |
0.001 |
|
|
|
|
|
|
|
|
|
|
|
| response to UV |
TAIR-GO |
10 |
0.000 |
1 |
0.001 |
|
|
|
|
|
|
|
|
|
|
|
| glucosinolate biosynthesis from homomethionine |
AraCyc |
10 |
0.000 |
1 |
0.000 |
|
|
|
|
|
|
|
|
|
|
|
| glucosinolate biosynthesis from phenylalanine |
AraCyc |
10 |
0.000 |
1 |
0.000 |
|
|
|
|
|
|
|
|
|
|
|
| lignin biosynthesis |
AraCyc |
10 |
0.000 |
1 |
0.015 |
|
|
|
|
|
|
|
|
|
|
|
| phenylpropanoid biosynthesis |
AraCyc |
10 |
0.000 |
1 |
0.000 |
|
|
|
|
|
|
|
|
|
|
|
| suberin biosynthesis |
AraCyc |
10 |
0.000 |
1 |
0.003 |
|
|
|
|
|
|
|
|
|
|
|
| Ascorbate and aldarate metabolism |
KEGG |
10 |
0.000 |
1 |
0.013 |
|
|
|
|
|
|
|
|
|
|
|
| Flavonoid biosynthesis |
KEGG |
10 |
0.000 |
1 |
0.005 |
|
|
|
|
|
|
|
|
|
|
|
| Fluorene degradation |
KEGG |
10 |
0.000 |
1 |
0.005 |
|
|
|
|
|
|
|
|
|
|
|
| Pyruvate metabolism |
KEGG |
10 |
0.001 |
1 |
0.088 |
|
|
|
|
|
|
|
|
|
|
|
| Stilbene, coumarine and lignin biosynthesis |
KEGG |
10 |
0.000 |
1 |
0.149 |
|
|
|
|
|
|
|
|
|
|
|
| Valine, leucine and isoleucine biosynthesis |
KEGG |
10 |
0.000 |
1 |
0.019 |
|
|
|
|
|
|
|
|
|
|
|
|
|
|
|
|
|
|
|
|
|
|
|
|
|
|
|
|