|
|
|
|
|
|
|
|
|
|
|
|
|
|
|
|
|
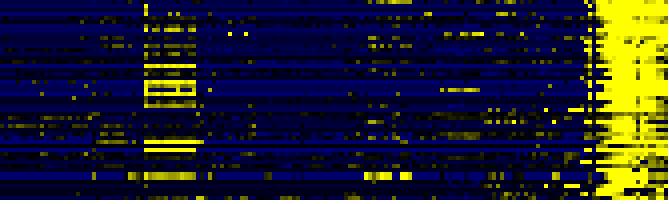
| Pathways co-expressed in the Organ and Tissue data set (with more than 10 annotation points) |
|
CYP714A1(At5g24910) |
|
|
|
|
|
|
|
|
| max. difference between log2-ratios: |
6.2 |
|
|
|
|
|
|
|
|
|
|
|
|
| max. difference between log2-ratios excluding lowest and highest 5%: |
4.1 |
|
|
|
|
|
|
|
|
|
|
|
|
| Pathway |
Source |
Scores of Genes |
p[Score] |
No. of Genes |
p[genes] |
Link to organ heatmap |
|
|
|
|
|
|
|
| Synthesis and storage of oil |
AcylLipid |
34 |
0.000 |
9 |
0.000 |
|
|
|
| Miscellaneous acyl lipid metabolism |
AcylLipid |
27 |
0.000 |
6 |
0.275 |
|
|
| glycolysis and gluconeogenesis |
FunCat |
22 |
0.000 |
4 |
0.023 |
|
|
| gibberellic acid biosynthesis |
TAIR-GO |
20 |
0.000 |
2 |
0.000 |
|
|
| plant / fungal specific systemic sensing and response |
FunCat |
20 |
0.000 |
2 |
0.002 |
|
|
| plant hormonal regulation |
FunCat |
20 |
0.000 |
2 |
0.002 |
|
|
| Diterpenoid biosynthesis |
KEGG |
20 |
0.000 |
2 |
0.000 |
|
|
| Pyruvate metabolism |
KEGG |
20 |
0.000 |
3 |
0.002 |
|
|
| Gibberellin metabolism |
LitPath |
20 |
0.000 |
2 |
0.007 |
|
|
| giberelin biosynthesis |
LitPath |
20 |
0.000 |
2 |
0.003 |
|
|
| acyl-CoA binding |
TAIR-GO |
19 |
0.000 |
2 |
0.000 |
|
|
| lipid transport |
TAIR-GO |
19 |
0.000 |
2 |
0.000 |
|
|
| abscisic acid biosynthesis |
TAIR-GO |
12 |
0.000 |
2 |
0.000 |
|
|
|
|
|
|
|
|
|
|
|
| abscisic acid biosynthesis |
AraCyc |
12 |
0.000 |
2 |
0.000 |
|
|
|
|
|
|
|
|
|
|
|
| abscisic acid biosynthesis |
LitPath |
12 |
0.000 |
2 |
0.001 |
|
|
|
|
|
|
|
|
|
|
|
| Carotenoid and abscisic acid metabolism |
LitPath |
12 |
0.000 |
2 |
0.013 |
|
|
|
|
|
|
|
|
|
|
|
|
|
|
|
|
|
|
|
|
|
|
|
|
|
|
|
|
|
|
|
|
|
|
|
|
|
|
|
|
|
|
|
|
|
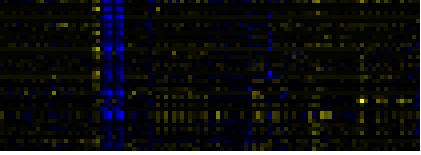
| Pathways co-expressed in the Hormone etc. data set (with more than 9 annotation points) |
|
CYP714A1(At5g24910) |
|
|
|
|
|
|
|
|
| max. difference between log2-ratios: |
3.6 |
|
|
|
|
|
|
|
|
|
|
|
|
| max. difference between log2-ratios excluding lowest and highest 5%: |
1.6 |
|
|
|
|
|
|
|
|
|
|
|
|
| Pathway |
Source |
Scores of Genes |
p[Score] |
No. of Genes |
p[genes] |
Link to hormones etc. heatmap |
|
|
|
|
|
|
|
| secondary metabolism |
FunCat |
20 |
0.000 |
2 |
0.031 |
|
|
|
|
|
|
| intracellular signalling |
FunCat |
17.5 |
0.000 |
4 |
0.000 |
|
|
|
|
|
| Biosynthesis of Amino Acids and Derivatives |
BioPath |
14 |
0.000 |
3 |
0.012 |
|
|
|
|
|
| Glutathione metabolism |
BioPath |
14 |
0.000 |
3 |
0.000 |
|
|
|
|
|
| toxin catabolism |
TAIR-GO |
14 |
0.000 |
3 |
0.002 |
|
|
|
|
|
| isoprenoid biosynthesis |
FunCat |
14 |
0.000 |
3 |
0.005 |
|
|
|
|
|
| lipid, fatty acid and isoprenoid biosynthesis |
FunCat |
14 |
0.000 |
3 |
0.003 |
|
|
|
|
|
| Cell Wall Carbohydrate Metabolism |
BioPath |
12 |
0.039 |
2 |
0.291 |
|
|
|
|
|
| Glutathione metabolism |
KEGG |
12 |
0.000 |
2 |
0.006 |
|
|
|
|
|
| Benzoate degradation via CoA ligation |
KEGG |
11.5 |
0.000 |
3 |
0.007 |
|
|
|
|
|
| gibberellic acid biosynthesis |
TAIR-GO |
10 |
0.000 |
1 |
0.009 |
|
|
|
|
|
|
|
|
|
|
|
| glucosinolate biosynthesis |
TAIR-GO |
10 |
0.000 |
1 |
0.004 |
|
|
|
|
|
|
|
|
|
|
|
| gibberellin biosynthesis |
AraCyc |
10 |
0.000 |
1 |
0.003 |
|
|
|
|
|
|
|
|
|
|
|
| glucosinolate biosynthesis from homomethionine |
AraCyc |
10 |
0.000 |
1 |
0.000 |
|
|
|
|
|
|
|
|
|
|
|
| biosynthesis of phenylpropanoids |
FunCat |
10 |
0.000 |
1 |
0.058 |
|
|
|
|
|
|
|
|
|
|
|
| biosynthesis of secondary products derived from L-phenylalanine and L-tyrosine |
FunCat |
10 |
0.000 |
1 |
0.058 |
|
|
|
|
|
|
|
|
|
|
|
| plant / fungal specific systemic sensing and response |
FunCat |
10 |
0.000 |
1 |
0.020 |
|
|
|
|
|
|
|
|
|
|
|
| plant hormonal regulation |
FunCat |
10 |
0.000 |
1 |
0.020 |
|
|
|
|
|
|
|
|
|
|
|
| transport |
FunCat |
10 |
0.000 |
2 |
0.000 |
|
|
|
|
|
|
|
|
|
|
|
| transport facilitation |
FunCat |
10 |
0.000 |
2 |
0.000 |
|
|
|
|
|
|
|
|
|
|
|
| Diterpenoid biosynthesis |
KEGG |
10 |
0.000 |
1 |
0.005 |
|
|
|
|
|
|
|
|
|
|
|
| Phosphatidylinositol signaling system |
KEGG |
10 |
0.000 |
2 |
0.003 |
|
|
|
|
|
|
|
|
|
|
|
| Signal Transduction |
KEGG |
10 |
0.000 |
2 |
0.003 |
|
|
|
|
|
|
|
|
|
|
|
| Gibberellin metabolism |
LitPath |
10 |
0.000 |
1 |
0.003 |
|
|
|
|
|
|
|
|
|
|
|
| giberelin biosynthesis |
LitPath |
10 |
0.000 |
1 |
0.002 |
|
|
|
|
|
|
|
|
|
|
|
| Glucosinolate Metabolism |
LitPath |
10 |
0.000 |
1 |
0.004 |
|
|
|
|
|
|
|
|
|
|
|
|
|
|
|
|
|
|
|
|
|
|
|
|
|
|
|
|