| _________________________________________ |
|
|
|
|
|
|
|
|
|
|
|
|
|
|
|
|
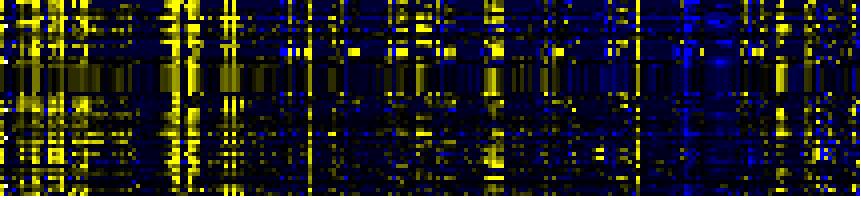
| Pathways co-expressed in the 3 data sets with co-expressed pathways (with more than 6 annotation points each) |
|
Find below a list of pathways that are co-expressed with the bait. First a list of pathways is given that are co-expressed in all data sets. Lists for each individual dataset are shown underneath. Depending on the number of co-expressed pathways only the top scoring pathways are given; all data can be saved as text using the link above. |

|
|
|
|
|
|
|
|
| Pathway |
Source |
Sum of scores |
Sum of genes |
|
|
|
|
|
|
|
|
| tryptophan biosynthesis |
TAIR-GO |
334 |
41 |
|
|
|
|
|
|
|
|
| tryptophan biosynthesis |
TAIR-GO |
334 |
41 |
|
|
|
|
|
|
|
|
| Phenylpropanoid Metabolism |
BioPath |
226 |
32 |
|
|
|
|
|
|
|
|
| Shikimate pathway |
LitPath |
192 |
24 |
|
To the right of each table a thumbnail of the actual co-expression heatmap is given. Klick on the link to see the heatmap containing all co-expressed genes. |
|
|
|
|
|
|
|
| Aromatic amino acid (Phe, Tyr, Trp) metabolism |
BioPath |
186 |
23 |
|
|
|
|
|
|
|
|
|
|
| Trp biosyntesis |
LitPath |
182 |
22 |
|
|
|
|
|
|
|
|
|
|
| Phenylalanine, tyrosine and tryptophan biosynthesis |
KEGG |
112 |
14 |
|
For more information on how these pathway maps were generated please read the methods page |
|
|
|
|
|
|
|
|
|
| Stilbene, coumarine and lignin biosynthesis |
KEGG |
43 |
13 |
|
|
|
|
|
|
|
|
|
|
| camalexin biosynthesis |
AraCyc |
42 |
6 |
|
|
|
|
|
|
|
|
|
|
|
|
|
| camalexin biosynthesis |
AraCyc |
42 |
6 |
|
|
|
|
|
|
|
|
|
|
|
|
|
| metabolism of the cysteine - aromatic group |
FunCat |
36 |
4 |
|
|
|
|
|
|
|
|
|
|
|
|
|
| indole phytoalexin biosynthesis |
TAIR-GO |
21 |
3 |
|
|
|
|
|
|
|
|
|
|
|
|
|
| Ascorbate and aldarate metabolism |
KEGG |
21 |
3 |
|
|
|
|
|
|
|
|
|
|
|
|
|
| Fluorene degradation |
KEGG |
21 |
3 |
|
|
|
|
|
|
|
|
|
|
|
|
|
| gamma-Hexachlorocyclohexane degradation |
KEGG |
21 |
3 |
|
|
|
|
|
|
|
|
|
|
|
|
|
|
|
|
|
|
|
|
|
|
|
|
|
|
|
|
|
|
|
|
|
|
|
|
|
|
|
|
|
|
|
|
|
|
|
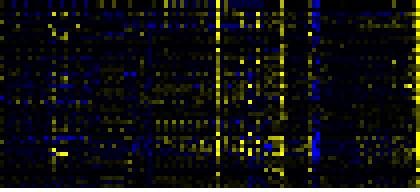
| Pathways co-expressed in the Stress data set ( with more than 6 annotation points) |
|
CYP71A12 (At2g30750) |
|
|
|
|
|
|
|
|
| max. difference between log2-ratios: |
11.6 |
|
|
|
|
|
|
|
|
|
|
|
|
| max. difference between log2-ratios excluding lowest and highest 5%: |
5.9 |
|
|
|
|
|
|
|
|
|
|
|
|
| Pathway |
Source |
Scores of Genes |
p[Score] |
No. of Genes |
p[genes] |
Link to stress heatmap |
|
|
|
|
|
|
|
| Phenylpropanoid Metabolism |
BioPath |
96 |
0.000 |
13 |
0.000 |
|
| Aromatic amino acid (Phe, Tyr, Trp) metabolism |
BioPath |
94 |
0.000 |
12 |
0.000 |
| Shikimate pathway |
LitPath |
94 |
0.000 |
12 |
0.000 |
| tryptophan biosynthesis |
TAIR-GO |
88 |
0.000 |
11 |
0.000 |
| Trp biosyntesis |
LitPath |
88 |
0.000 |
11 |
0.000 |
| tryptophan biosynthesis |
AraCyc |
78 |
0.000 |
10 |
0.000 |
| Phenylalanine, tyrosine and tryptophan biosynthesis |
KEGG |
58 |
0.000 |
7 |
0.000 |
| response to pathogenic bacteria |
TAIR-GO |
48 |
0.000 |
7 |
0.000 |
| amino acid metabolism |
FunCat |
26 |
0.000 |
3 |
0.016 |
| Stilbene, coumarine and lignin biosynthesis |
KEGG |
17 |
0.000 |
6 |
0.000 |
| metabolism of the cysteine - aromatic group |
FunCat |
16 |
0.000 |
2 |
0.000 |
| Methionin/SAM/ethylene metabolism from cysteine and aspartate |
BioPath |
10 |
0.000 |
1 |
0.058 |
| anthranilate synthase complex |
TAIR-GO |
10 |
0.000 |
1 |
0.000 |
|
|
|
|
|
|
|
|
|
|
|
| methionine biosynthesis |
TAIR-GO |
10 |
0.000 |
1 |
0.002 |
|
|
|
|
|
|
|
|
|
|
|
| response to wounding |
TAIR-GO |
10 |
0.000 |
1 |
0.057 |
|
|
|
|
|
|
|
|
|
|
|
| methionine biosynthesis II |
AraCyc |
10 |
0.000 |
1 |
0.006 |
|
|
|
|
|
|
|
|
|
|
|
| Methane metabolism |
KEGG |
10 |
0.000 |
5 |
0.001 |
|
|
|
|
|
|
|
|
|
|
|
| Methionine metabolism |
KEGG |
10 |
0.000 |
1 |
0.028 |
|
|
|
|
|
|
|
|
|
|
|
| Phenylalanine metabolism |
KEGG |
10 |
0.000 |
5 |
0.001 |
|
|
|
|
|
|
|
|
|
|
|
| Prostaglandin and leukotriene metabolism |
KEGG |
10 |
0.000 |
5 |
0.000 |
|
|
|
|
|
|
|
|
|
|
|
| glycolysis and gluconeogenesis |
FunCat |
8 |
0.037 |
2 |
0.101 |
|
|
|
|
|
|
|
|
|
|
|
| indole phytoalexin biosynthesis |
TAIR-GO |
7 |
0.000 |
1 |
0.000 |
|
|
|
|
|
|
|
|
|
|
|
| response to auxin stimulus |
TAIR-GO |
7 |
0.000 |
1 |
0.010 |
|
|
|
|
|
|
|
|
|
|
|
| camalexin biosynthesis |
AraCyc |
7 |
0.000 |
1 |
0.000 |
|
|
|
|
|
|
|
|
|
|
|
| plant / fungal specific systemic sensing and response |
FunCat |
7 |
0.000 |
1 |
0.014 |
|
|
|
|
|
|
|
|
|
|
|
| plant hormonal regulation |
FunCat |
7 |
0.000 |
1 |
0.014 |
|
|
|
|
|
|
|
|
|
|
|
| Ascorbate and aldarate metabolism |
KEGG |
7 |
0.000 |
1 |
0.042 |
|
|
|
|
|
|
|
|
|
|
|
| Fluorene degradation |
KEGG |
7 |
0.000 |
1 |
0.016 |
|
|
|
|
|
|
|
|
|
|
|
| gamma-Hexachlorocyclohexane degradation |
KEGG |
7 |
0.000 |
1 |
0.020 |
|
|
|
|
|
|
|
|
|
|
|
| camalexin biosynthesis |
LitPath |
7 |
0.000 |
1 |
0.000 |
|
|
|
|
|
|
|
|
|
|
|
|
|
|
|
|
|
|
|
|
|
|
|
|
|
|
|
|
|
|
|
|
|
|
|
|
|
|
|
|
|
|
|
|
|
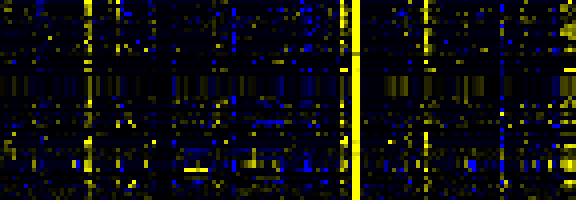
| Pathways co-expressed in the Hormone etc. data set (with more than 9 annotation points) |
|
CYP71A12 (At2g30750) |
|
|
|
|
|
|
|
|
| max. difference between log2-ratios: |
6.9 |
|
|
|
|
|
|
|
|
|
|
|
|
| max. difference between log2-ratios excluding lowest and highest 5%: |
2.0 |
|
|
|
|
|
|
|
|
|
|
|
|
| Pathway |
Source |
Scores of Genes |
p[Score] |
No. of Genes |
p[genes] |
Link to hormones etc. heatmap |
|
|
|
|
|
|
|
| Phenylpropanoid Metabolism |
BioPath |
33 |
0.000 |
5 |
0.011 |
|
|
|
|
|
|
| Gluconeogenesis from lipids in seeds |
BioPath |
29 |
0.000 |
4 |
0.001 |
|
|
|
|
|
| Degradation of storage lipids and straight fatty acids |
AcylLipid |
27 |
0.000 |
3 |
0.000 |
|
|
|
|
|
| lipid, fatty acid and isoprenoid degradation |
FunCat |
22 |
0.000 |
3 |
0.000 |
|
|
|
|
|
| Aromatic amino acid (Phe, Tyr, Trp) metabolism |
BioPath |
20 |
0.000 |
2 |
0.023 |
|
|
|
|
|
| tryptophan biosynthesis |
TAIR-GO |
20 |
0.000 |
2 |
0.001 |
|
|
|
|
|
| Fatty acid metabolism |
KEGG |
20 |
0.000 |
2 |
0.004 |
|
|
|
|
|
| Shikimate pathway |
LitPath |
20 |
0.000 |
2 |
0.017 |
|
|
|
|
|
| Trp biosyntesis |
LitPath |
20 |
0.000 |
2 |
0.001 |
|
|
|
|
|
| fatty acid beta oxidation complex |
BioPath |
19 |
0.000 |
3 |
0.000 |
|
|
|
|
|
| hypersensitive response |
TAIR-GO |
14 |
0.000 |
2 |
0.000 |
|
|
|
|
|
| amino acid metabolism |
FunCat |
14 |
0.000 |
2 |
0.058 |
|
|
|
|
|
| core phenylpropanoid metabolism |
BioPath |
12 |
0.000 |
2 |
0.013 |
|
|
|
|
|
|
|
|
|
|
|
| Phenylalanine, tyrosine and tryptophan biosynthesis |
KEGG |
12 |
0.000 |
2 |
0.009 |
|
|
|
|
|
|
|
|
|
|
|
| Phenylpropanoid pathway |
LitPath |
12 |
0.010 |
2 |
0.100 |
|
|
|
|
|
|
|
|
|
|
|
| Stilbene, coumarine and lignin biosynthesis |
KEGG |
11 |
0.000 |
3 |
0.016 |
|
|
|
|
|
|
|
|
|
|
|
| Regulatory enzymes |
BioPath |
10 |
0.000 |
1 |
0.000 |
|
|
|
|
|
|
|
|
|
|
|
| carotenoid biosynthesis |
TAIR-GO |
10 |
0.000 |
1 |
0.004 |
|
|
|
|
|
|
|
|
|
|
|
| fatty acid metabolism |
TAIR-GO |
10 |
0.000 |
1 |
0.036 |
|
|
|
|
|
|
|
|
|
|
|
| long-chain fatty acid metabolism |
TAIR-GO |
10 |
0.000 |
1 |
0.017 |
|
|
|
|
|
|
|
|
|
|
|
| plastid organization and biogenesis |
TAIR-GO |
10 |
0.000 |
1 |
0.001 |
|
|
|
|
|
|
|
|
|
|
|
| response to bacteria |
TAIR-GO |
10 |
0.000 |
1 |
0.000 |
|
|
|
|
|
|
|
|
|
|
|
| response to high light intensity |
TAIR-GO |
10 |
0.000 |
1 |
0.000 |
|
|
|
|
|
|
|
|
|
|
|
| response to temperature |
TAIR-GO |
10 |
0.000 |
1 |
0.000 |
|
|
|
|
|
|
|
|
|
|
|
| mixed acid fermentation |
AraCyc |
10 |
0.000 |
1 |
0.043 |
|
|
|
|
|
|
|
|
|
|
|
| sorbitol fermentation |
AraCyc |
10 |
0.001 |
1 |
0.130 |
|
|
|
|
|
|
|
|
|
|
|
| tryptophan biosynthesis |
AraCyc |
10 |
0.000 |
1 |
0.025 |
|
|
|
|
|
|
|
|
|
|
|
| biogenesis of cell wall |
FunCat |
10 |
0.000 |
1 |
0.105 |
|
|
|
|
|
|
|
|
|
|
|
| metabolism of the cysteine - aromatic group |
FunCat |
10 |
0.000 |
1 |
0.003 |
|
|
|
|
|
|
|
|
|
|
|
| Accessory protein/regulatory protein |
LitPath |
10 |
0.000 |
1 |
0.000 |
|
|
|
|
|
|
|
|
|
|
|
|
|
|
|
|
|
|
|
|
|
|
|
|
|
|
|
|
|
|
|
|
|
|
|
|
|
|
|
|
|
|
|
|
|
|
|
|
|
|
|
|
|
|
|
|
|
|
|
|
|
|
| Pathways co-expressed in the Mutant data set (with more than 10 annotation points) |
|
CYP71A12 (At2g30750) |
|
|
|
|
|
|
|
|
| max. difference between log2-ratios: |
11.0 |
|
|
|
|
|
|
|
|
|
|
|
|
| max. difference between log2-ratios excluding lowest and highest 5%: |
3.6 |
|
|
|
|
|
|
|
|
|
|
|
|
| Pathway |
Source |
Scores of Genes |
p[Score] |
No. of Genes |
p[genes] |
Link to mutants heatmap |
|
|
|
|
|
|
|
| Phenylpropanoid Metabolism |
BioPath |
97 |
0.000 |
14 |
0.000 |
|
|
|
|
| Shikimate pathway |
LitPath |
78 |
0.000 |
10 |
0.000 |
|
|
|
| tryptophan biosynthesis |
TAIR-GO |
74 |
0.000 |
9 |
0.000 |
|
|
|
| Trp biosyntesis |
LitPath |
74 |
0.000 |
9 |
0.000 |
|
|
|
| Aromatic amino acid (Phe, Tyr, Trp) metabolism |
BioPath |
72 |
0.000 |
9 |
0.000 |
|
|
|
| tryptophan biosynthesis |
AraCyc |
64 |
0.000 |
8 |
0.000 |
|
|
|
| response to pathogenic bacteria |
TAIR-GO |
44 |
0.000 |
6 |
0.000 |
|
|
|
| Phenylalanine, tyrosine and tryptophan biosynthesis |
KEGG |
42 |
0.000 |
5 |
0.000 |
|
|
|
| Phenylpropanoid pathway |
LitPath |
30 |
0.011 |
5 |
0.124 |
|
|
|
| lignin biosynthesis |
AraCyc |
28 |
0.000 |
4 |
0.000 |
|
|
|
| Methionin/SAM/ethylene metabolism from cysteine and aspartate |
BioPath |
26 |
0.000 |
3 |
0.002 |
|
|
|
| core phenylpropanoid metabolism |
BioPath |
22 |
0.000 |
3 |
0.010 |
|
|
|
| Propanoate metabolism |
KEGG |
16 |
0.000 |
2 |
0.023 |
|
|
|
|
|
|
|
|
|
|
|
| Benzoate degradation via CoA ligation |
KEGG |
15 |
0.001 |
4 |
0.035 |
|
|
|
|
|
|
|
|
|
|
|
| Inositol phosphate metabolism |
KEGG |
15 |
0.002 |
4 |
0.048 |
|
|
|
|
|
|
|
|
|
|
|
| Nicotinate and nicotinamide metabolism |
KEGG |
15 |
0.000 |
4 |
0.026 |
|
|
|
|
|
|
|
|
|
|
|
| Stilbene, coumarine and lignin biosynthesis |
KEGG |
15 |
0.001 |
4 |
0.052 |
|
|
|
|
|
|
|
|
|
|
|
| toxin catabolism |
TAIR-GO |
14 |
0.000 |
7 |
0.000 |
|
|
|
|
|
|
|
|
|
|
|
| C-compound and carbohydrate utilization |
FunCat |
12 |
0.000 |
3 |
0.000 |
|
|
|
|
|
|
|
|
|
|
|
| Alanine and aspartate metabolism |
KEGG |
12 |
0.000 |
2 |
0.025 |
|
|
|
|
|
|
|
|
|
|
|
| beta-Alanine metabolism |
KEGG |
12 |
0.000 |
2 |
0.007 |
|
|
|
|
|
|
|
|
|
|
|
| Butanoate metabolism |
KEGG |
12 |
0.000 |
2 |
0.014 |
|
|
|
|
|
|
|
|
|
|
|
| Glutamate metabolism |
KEGG |
12 |
0.002 |
2 |
0.057 |
|
|
|
|
|
|
|
|
|
|
|
| Taurine and hypotaurine metabolism |
KEGG |
12 |
0.000 |
2 |
0.000 |
|
|
|
|
|
|
|
|
|
|
|
| Miscellaneous acyl lipid metabolism |
AcylLipid |
12 |
0.004 |
4 |
0.197 |
|
|
|
|
|
|
|
|
|
|
|
| Nucleotide sugars metabolism |
KEGG |
11 |
0.000 |
3 |
0.001 |
|
|
|
|
|
|
|
|
|
|
|
|
|
|
|
|
|
|
|
|
|
|
|
|
|
|
|
|
