|
|
|
|
|
|
|
|
|
|
|
|
|
|
|
|
|
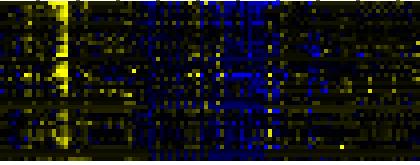
| Pathways co-expressed in the Organ and Tissue data set (with more than 6 annotation points) |
|
CYP71A19 (At4g13290) |
|
|
|
|
|
|
|
|
| max. difference between log2-ratios: |
6.4 |
|
|
|
|
|
|
|
|
|
|
|
|
| max. difference between log2-ratios excluding lowest and highest 5%: |
4.8 |
|
|
|
|
|
|
|
|
|
|
|
|
| Pathway |
Source |
Scores of Genes |
p[Score] |
No. of Genes |
p[genes] |
Link to organ heatmap |
|
|
|
|
|
|
|
| mono-/sesqui-/di-terpene biosynthesis |
LitPath |
29 |
0.000 |
3 |
0.015 |

|
|
|
| terpenoid metabolism |
LitPath |
29 |
0.000 |
3 |
0.016 |
|
|
| Stilbene, coumarine and lignin biosynthesis |
KEGG |
22 |
0.000 |
7 |
0.000 |
|
|
| monoterpenoid biosynthesis |
TAIR-GO |
19 |
0.000 |
2 |
0.000 |
|
|
| monoterpene biosynthesis |
LitPath |
19 |
0.000 |
2 |
0.000 |
|
|
| detoxification |
FunCat |
13 |
0.000 |
3 |
0.000 |
|
|
| Methane metabolism |
KEGG |
12 |
0.000 |
6 |
0.000 |
|
|
| Phenylalanine metabolism |
KEGG |
12 |
0.000 |
6 |
0.000 |
|
|
| Prostaglandin and leukotriene metabolism |
KEGG |
12 |
0.000 |
6 |
0.000 |
|
|
| detoxification involving cytochrome P450 |
FunCat |
11 |
0.000 |
2 |
0.000 |
|
|
| Flavonoid and anthocyanin metabolism |
BioPath |
10 |
0.000 |
3 |
0.000 |
|
|
| Phenylpropanoid Metabolism |
BioPath |
10 |
0.000 |
3 |
0.000 |
|
|
|
|
|
|
|
|
|
|
|
| fatty acid metabolism |
TAIR-GO |
10 |
0.000 |
1 |
0.003 |
|
|
|
|
|
|
|
|
|
|
|
| Ascorbate and aldarate metabolism |
KEGG |
10 |
0.000 |
1 |
0.016 |
|
|
|
|
|
|
|
|
|
|
|
| Fluorene degradation |
KEGG |
10 |
0.000 |
1 |
0.006 |
|
|
|
|
|
|
|
|
|
|
|
| gamma-Hexachlorocyclohexane degradation |
KEGG |
10 |
0.000 |
1 |
0.008 |
|
|
|
|
|
|
|
|
|
|
|
| Fatty acid elongation and wax and cutin metabolism |
AcylLipid |
10 |
0.000 |
1 |
0.187 |
|
|
|
|
|
|
|
|
|
|
|
| fatty acid modulation |
LitPath |
10 |
0.000 |
1 |
0.001 |
|
|
|
|
|
|
|
|
|
|
|
| sequiterpene biosynthesis |
LitPath |
10 |
0.000 |
1 |
0.001 |
|
|
|
|
|
|
|
|
|
|
|
| auxin biosynthesis |
TAIR-GO |
9 |
0.000 |
1 |
0.000 |
|
|
|
|
|
|
|
|
|
|
|
| IAA biosynthesis |
AraCyc |
9 |
0.000 |
1 |
0.001 |
|
|
|
|
|
|
|
|
|
|
|
| monoterpene biosynthesis |
AraCyc |
9 |
0.000 |
1 |
0.000 |
|
|
|
|
|
|
|
|
|
|
|
| plant monoterpene biosynthesis |
AraCyc |
9 |
0.000 |
1 |
0.000 |
|
|
|
|
|
|
|
|
|
|
|
| flavonol biosynthesis |
AraCyc |
8 |
0.000 |
2 |
0.000 |
|
|
|
|
|
|
|
|
|
|
|
| secondary metabolism |
FunCat |
8 |
0.000 |
4 |
0.000 |
|
|
|
|
|
|
|
|
|
|
|
| storage protein |
FunCat |
8 |
0.000 |
2 |
0.000 |
|
|
|
|
|
|
|
|
|
|
|
| flavonoid, anthocyanin, and proanthocyanidin biosynthesis |
LitPath |
8 |
0.002 |
2 |
0.004 |
|
|
|
|
|
|
|
|
|
|
|
| proanthocyanidin biosynthesis |
LitPath |
8 |
0.002 |
2 |
0.004 |
|
|
|
|
|
|
|
|
|
|
|
| pentacyclic triterpenoid biosynthesis |
TAIR-GO |
7 |
0.000 |
1 |
0.000 |
|
|
|
|
|
|
|
|
|
|
|
| isoprenoid biosynthesis |
FunCat |
7 |
0.000 |
1 |
0.057 |
|
|
|
|
|
|
|
|
|
|
|
| lipid, fatty acid and isoprenoid biosynthesis |
FunCat |
7 |
0.000 |
1 |
0.044 |
|
|
|
|
|
|
|
|
|
|
|
| Biosynthesis of steroids |
KEGG |
7 |
0.000 |
1 |
0.051 |
|
|
|
|
|
|
|
|
|
|
|
| triterpene biosynthesis |
LitPath |
7 |
0.001 |
1 |
0.039 |
|
|
|
|
|
|
|
|
|
|
|
|
|
|
|
|
|
|
|
|
|
|
|
|
|
|
|
|
|
|
|
|
|
|
|
|
|
|
|
|
|
|
|
|
|
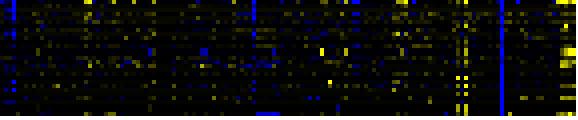
| Pathways co-expressed in the Stress data set ( with more than 6 annotation points) |
|
CYP71A19 (At4g13290) |
|
|
|
|
|
|
|
|
| max. difference between log2-ratios: |
7.2 |
|
|
|
|
|
|
|
|
|
|
|
|
| max. difference between log2-ratios excluding lowest and highest 5%: |
2.4 |
|
|
|
|
|
|
|
|
|
|
|
|
| Pathway |
Source |
Scores of Genes |
p[Score] |
No. of Genes |
p[genes] |
Link to stress heatmap |
|
|
|
|
|
|
|
| mono-/sesqui-/di-terpene biosynthesis |
LitPath |
29 |
0.000 |
3 |
0.015 |

|
| terpenoid metabolism |
LitPath |
29 |
0.000 |
3 |
0.016 |
|
|
|
|
|
|
|
|
|
|
|
| Stilbene, coumarine and lignin biosynthesis |
KEGG |
22 |
0.000 |
7 |
0.000 |
|
|
|
|
|
|
|
|
|
|
|
| monoterpenoid biosynthesis |
TAIR-GO |
19 |
0.000 |
2 |
0.000 |
|
|
|
|
|
|
|
|
|
|
|
| monoterpene biosynthesis |
LitPath |
19 |
0.000 |
2 |
0.000 |
|
|
|
|
|
|
|
|
|
|
|
| detoxification |
FunCat |
13 |
0.000 |
3 |
0.000 |
|
|
|
|
|
|
|
|
|
|
|
| Methane metabolism |
KEGG |
12 |
0.000 |
6 |
0.000 |
|
|
|
|
|
|
|
|
|
|
|
| Phenylalanine metabolism |
KEGG |
12 |
0.000 |
6 |
0.000 |
|
|
|
|
|
|
|
|
|
|
|
| Prostaglandin and leukotriene metabolism |
KEGG |
12 |
0.000 |
6 |
0.000 |
|
|
|
|
|
|
|
|
|
|
|
| detoxification involving cytochrome P450 |
FunCat |
11 |
0.000 |
2 |
0.000 |
|
|
|
|
|
|
|
|
|
|
|
| Flavonoid and anthocyanin metabolism |
BioPath |
10 |
0.000 |
3 |
0.000 |
|
|
|
|
|
|
|
|
|
|
|
| Phenylpropanoid Metabolism |
BioPath |
10 |
0.000 |
3 |
0.000 |
|
|
|
|
|
|
|
|
|
|
|
| fatty acid metabolism |
TAIR-GO |
10 |
0.000 |
1 |
0.003 |
|
|
|
|
|
|
|
|
|
|
|
| Ascorbate and aldarate metabolism |
KEGG |
10 |
0.000 |
1 |
0.016 |
|
|
|
|
|
|
|
|
|
|
|
| Fluorene degradation |
KEGG |
10 |
0.000 |
1 |
0.006 |
|
|
|
|
|
|
|
|
|
|
|
| gamma-Hexachlorocyclohexane degradation |
KEGG |
10 |
0.000 |
1 |
0.008 |
|
|
|
|
|
|
|
|
|
|
|
| Fatty acid elongation and wax and cutin metabolism |
AcylLipid |
10 |
0.000 |
1 |
0.187 |
|
|
|
|
|
|
|
|
|
|
|
| fatty acid modulation |
LitPath |
10 |
0.000 |
1 |
0.001 |
|
|
|
|
|
|
|
|
|
|
|
| sequiterpene biosynthesis |
LitPath |
10 |
0.000 |
1 |
0.001 |
|
|
|
|
|
|
|
|
|
|
|
| auxin biosynthesis |
TAIR-GO |
9 |
0.000 |
1 |
0.000 |
|
|
|
|
|
|
|
|
|
|
|
| IAA biosynthesis |
AraCyc |
9 |
0.000 |
1 |
0.001 |
|
|
|
|
|
|
|
|
|
|
|
| monoterpene biosynthesis |
AraCyc |
9 |
0.000 |
1 |
0.000 |
|
|
|
|
|
|
|
|
|
|
|
| plant monoterpene biosynthesis |
AraCyc |
9 |
0.000 |
1 |
0.000 |
|
|
|
|
|
|
|
|
|
|
|
| flavonol biosynthesis |
AraCyc |
8 |
0.000 |
2 |
0.000 |
|
|
|
|
|
|
|
|
|
|
|
| secondary metabolism |
FunCat |
8 |
0.000 |
4 |
0.000 |
|
|
|
|
|
|
|
|
|
|
|
| storage protein |
FunCat |
8 |
0.000 |
2 |
0.000 |
|
|
|
|
|
|
|
|
|
|
|
| flavonoid, anthocyanin, and proanthocyanidin biosynthesis |
LitPath |
8 |
0.002 |
2 |
0.004 |
|
|
|
|
|
|
|
|
|
|
|
| proanthocyanidin biosynthesis |
LitPath |
8 |
0.002 |
2 |
0.004 |
|
|
|
|
|
|
|
|
|
|
|
| pentacyclic triterpenoid biosynthesis |
TAIR-GO |
7 |
0.000 |
1 |
0.000 |
|
|
|
|
|
|
|
|
|
|
|
| isoprenoid biosynthesis |
FunCat |
7 |
0.000 |
1 |
0.057 |
|
|
|
|
|
|
|
|
|
|
|
| lipid, fatty acid and isoprenoid biosynthesis |
FunCat |
7 |
0.000 |
1 |
0.044 |
|
|
|
|
|
|
|
|
|
|
|
| Biosynthesis of steroids |
KEGG |
7 |
0.000 |
1 |
0.051 |
|
|
|
|
|
|
|
|
|
|
|
| triterpene biosynthesis |
LitPath |
7 |
0.001 |
1 |
0.039 |
|
|
|
|
|
|
|
|
|
|
|
|
|
|
|
|
|
|
|
|
|
|
|
|
|
|
|
|
|
|
|
|
|
|
|
|
|
|
|
|
|
|
|
|
|
| Pathways co-expressed in the Hormone etc. data set (with more than 7 annotation points) |
|
CYP71A19 (At4g13290) |
|
|
|
|
|
|
|
|
| max. difference between log2-ratios: |
9.2 |
|
|
|
|
|
|
|
|
|
|
|
|
| max. difference between log2-ratios excluding lowest and highest 5%: |
4.6 |
|
|
|
|
|
|
|
|
|
|
|
|
| Pathway |
Source |
Scores of Genes |
p[Score] |
No. of Genes |
p[genes] |
Link to hormones etc. heatmap |
|
|
|
|
|
|
|
| Phenylpropanoid Metabolism |
BioPath |
28 |
0.000 |
4 |
0.009 |
|
|
|
|
|
|
| Lipid signaling |
AcylLipid |
18 |
0.000 |
3 |
0.015 |
|
|
|
|
|
| Biosynthesis of Amino Acids and Derivatives |
BioPath |
16 |
0.017 |
2 |
0.140 |
|
|
|
|
|
| Glutathione metabolism |
BioPath |
16 |
0.000 |
2 |
0.016 |
|
|
|
|
|
| cysteine biosynthesis I |
AraCyc |
16 |
0.000 |
2 |
0.002 |
|
|
|
|
|
| sulfate assimilation III |
AraCyc |
16 |
0.000 |
2 |
0.001 |
|
|
|
|
|
| amino acid metabolism |
FunCat |
16 |
0.000 |
2 |
0.048 |
|
|
|
|
|
| Cysteine metabolism |
KEGG |
16 |
0.000 |
2 |
0.000 |
|
|
|
|
|
| Sulfur metabolism |
KEGG |
16 |
0.000 |
2 |
0.000 |
|
|
|
|
|
| Phenylpropanoid pathway |
LitPath |
16 |
0.004 |
4 |
0.016 |
|
|
|
|
|
| anthocyanin biosynthesis |
AraCyc |
14 |
0.000 |
2 |
0.000 |
|
|
|
|
|
|
|
|
|
|
|
| Flavonoid biosynthesis |
KEGG |
14 |
0.000 |
2 |
0.000 |
|
|
|
|
|
|
|
|
|
|
|
| core phenylpropanoid metabolism |
BioPath |
12 |
0.000 |
2 |
0.005 |
|
|
|
|
|
|
|
|
|
|
|
| lignin biosynthesis |
AraCyc |
12 |
0.000 |
2 |
0.002 |
|
|
|
|
|
|
|
|
|
|
|
| Stilbene, coumarine and lignin biosynthesis |
KEGG |
12 |
0.000 |
2 |
0.013 |
|
|
|
|
|
|
|
|
|
|
|
| Chlorophyll biosynthesis and breakdown |
BioPath |
10 |
0.000 |
1 |
0.027 |
|
|
|
|
|
|
|
|
|
|
|
| Flavonoid and anthocyanin metabolism |
BioPath |
10 |
0.000 |
1 |
0.069 |
|
|
|
|
|
|
|
|
|
|
|
| Isoprenoid Biosynthesis in the Cytosol and in Mitochondria |
BioPath |
10 |
0.005 |
2 |
0.013 |
|
|
|
|
|
|
|
|
|
|
|
| Plastidial Isoprenoids (Chlorophylls, Carotenoids, Tocopherols, Plastoquinone, Phylloquinone) |
BioPath |
10 |
0.046 |
1 |
0.139 |
|
|
|
|
|
|
|
|
|
|
|
| sterol biosynthesis |
BioPath |
10 |
0.000 |
2 |
0.001 |
|
|
|
|
|
|
|
|
|
|
|
| anthocyanin biosynthesis |
TAIR-GO |
10 |
0.000 |
1 |
0.000 |
|
|
|
|
|
|
|
|
|
|
|
| chlorophyll catabolism |
TAIR-GO |
10 |
0.000 |
1 |
0.000 |
|
|
|
|
|
|
|
|
|
|
|
| cysteine biosynthesis |
TAIR-GO |
10 |
0.000 |
1 |
0.000 |
|
|
|
|
|
|
|
|
|
|
|
| lignin biosynthesis |
TAIR-GO |
10 |
0.000 |
1 |
0.001 |
|
|
|
|
|
|
|
|
|
|
|
| phenylpropanoid biosynthesis |
TAIR-GO |
10 |
0.000 |
1 |
0.000 |
|
|
|
|
|
|
|
|
|
|
|
| response to stress |
TAIR-GO |
10 |
0.000 |
1 |
0.000 |
|
|
|
|
|
|
|
|
|
|
|
| tryptophan catabolism |
TAIR-GO |
10 |
0.000 |
1 |
0.000 |
|
|
|
|
|
|
|
|
|
|
|
| glucosinolate biosynthesis from tryptophan |
AraCyc |
10 |
0.000 |
1 |
0.000 |
|
|
|
|
|
|
|
|
|
|
|
| IAA biosynthesis |
AraCyc |
10 |
0.000 |
1 |
0.002 |
|
|
|
|
|
|
|
|
|
|
|
| IAA biosynthesis I |
AraCyc |
10 |
0.000 |
1 |
0.001 |
|
|
|
|
|
|
|
|
|
|
|
| lipoxygenase pathway |
AraCyc |
10 |
0.000 |
1 |
0.002 |
|
|
|
|
|
|
|
|
|
|
|
| biogenesis of cell wall |
FunCat |
10 |
0.000 |
1 |
0.092 |
|
|
|
|
|
|
|
|
|
|
|
| biosynthesis of phenylpropanoids |
FunCat |
10 |
0.000 |
1 |
0.030 |
|
|
|
|
|
|
|
|
|
|
|
| biosynthesis of secondary products derived from L-phenylalanine and L-tyrosine |
FunCat |
10 |
0.000 |
1 |
0.030 |
|
|
|
|
|
|
|
|
|
|
|
| lipid, fatty acid and isoprenoid metabolism |
FunCat |
10 |
0.000 |
1 |
0.042 |
|
|
|
|
|
|
|
|
|
|
|
| Ascorbate and aldarate metabolism |
KEGG |
10 |
0.000 |
1 |
0.007 |
|
|
|
|
|
|
|
|
|
|
|
| Fluorene degradation |
KEGG |
10 |
0.000 |
1 |
0.003 |
|
|
|
|
|
|
|
|
|
|
|
| gamma-Hexachlorocyclohexane degradation |
KEGG |
10 |
0.000 |
1 |
0.003 |
|
|
|
|
|
|
|
|
|
|
|
| Selenoamino acid metabolism |
KEGG |
10 |
0.000 |
1 |
0.010 |
|
|
|
|
|
|
|
|
|
|
|
| anthocyanin biosynthesis |
LitPath |
10 |
0.000 |
1 |
0.000 |
|
|
|
|
|
|
|
|
|
|
|
| chlorophyll and phytochromobilin metabolism |
LitPath |
10 |
0.033 |
1 |
0.145 |
|
|
|
|
|
|
|
|
|
|
|
| chlorophyll catabolism |
LitPath |
10 |
0.000 |
1 |
0.001 |
|
|
|
|
|
|
|
|
|
|
|
| flavonoid, anthocyanin, and proanthocyanidin biosynthesis |
LitPath |
10 |
0.000 |
1 |
0.020 |
|
|
|
|
|
|
|
|
|
|
|
| Glucosinolate Metabolism |
LitPath |
10 |
0.002 |
1 |
0.055 |
|
|
|
|
|
|
|
|
|
|
|
| oxylipin pathway |
LitPath |
10 |
0.000 |
1 |
0.000 |
|
|
|
|
|
|
|
|
|
|
|
| proanthocyanidin biosynthesis |
LitPath |
10 |
0.000 |
1 |
0.020 |
|
|
|
|
|
|
|
|
|
|
|
| Leaf Glycerolipid Biosynthesis in cytosol / ER |
BioPath |
9 |
0.000 |
1 |
0.023 |
|
|
|
|
|
|
|
|
|
|
|
| Synthesis of membrane lipids in endomembrane system |
AcylLipid |
9 |
0.001 |
1 |
0.077 |
|
|
|
|
|
|
|
|
|
|
|
| storage protein |
FunCat |
8 |
0.000 |
2 |
0.000 |
|
|
|
|
|
|
|
|
|
|
|
|
|
|
|
|
|
|
|
|
|
|
|
|
|
|
|
|
|
|
|
|
|
|
|
|
|
|
|
|
|
|
|
|
|
|
|
|
|
|
|
|
|
|
|
|
|
|
|
|
|
|
| Pathways co-expressed in the Mutant data set (with more than 10 annotation points) |
|
CYP71A19 (At4g13290) |
|
|
|
|
|
|
|
|
| max. difference between log2-ratios: |
13.6 |
|
|
|
|
|
|
|
|
|
|
|
|
| max. difference between log2-ratios excluding lowest and highest 5%: |
4.1 |
|
|
|
|
|
|
|
|
|
|
|
|
| Pathway |
Source |
Scores of Genes |
p[Score] |
No. of Genes |
p[genes] |
Link to mutants heatmap |
|
|
|
|
|
|
|
| Biosynthesis of steroids |
KEGG |
19 |
0.000 |
4 |
0.000 |
|
|
|
|
| secondary metabolism |
FunCat |
15 |
0.000 |
4 |
0.000 |
|
|
|
| Phenylpropanoid Metabolism |
BioPath |
13 |
0.005 |
3 |
0.057 |
|
|
|
| lignin biosynthesis |
AraCyc |
12 |
0.000 |
2 |
0.001 |
|
|
|
| Phenylpropanoid pathway |
LitPath |
12 |
0.002 |
2 |
0.185 |
|
|
|
| triterpene, sterol, and brassinosteroid metabolism |
LitPath |
11 |
0.006 |
2 |
0.128 |
|
|
|
| cellulose biosynthesis |
BioPath |
10 |
0.000 |
1 |
0.057 |
|
|
|
| core phenylpropanoid metabolism |
BioPath |
10 |
0.000 |
1 |
0.057 |
|
|
|
| hemicellulose biosynthesis |
BioPath |
10 |
0.000 |
1 |
0.008 |
|
|
|
|
|
|
|
|
|
|
|
| lignin biosynthesis |
TAIR-GO |
10 |
0.000 |
1 |
0.000 |
|
|
|
|
|
|
|
|
|
|
|
| Biosynthesis of prenyl diphosphates |
BioPath |
8 |
0.000 |
2 |
0.006 |
|
|
|
|
|
|
|
|
|
|
|
| Leaf Glycerolipid Biosynthesis in Plastid |
BioPath |
8 |
0.001 |
2 |
0.012 |
|
|
|
|
|
|
|
|
|
|
|
| Plastidial Isoprenoids (Chlorophylls, Carotenoids, Tocopherols, Plastoquinone, Phylloquinone) |
BioPath |
8 |
0.030 |
2 |
0.033 |
|
|
|
|
|
|
|
|
|
|
|
| Terpenoid biosynthesis |
KEGG |
8 |
0.000 |
2 |
0.000 |
|
|
|
|
|
|
|
|
|
|
|
| Synthesis of fatty acids in plastids |
AcylLipid |
8 |
0.000 |
2 |
0.000 |
|
|
|
|
|
|
|
|
|
|
|
| prenyl diphosphate (GPP,FPP, GGPP) biosynthesis |
LitPath |
8 |
0.000 |
2 |
0.002 |
|
|
|
|
|
|
|
|
|
|
|
| pentacyclic triterpenoid biosynthesis |
TAIR-GO |
7 |
0.000 |
1 |
0.000 |
|
|
|
|
|
|
|
|
|
|
|
| triterpene biosynthesis |
LitPath |
7 |
0.000 |
1 |
0.014 |
|
|
|
|
|
|
|
|
|
|
|
|
|
|
|
|
|
|
|
|
|
|
|
|
|
|
|
|