| _________________________________________ |
|
|
|
|
|
|
|
|
|
|
|
|
|
|
|
|
| Pathways co-expressed in the three applicable data sets (with more than 6 annotation points each) |
|
Find below a list of pathways that are co-expressed with the bait. First a list of pathways is given that are co-expressed in all data sets. Lists for each individual dataset are shown underneath. Depending on the number of co-expressed pathways only the top scoring pathways are given; all data can be saved as text using the link above. |

|
|
|
|
|
|
|
|
| Pathway |
Source |
Sum of scores |
Sum of genes |
|
|
|
|
|
|
|
|
| Synthesis and storage of oil |
AcylLipid |
74 |
20 |
|
|
|
|
|
|
|
|
| secondary metabolism |
FunCat |
51 |
7 |
|
|
|
|
|
|
|
|
| secondary metabolism |
FunCat |
51 |
7 |
|
|
|
|
|
|
|
|
| gibberellic acid biosynthesis |
TAIR-GO |
50 |
5 |
|
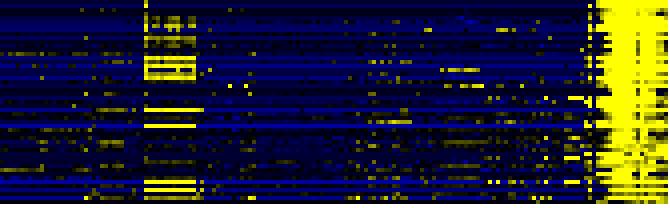
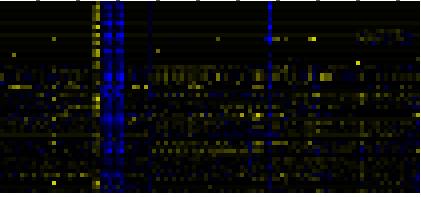
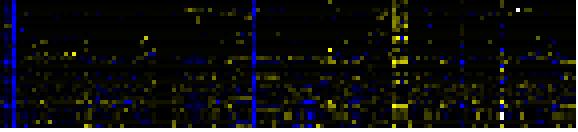
To the right of each table a thumbnail of the actual co-expression heatmap is given. Klick on the link to see the heatmap containing all co-expressed genes. |
|
|
|
|
|
|
|
|
|
| Diterpenoid biosynthesis |
KEGG |
50 |
5 |
|
|
|
|
|
|
|
|
|
|
| Gibberellin metabolism |
LitPath |
50 |
5 |
|
|
|
|
|
|
|
|
|
|
| giberelin biosynthesis |
LitPath |
50 |
5 |
|
For more information on how these pathway maps were generated please read the methods page |
|
|
|
|
|
|
|
|
|
| gibberellin biosynthesis |
AraCyc |
42 |
5 |
|
|
|
|
|
|
|
|
|
|
| plant / fungal specific systemic sensing and response |
FunCat |
40 |
4 |
|
|
|
|
|
|
|
|
|
|
|
|
|
| plant hormonal regulation |
FunCat |
40 |
4 |
|
|
|
|
|
|
|
|
|
|
|
|
|
| Carbon fixation |
KEGG |
28 |
6 |
|
|
|
|
|
|
|
|
|
|
|
|
|
| transport |
FunCat |
25 |
6 |
|
|
|
|
|
|
|
|
|
|
|
|
|
|
|
|
|
|
|
|
|
|
|
|
|
|
|
|
|
|
|
|
|
|
|
|
|
|
|
|
|
|
|
|
|
|
|
| Pathways co-expressed in the Organ and Tissue data set (with more than 10 annotation points) |
|
CYP71B10 (At5g57260) |
|
|
|
|
|
|
|
|
| max. difference between log2-ratios: |
7.6 |
|
|
|
|
|
|
|
|
|
|
|
|
| max. difference between log2-ratios excluding lowest and highest 5%: |
5.1 |
|
|
|
|
|
|
|
|
|
|
|
|
| Pathway |
Source |
Scores of Genes |
p[Score] |
No. of Genes |
p[genes] |
Link to organ heatmap |
|
|
|
|
|
|
|
| Synthesis and storage of oil |
AcylLipid |
38 |
0.000 |
10 |
0.000 |
|
|
|
| TCA cycle variation VII |
AraCyc |
28 |
0.000 |
5 |
0.012 |
|
|
| glycolysis and gluconeogenesis |
FunCat |
28 |
0.000 |
6 |
0.012 |
|
|
| glyoxylate cycle |
AraCyc |
26 |
0.000 |
4 |
0.000 |
|
|
| TCA cycle variation VIII |
AraCyc |
26 |
0.000 |
4 |
0.011 |
|
|
| Glyoxylate and dicarboxylate metabolism |
KEGG |
26 |
0.000 |
4 |
0.000 |
|
|
| Pyruvate metabolism |
KEGG |
26 |
0.000 |
4 |
0.009 |
|
|
| Biosynthesis of Amino Acids and Derivatives |
BioPath |
24 |
0.000 |
3 |
0.211 |
|
|
| Phenylpropanoid pathway |
LitPath |
24 |
0.000 |
6 |
0.004 |
|
|
| Intermediary Carbon Metabolism |
BioPath |
22 |
0.000 |
4 |
0.070 |
|
|
| gibberellic acid biosynthesis |
TAIR-GO |
20 |
0.000 |
2 |
0.000 |
|
|
| amino acid metabolism |
FunCat |
20 |
0.024 |
2 |
0.383 |
|
|
| plant / fungal specific systemic sensing and response |
FunCat |
20 |
0.000 |
2 |
0.007 |
|
|
| plant hormonal regulation |
FunCat |
20 |
0.000 |
2 |
0.007 |
|
|
|
|
|
|
|
|
|
|
|
| Diterpenoid biosynthesis |
KEGG |
20 |
0.000 |
2 |
0.001 |
|
|
|
|
|
|
|
|
|
|
|
| Gibberellin metabolism |
LitPath |
20 |
0.000 |
2 |
0.010 |
|
|
|
|
|
|
|
|
|
|
|
| giberelin biosynthesis |
LitPath |
20 |
0.000 |
2 |
0.004 |
|
|
|
|
|
|
|
|
|
|
|
| acyl-CoA binding |
TAIR-GO |
19 |
0.000 |
2 |
0.000 |
|
|
|
|
|
|
|
|
|
|
|
| lipid transport |
TAIR-GO |
19 |
0.000 |
2 |
0.000 |
|
|
|
|
|
|
|
|
|
|
|
| serine-isocitrate lyase pathway |
AraCyc |
18 |
0.000 |
4 |
0.008 |
|
|
|
|
|
|
|
|
|
|
|
| Gluconeogenesis from lipids in seeds |
BioPath |
17 |
0.000 |
3 |
0.015 |
|
|
|
|
|
|
|
|
|
|
|
| core phenylpropanoid metabolism |
BioPath |
14 |
0.000 |
2 |
0.025 |
|
|
|
|
|
|
|
|
|
|
|
| TCA cycle -- aerobic respiration |
AraCyc |
14 |
0.000 |
3 |
0.040 |
|
|
|
|
|
|
|
|
|
|
|
| Citrate cycle (TCA cycle) |
KEGG |
14 |
0.000 |
3 |
0.006 |
|
|
|
|
|
|
|
|
|
|
|
| acetyl-CoA assimilation |
AraCyc |
12 |
0.000 |
2 |
0.058 |
|
|
|
|
|
|
|
|
|
|
|
| lignin biosynthesis |
AraCyc |
12 |
0.009 |
2 |
0.122 |
|
|
|
|
|
|
|
|
|
|
|
| TCA cycle variation IV |
AraCyc |
12 |
0.003 |
2 |
0.128 |
|
|
|
|
|
|
|
|
|
|
|
| secondary metabolism |
FunCat |
12 |
0.002 |
2 |
0.137 |
|
|
|
|
|
|
|
|
|
|
|
| Branched-chain amino acids from aspartate |
BioPath |
10 |
0.000 |
1 |
0.049 |
|
|
|
|
|
|
|
|
|
|
|
| Glutamate/glutamine from nitrogen fixation |
BioPath |
10 |
0.000 |
1 |
0.014 |
|
|
|
|
|
|
|
|
|
|
|
| gibberellic acid mediated signaling |
TAIR-GO |
10 |
0.000 |
1 |
0.001 |
|
|
|
|
|
|
|
|
|
|
|
| lignin biosynthesis |
TAIR-GO |
10 |
0.000 |
1 |
0.003 |
|
|
|
|
|
|
|
|
|
|
|
| microsome |
TAIR-GO |
10 |
0.000 |
1 |
0.000 |
|
|
|
|
|
|
|
|
|
|
|
| oxygen binding |
TAIR-GO |
10 |
0.000 |
1 |
0.000 |
|
|
|
|
|
|
|
|
|
|
|
| ammonia assimilation cycle |
AraCyc |
10 |
0.000 |
1 |
0.024 |
|
|
|
|
|
|
|
|
|
|
|
| gibberellin biosynthesis |
AraCyc |
10 |
0.000 |
1 |
0.042 |
|
|
|
|
|
|
|
|
|
|
|
| glutamine biosynthesis I |
AraCyc |
10 |
0.000 |
1 |
0.015 |
|
|
|
|
|
|
|
|
|
|
|
| mixed acid fermentation |
AraCyc |
10 |
0.003 |
2 |
0.072 |
|
|
|
|
|
|
|
|
|
|
|
| nitrate assimilation pathway |
AraCyc |
10 |
0.000 |
1 |
0.030 |
|
|
|
|
|
|
|
|
|
|
|
| sucrose biosynthesis |
AraCyc |
10 |
0.000 |
2 |
0.017 |
|
|
|
|
|
|
|
|
|
|
|
| threonine biosynthesis from homoserine |
AraCyc |
10 |
0.000 |
1 |
0.007 |
|
|
|
|
|
|
|
|
|
|
|
| assimilation of ammonia, metabolism of the glutamate group |
FunCat |
10 |
0.000 |
1 |
0.074 |
|
|
|
|
|
|
|
|
|
|
|
| biosynthesis of derivatives of homoisopentenyl pyrophosphate |
FunCat |
10 |
0.000 |
1 |
0.040 |
|
|
|
|
|
|
|
|
|
|
|
| glyoxylate cycle |
FunCat |
10 |
0.000 |
1 |
0.001 |
|
|
|
|
|
|
|
|
|
|
|
| lipid, fatty acid and isoprenoid biosynthesis |
FunCat |
10 |
0.038 |
3 |
0.026 |
|
|
|
|
|
|
|
|
|
|
|
| lipid, fatty acid and isoprenoid metabolism |
FunCat |
10 |
0.010 |
2 |
0.057 |
|
|
|
|
|
|
|
|
|
|
|
| nitrogen and sulfur metabolism |
FunCat |
10 |
0.000 |
1 |
0.067 |
|
|
|
|
|
|
|
|
|
|
|
| Carbon fixation |
KEGG |
10 |
0.032 |
2 |
0.111 |
|
|
|
|
|
|
|
|
|
|
|
| Glutamate metabolism |
KEGG |
10 |
0.007 |
1 |
0.180 |
|
|
|
|
|
|
|
|
|
|
|
| Glycan Biosynthesis and Metabolism |
KEGG |
10 |
0.011 |
1 |
0.314 |
|
|
|
|
|
|
|
|
|
|
|
| Glycine, serine and threonine metabolism |
KEGG |
10 |
0.000 |
1 |
0.136 |
|
|
|
|
|
|
|
|
|
|
|
|
|
|
|
|
|
|
|
|
|
|
|
|
|
|
|
|
|
|
|
|
|
|
|
|
|
|
|
|
|
|
|
|
|
| Pathways co-expressed in the Hormone etc. data set (with more than 6 annotation points) |
|
CYP71B10 (At5g57260) |
|
|
|
|
|
|
|
|
| max. difference between log2-ratios: |
2.3 |
|
|
|
|
|
|
|
|
|
|
|
|
| max. difference between log2-ratios excluding lowest and highest 5%: |
0.6 |
|
|
|
|
|
|
|
|
|
|
|
|
| Pathway |
Source |
Scores of Genes |
p[Score] |
No. of Genes |
p[genes] |
Link to hormones etc. heatmap |
|
|
|
|
|
|
|
| Synthesis and storage of oil |
AcylLipid |
24 |
0.000 |
6 |
0.000 |
|
|
|
|
|
|
| gibberellin biosynthesis |
AraCyc |
22 |
0.000 |
3 |
0.000 |
|
|
|
|
|
| secondary metabolism |
FunCat |
22 |
0.000 |
3 |
0.003 |
|
|
|
|
|
| gibberellic acid biosynthesis |
TAIR-GO |
20 |
0.000 |
2 |
0.000 |
|
|
|
|
|
| Diterpenoid biosynthesis |
KEGG |
20 |
0.000 |
2 |
0.000 |
|
|
|
|
|
| Gibberellin metabolism |
LitPath |
20 |
0.000 |
2 |
0.001 |
|
|
|
|
|
| giberelin biosynthesis |
LitPath |
20 |
0.000 |
2 |
0.000 |
|
|
|
|
|
| Biosynthesis of Amino Acids and Derivatives |
BioPath |
14 |
0.000 |
3 |
0.007 |
|
|
|
|
|
| Glutathione metabolism |
BioPath |
14 |
0.000 |
3 |
0.000 |
|
|
|
|
|
| Cell Wall Carbohydrate Metabolism |
BioPath |
12 |
0.009 |
2 |
0.219 |
|
|
|
|
|
| toxin catabolism |
TAIR-GO |
12 |
0.000 |
2 |
0.007 |
|
|
|
|
|
| phenylalanine degradation I |
AraCyc |
12 |
0.000 |
3 |
0.000 |
|
|
|
|
|
| tyrosine degradation |
AraCyc |
12 |
0.000 |
3 |
0.000 |
|
|
|
|
|
|
|
|
|
|
|
| Glutathione metabolism |
KEGG |
12 |
0.000 |
2 |
0.007 |
|
|
|
|
|
|
|
|
|
|
|
| Glycine, serine and threonine metabolism |
KEGG |
11 |
0.000 |
2 |
0.004 |
|
|
|
|
|
|
|
|
|
|
|
| glucosinolate biosynthesis |
TAIR-GO |
10 |
0.000 |
1 |
0.002 |
|
|
|
|
|
|
|
|
|
|
|
| glucosinolate biosynthesis from homomethionine |
AraCyc |
10 |
0.000 |
1 |
0.001 |
|
|
|
|
|
|
|
|
|
|
|
| biosynthesis of phenylpropanoids |
FunCat |
10 |
0.000 |
1 |
0.049 |
|
|
|
|
|
|
|
|
|
|
|
| biosynthesis of secondary products derived from L-phenylalanine and L-tyrosine |
FunCat |
10 |
0.000 |
1 |
0.049 |
|
|
|
|
|
|
|
|
|
|
|
| plant / fungal specific systemic sensing and response |
FunCat |
10 |
0.000 |
1 |
0.017 |
|
|
|
|
|
|
|
|
|
|
|
| plant hormonal regulation |
FunCat |
10 |
0.000 |
1 |
0.017 |
|
|
|
|
|
|
|
|
|
|
|
| Carbon fixation |
KEGG |
10 |
0.000 |
2 |
0.021 |
|
|
|
|
|
|
|
|
|
|
|
| Glucosinolate Metabolism |
LitPath |
10 |
0.000 |
1 |
0.019 |
|
|
|
|
|
|
|
|
|
|
|
| cytokinin transport |
TAIR-GO |
9 |
0.000 |
1 |
0.000 |
|
|
|
|
|
|
|
|
|
|
|
| photorespiration |
TAIR-GO |
9 |
0.000 |
1 |
0.001 |
|
|
|
|
|
|
|
|
|
|
|
| glycine biosynthesis I |
AraCyc |
9 |
0.000 |
1 |
0.094 |
|
|
|
|
|
|
|
|
|
|
|
| photorespiration |
AraCyc |
9 |
0.000 |
1 |
0.062 |
|
|
|
|
|
|
|
|
|
|
|
| superpathway of serine and glycine biosynthesis II |
AraCyc |
9 |
0.000 |
1 |
0.028 |
|
|
|
|
|
|
|
|
|
|
|
| ascorbic acid biosynthesis |
BioPath |
8 |
0.000 |
1 |
0.004 |
|
|
|
|
|
|
|
|
|
|
|
| biosynthesis of pyrimidine ribonucleotides |
AraCyc |
8 |
0.000 |
2 |
0.002 |
|
|
|
|
|
|
|
|
|
|
|
| de novo biosynthesis of pyrimidine ribonucleotides |
AraCyc |
8 |
0.000 |
2 |
0.002 |
|
|
|
|
|
|
|
|
|
|
|
| methylglyoxal degradation |
AraCyc |
8 |
0.000 |
2 |
0.001 |
|
|
|
|
|
|
|
|
|
|
|
| threonine degradation |
AraCyc |
8 |
0.000 |
2 |
0.002 |
|
|
|
|
|
|
|
|
|
|
|
| transport |
FunCat |
8 |
0.000 |
2 |
0.000 |
|
|
|
|
|
|
|
|
|
|
|
| Tyrosine metabolism |
KEGG |
8 |
0.000 |
2 |
0.006 |
|
|
|
|
|
|
|
|
|
|
|
|
|
|
|
|
|
|
|
|
|
|
|
|
|
|
|
|
|
|
|
|
|
|
|
|
|
|
|
|
|
|
|
|
|
|
|
|
|
|
|
|
|
|
|
|
|
|
|
|
|
|
| Pathways co-expressed in the Mutant data set (with more than 6 annotation points) |
|
CYP71B10 (At5g57260) |
|
|
|
|
|
|
|
|
| max. difference between log2-ratios: |
3.5 |
|
|
|
|
|
|
|
|
|
|
|
|
| max. difference between log2-ratios excluding lowest and highest 5%: |
0.0 |
|
|
|
|
|
|
|
|
|
|
|
|
| Pathway |
Source |
Scores of Genes |
p[Score] |
No. of Genes |
p[genes] |
Link to mutants heatmap |
|
|
|
|
|
|
|
| Lipid signaling |
AcylLipid |
14 |
0.003 |
4 |
0.112 |
|
|
|
|
| storage protein |
FunCat |
12 |
0.000 |
3 |
0.000 |
|
|
|
| Synthesis and storage of oil |
AcylLipid |
12 |
0.000 |
4 |
0.000 |
|
|
|
| gibberellic acid biosynthesis |
TAIR-GO |
10 |
0.000 |
1 |
0.001 |
|
|
|
| gibberellin biosynthesis |
AraCyc |
10 |
0.000 |
1 |
0.001 |
|
|
|
| plant / fungal specific systemic sensing and response |
FunCat |
10 |
0.000 |
1 |
0.007 |
|
|
|
| plant hormonal regulation |
FunCat |
10 |
0.000 |
1 |
0.007 |
|
|
|
| secondary metabolism |
FunCat |
10 |
0.000 |
1 |
0.061 |
|
|
|
| Diterpenoid biosynthesis |
KEGG |
10 |
0.000 |
1 |
0.000 |
|
|
|
|
|
|
|
|
|
|
|
| Gibberellin metabolism |
LitPath |
10 |
0.000 |
1 |
0.003 |
|
|
|
|
|
|
|
|
|
|
|
| giberelin biosynthesis |
LitPath |
10 |
0.000 |
1 |
0.002 |
|
|
|
|
|
|
|
|
|
|
|
| DNA-directed RNA polymerase II, core complex |
TAIR-GO |
9 |
0.000 |
1 |
0.000 |
|
|
|
|
|
|
|
|
|
|
|
| transcription from RNA polymerase II promoter |
TAIR-GO |
9 |
0.000 |
1 |
0.000 |
|
|
|
|
|
|
|
|
|
|
|
| transport |
FunCat |
9 |
0.000 |
2 |
0.000 |
|
|
|
|
|
|
|
|
|
|
|
| transport facilitation |
FunCat |
9 |
0.000 |
2 |
0.000 |
|
|
|
|
|
|
|
|
|
|
|
| RNA polymerase |
KEGG |
9 |
0.000 |
1 |
0.005 |
|
|
|
|
|
|
|
|
|
|
|
| Transcription |
KEGG |
9 |
0.000 |
1 |
0.019 |
|
|
|
|
|
|
|
|
|
|
|
| Carbon fixation |
KEGG |
8 |
0.000 |
2 |
0.001 |
|
|
|
|
|
|
|
|
|
|
|
| transport ATPases |
FunCat |
7 |
0.000 |
1 |
0.019 |
|
|
|
|
|
|
|
|
|
|
|
| Oxidative phosphorylation |
KEGG |
7 |
0.000 |
1 |
0.017 |
|
|
|
|
|
|
|
|
|
|
|
|
|
|
|
|
|
|
|
|
|
|
|
|
|
|
|
|