| _________________________________________ |
|
|
|
|
|
|
|
|
|
|
|
|
|
|
|
|
| Pathways co-expressed in all 4 data sets (with more than 6 annotation points each) |
|
Find below a list of pathways that are co-expressed with the bait. First a list of pathways is given that are co-expressed in all data sets. Lists for each individual dataset are shown underneath. Depending on the number of co-expressed pathways only the top scoring pathways are given; all data can be saved as text using the link above. |

|
|
|
|
|
|
|
|
| Pathway |
Source |
Sum of scores |
Sum of genes |
|
|
|
|
|
|
|
|
| tryptophan biosynthesis |
TAIR-GO |
470 |
61 |
|
|
|
|
|
|
|
|
| Phenylpropanoid Metabolism |
BioPath |
404 |
62 |
|
|
|
|
|
|
|
|
| Shikimate pathway |
LitPath |
294 |
39 |
|
|
|
|
|
|
|
|
| Aromatic amino acid (Phe, Tyr, Trp) metabolism |
BioPath |
288 |
38 |
|
To the right of each table a thumbnail of the actual co-expression heatmap is given. Klick on the link to see the heatmap containing all co-expressed genes. |
|
|
|
|
|
|
|
|
|
| Trp biosyntesis |
LitPath |
254 |
32 |
|
|
|
|
|
|
|
|
|
|
| Glutathione metabolism |
KEGG |
210 |
32 |
|
|
|
|
|
|
|
|
|
|
| Glutathione metabolism |
BioPath |
208 |
31 |
|
For more information on how these pathway maps were generated please read the methods page |
|
|
|
|
|
|
|
|
|
| Biosynthesis of Amino Acids and Derivatives |
BioPath |
182 |
27 |
|
|
|
|
|
|
|
|
|
|
| response to pathogenic bacteria |
TAIR-GO |
176 |
25 |
|
|
|
|
|
|
|
|
|
|
|
|
|
| toxin catabolism |
TAIR-GO |
114 |
33 |
|
|
|
|
|
|
|
|
|
|
|
|
|
| Stilbene, coumarine and lignin biosynthesis |
KEGG |
84 |
19 |
|
|
|
|
|
|
|
|
|
|
|
|
|
| lipid, fatty acid and isoprenoid degradation |
FunCat |
70 |
10 |
|
|
|
|
|
|
|
|
|
|
|
|
|
| Phenylalanine metabolism |
KEGG |
66 |
16 |
|
|
|
|
|
|
|
|
|
|
|
|
|
| metabolism of the cysteine - aromatic group |
FunCat |
50 |
5 |
|
|
|
|
|
|
|
|
|
|
|
|
|
| camalexin biosynthesis |
AraCyc |
49 |
7 |
|
|
|
|
|
|
|
|
|
|
|
|
|
| camalexin biosynthesis |
LitPath |
49 |
7 |
|
|
|
|
|
|
|
|
|
|
|
|
|
| Fluorene degradation |
KEGG |
38 |
5 |
|
|
|
|
|
|
|
|
|
|
|
|
|
| gamma-Hexachlorocyclohexane degradation |
KEGG |
38 |
5 |
|
|
|
|
|
|
|
|
|
|
|
|
|
| ascorbic acid biosynthesis |
BioPath |
36 |
9 |
|
|
|
|
|
|
|
|
|
|
|
|
|
| indole phytoalexin biosynthesis |
TAIR-GO |
28 |
4 |
|
|
|
|
|
|
|
|
|
|
|
|
|
|
|
|
|
|
|
|
|
|
|
|
|
|
|
|
|
|
|
|
|
|
|
|
|
|
|
|
|
|
|
|
|
|
|
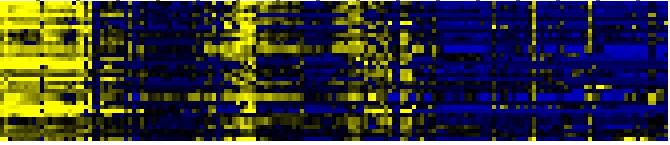
| Pathways co-expressed in the Organ and Tissue data set (with more than 6 annotation points) |
|
CYP71B15 (At3g26830) |
|
|
|
|
|
|
|
|
| max. difference between log2-ratios: |
7.2 |
|
|
|
|
|
|
|
|
|
|
|
|
| max. difference between log2-ratios excluding lowest and highest 5%: |
5.5 |
|
|
|
|
|
|
|
|
|
|
|
|
| Pathway |
Source |
Scores of Genes |
p[Score] |
No. of Genes |
p[genes] |
Link to organ heatmap |
|
|
|
|
|
|
|
| toxin catabolism |
TAIR-GO |
18 |
0.000 |
5 |
0.000 |
|
|
|
| triacylglycerol degradation |
AraCyc |
17 |
0.000 |
2 |
0.005 |
|
|
| Stilbene, coumarine and lignin biosynthesis |
KEGG |
15 |
0.000 |
5 |
0.001 |
|
|
| Biosynthesis of Amino Acids and Derivatives |
BioPath |
14 |
0.000 |
3 |
0.019 |
|
|
| lipases pathway |
AraCyc |
14 |
0.000 |
2 |
0.001 |
|
|
| amino acid metabolism |
FunCat |
14 |
0.000 |
2 |
0.014 |
|
|
| lipid, fatty acid and isoprenoid degradation |
FunCat |
14 |
0.000 |
2 |
0.000 |
|
|
| Glutathione metabolism |
KEGG |
14 |
0.000 |
3 |
0.001 |
|
|
| Glycerophospholipid metabolism |
KEGG |
14 |
0.000 |
2 |
0.002 |
|
|
| Lipid signaling |
AcylLipid |
14 |
0.000 |
2 |
0.050 |
|
|
|
|
|
|
|
|
|
|
|
| Cell Wall Carbohydrate Metabolism |
BioPath |
12 |
0.039 |
3 |
0.157 |
|
|
|
|
|
|
|
|
|
|
|
| Glutathione metabolism |
BioPath |
12 |
0.000 |
2 |
0.009 |
|
|
|
|
|
|
|
|
|
|
|
| Phenylpropanoid Metabolism |
BioPath |
12 |
0.001 |
2 |
0.093 |
|
|
|
|
|
|
|
|
|
|
|
| Miscellaneous acyl lipid metabolism |
AcylLipid |
12 |
0.001 |
2 |
0.061 |
|
|
|
|
|
|
|
|
|
|
|
| Aromatic amino acid (Phe, Tyr, Trp) metabolism |
BioPath |
10 |
0.000 |
1 |
0.047 |
|
|
|
|
|
|
|
|
|
|
|
| aging |
TAIR-GO |
10 |
0.000 |
1 |
0.001 |
|
|
|
|
|
|
|
|
|
|
|
| defense response |
TAIR-GO |
10 |
0.000 |
1 |
0.010 |
|
|
|
|
|
|
|
|
|
|
|
| defense response to pathogenic bacteria, incompatible interaction |
TAIR-GO |
10 |
0.000 |
1 |
0.001 |
|
|
|
|
|
|
|
|
|
|
|
| response to pathogenic bacteria |
TAIR-GO |
10 |
0.000 |
1 |
0.001 |
|
|
|
|
|
|
|
|
|
|
|
| response to stress |
TAIR-GO |
10 |
0.000 |
1 |
0.000 |
|
|
|
|
|
|
|
|
|
|
|
| tryptophan biosynthesis |
TAIR-GO |
10 |
0.000 |
1 |
0.007 |
|
|
|
|
|
|
|
|
|
|
|
| metabolism of the cysteine - aromatic group |
FunCat |
10 |
0.000 |
1 |
0.001 |
|
|
|
|
|
|
|
|
|
|
|
| Shikimate pathway |
LitPath |
10 |
0.000 |
1 |
0.019 |
|
|
|
|
|
|
|
|
|
|
|
| Trp biosyntesis |
LitPath |
10 |
0.000 |
1 |
0.003 |
|
|
|
|
|
|
|
|
|
|
|
| disease, virulence and defense |
FunCat |
9 |
0.000 |
2 |
0.000 |
|
|
|
|
|
|
|
|
|
|
|
| ascorbic acid biosynthesis |
BioPath |
8 |
0.000 |
2 |
0.000 |
|
|
|
|
|
|
|
|
|
|
|
| intracellular signalling |
FunCat |
8 |
0.000 |
3 |
0.000 |
|
|
|
|
|
|
|
|
|
|
|
| Benzoate degradation via CoA ligation |
KEGG |
8 |
0.001 |
3 |
0.015 |
|
|
|
|
|
|
|
|
|
|
|
| Inositol phosphate metabolism |
KEGG |
8 |
0.002 |
3 |
0.020 |
|
|
|
|
|
|
|
|
|
|
|
| Methane metabolism |
KEGG |
8 |
0.000 |
4 |
0.002 |
|
|
|
|
|
|
|
|
|
|
|
| Nicotinate and nicotinamide metabolism |
KEGG |
8 |
0.000 |
3 |
0.011 |
|
|
|
|
|
|
|
|
|
|
|
| Phenylalanine metabolism |
KEGG |
8 |
0.000 |
4 |
0.002 |
|
|
|
|
|
|
|
|
|
|
|
| Prostaglandin and leukotriene metabolism |
KEGG |
8 |
0.000 |
4 |
0.001 |
|
|
|
|
|
|
|
|
|
|
|
| indole phytoalexin biosynthesis |
TAIR-GO |
7 |
0.000 |
1 |
0.000 |
|
|
|
|
|
|
|
|
|
|
|
| response to osmotic stress |
TAIR-GO |
7 |
0.000 |
1 |
0.000 |
|
|
|
|
|
|
|
|
|
|
|
| systemic acquired resistance |
TAIR-GO |
7 |
0.000 |
1 |
0.001 |
|
|
|
|
|
|
|
|
|
|
|
| systemic acquired resistance, salicylic acid mediated signaling pathway |
TAIR-GO |
7 |
0.000 |
1 |
0.000 |
|
|
|
|
|
|
|
|
|
|
|
| camalexin biosynthesis |
AraCyc |
7 |
0.000 |
1 |
0.000 |
|
|
|
|
|
|
|
|
|
|
|
| fatty acid biosynthesis -- initial steps |
AraCyc |
7 |
0.000 |
1 |
0.018 |
|
|
|
|
|
|
|
|
|
|
|
| resistance proteins |
FunCat |
7 |
0.000 |
1 |
0.000 |
|
|
|
|
|
|
|
|
|
|
|
| Ascorbate and aldarate metabolism |
KEGG |
7 |
0.000 |
1 |
0.029 |
|
|
|
|
|
|
|
|
|
|
|
| Fluorene degradation |
KEGG |
7 |
0.000 |
1 |
0.011 |
|
|
|
|
|
|
|
|
|
|
|
| gamma-Hexachlorocyclohexane degradation |
KEGG |
7 |
0.000 |
1 |
0.014 |
|
|
|
|
|
|
|
|
|
|
|
| camalexin biosynthesis |
LitPath |
7 |
0.000 |
1 |
0.000 |
|
|
|
|
|
|
|
|
|
|
|
|
|
|
|
|
|
|
|
|
|
|
|
|
|
|
|
|
|
|
|
|
|
|
|
|
|
|
|
|
|
|
|
|
|
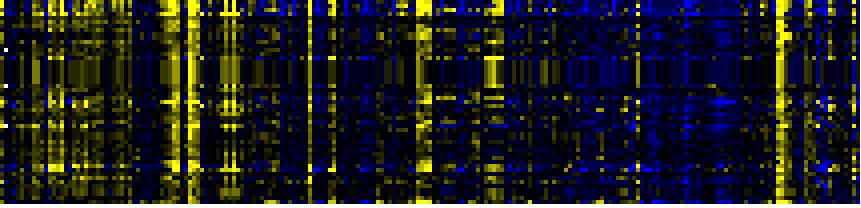
| Pathways co-expressed in the Stress data set ( with more than 10 annotation points) |
|
CYP71B15 (At3g26830) |
|
|
|
|
|
|
|
|
| max. difference between log2-ratios: |
9.8 |
|
|
|
|
|
|
|
|
|
|
|
|
| max. difference between log2-ratios excluding lowest and highest 5%: |
5.5 |
|
|
|
|
|
|
|
|
|
|
|
|
| Pathway |
Source |
Scores of Genes |
p[Score] |
No. of Genes |
p[genes] |
Link to stress heatmap |
|
|
|
|
|
|
|
| Phenylpropanoid Metabolism |
BioPath |
154 |
0.000 |
24 |
0.000 |
|
| Aromatic amino acid (Phe, Tyr, Trp) metabolism |
BioPath |
124 |
0.000 |
16 |
0.000 |
| Shikimate pathway |
LitPath |
120 |
0.000 |
16 |
0.000 |
| Phenylalanine, tyrosine and tryptophan biosynthesis |
KEGG |
102 |
0.000 |
13 |
0.000 |
| tryptophan biosynthesis |
TAIR-GO |
88 |
0.000 |
11 |
0.000 |
| Trp biosyntesis |
LitPath |
88 |
0.000 |
11 |
0.000 |
| tryptophan biosynthesis |
AraCyc |
78 |
0.000 |
10 |
0.000 |
| C-compound and carbohydrate metabolism |
FunCat |
73.5 |
0.000 |
17 |
0.001 |
| Intermediary Carbon Metabolism |
BioPath |
70 |
0.000 |
17 |
0.000 |
| response to pathogenic bacteria |
TAIR-GO |
64 |
0.000 |
9 |
0.000 |
| Biosynthesis of Amino Acids and Derivatives |
BioPath |
60 |
0.014 |
9 |
0.153 |
| Gluconeogenesis from lipids in seeds |
BioPath |
55 |
0.000 |
7 |
0.007 |
| Glutathione metabolism |
KEGG |
54 |
0.000 |
9 |
0.000 |
| Glutathione metabolism |
BioPath |
48 |
0.000 |
7 |
0.007 |
|
|
|
|
|
|
|
|
|
|
|
| toxin catabolism |
TAIR-GO |
44 |
0.000 |
10 |
0.000 |
|
|
|
|
|
|
|
|
|
|
|
| amino acid metabolism |
FunCat |
44 |
0.000 |
6 |
0.038 |
|
|
|
|
|
|
|
|
|
|
|
| Citrate cycle (TCA cycle) |
KEGG |
44 |
0.000 |
10 |
0.000 |
|
|
|
|
|
|
|
|
|
|
|
| Glutamate metabolism |
KEGG |
42 |
0.000 |
6 |
0.004 |
|
|
|
|
|
|
|
|
|
|
|
| tricarboxylic-acid pathway (citrate cycle, Krebs cycle, TCA cycle) |
FunCat |
38 |
0.000 |
10 |
0.000 |
|
|
|
|
|
|
|
|
|
|
|
| Carbon fixation |
KEGG |
38 |
0.000 |
7 |
0.012 |
|
|
|
|
|
|
|
|
|
|
|
| Stilbene, coumarine and lignin biosynthesis |
KEGG |
37 |
0.000 |
8 |
0.047 |
|
|
|
|
|
|
|
|
|
|
|
| lipid, fatty acid and isoprenoid degradation |
FunCat |
36 |
0.000 |
5 |
0.000 |
|
|
|
|
|
|
|
|
|
|
|
| Alanine and aspartate metabolism |
KEGG |
34 |
0.000 |
5 |
0.003 |
|
|
|
|
|
|
|
|
|
|
|
| Miscellaneous acyl lipid metabolism |
AcylLipid |
34 |
0.000 |
7 |
0.039 |
|
|
|
|
|
|
|
|
|
|
|
| Fatty acid metabolism |
KEGG |
30 |
0.000 |
3 |
0.078 |
|
|
|
|
|
|
|
|
|
|
|
| Phenylalanine metabolism |
KEGG |
30 |
0.000 |
7 |
0.056 |
|
|
|
|
|
|
|
|
|
|
|
| aromatic amino acid family biosynthesis |
TAIR-GO |
28 |
0.000 |
4 |
0.000 |
|
|
|
|
|
|
|
|
|
|
|
| aromatic amino acid family biosynthesis, shikimate pathway |
TAIR-GO |
28 |
0.000 |
4 |
0.000 |
|
|
|
|
|
|
|
|
|
|
|
| chorismate biosynthesis |
LitPath |
28 |
0.000 |
4 |
0.002 |
|
|
|
|
|
|
|
|
|
|
|
| Degradation of storage lipids and straight fatty acids |
AcylLipid |
27 |
0.000 |
3 |
0.027 |
|
|
|
|
|
|
|
|
|
|
|
| glycolysis and gluconeogenesis |
FunCat |
26.5 |
0.025 |
6 |
0.067 |
|
|
|
|
|
|
|
|
|
|
|
| alanine biosynthesis II |
AraCyc |
22 |
0.000 |
5 |
0.000 |
|
|
|
|
|
|
|
|
|
|
|
| chorismate biosynthesis |
AraCyc |
22 |
0.000 |
3 |
0.000 |
|
|
|
|
|
|
|
|
|
|
|
| Alkaloid biosynthesis I |
KEGG |
22 |
0.000 |
3 |
0.019 |
|
|
|
|
|
|
|
|
|
|
|
| Arginine and proline metabolism |
KEGG |
22 |
0.001 |
3 |
0.141 |
|
|
|
|
|
|
|
|
|
|
|
| Novobiocin biosynthesis |
KEGG |
22 |
0.000 |
3 |
0.003 |
|
|
|
|
|
|
|
|
|
|
|
| Tyrosine metabolism |
KEGG |
22 |
0.002 |
3 |
0.123 |
|
|
|
|
|
|
|
|
|
|
|
| protein catabolism |
TAIR-GO |
20 |
0.021 |
3 |
0.200 |
|
|
|
|
|
|
|
|
|
|
|
| ubiquitin-dependent protein catabolism |
TAIR-GO |
20 |
0.006 |
3 |
0.133 |
|
|
|
|
|
|
|
|
|
|
|
| Proteasome |
KEGG |
20 |
0.047 |
3 |
0.238 |
|
|
|
|
|
|
|
|
|
|
|
| abscisic acid biosynthesis |
TAIR-GO |
19 |
0.000 |
2 |
0.010 |
|
|
|
|
|
|
|
|
|
|
|
| response to stress |
TAIR-GO |
19 |
0.000 |
2 |
0.000 |
|
|
|
|
|
|
|
|
|
|
|
| IAA biosynthesis |
AraCyc |
19 |
0.000 |
2 |
0.006 |
|
|
|
|
|
|
|
|
|
|
|
| degradation |
FunCat |
19 |
0.000 |
2 |
0.044 |
|
|
|
|
|
|
|
|
|
|
|
| Galactose metabolism |
KEGG |
19 |
0.002 |
2 |
0.185 |
|
|
|
|
|
|
|
|
|
|
|
| lignin biosynthesis |
AraCyc |
18 |
0.002 |
3 |
0.052 |
|
|
|
|
|
|
|
|
|
|
|
| TCA cycle -- aerobic respiration |
AraCyc |
18 |
0.001 |
4 |
0.017 |
|
|
|
|
|
|
|
|
|
|
|
| Glycine, serine and threonine metabolism |
KEGG |
18 |
0.009 |
3 |
0.092 |
|
|
|
|
|
|
|
|
|
|
|
| Propanoate metabolism |
KEGG |
18 |
0.001 |
3 |
0.053 |
|
|
|
|
|
|
|
|
|
|
|
| fatty acid beta oxidation complex |
BioPath |
17 |
0.000 |
2 |
0.062 |
|
|
|
|
|
|
|
|
|
|
|
|
|
|
|
|
|
|
|
|
|
|
|
|
|
|
|
|
|
|
|
|
|
|
|
|
|
|
|
|
|
|
|
|
|
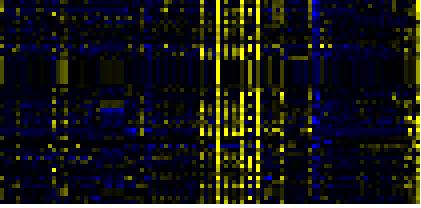
| Pathways co-expressed in the Hormone etc. data set (with more than 10 annotation points) |
|
CYP71B15 (At3g26830) |
|
|
|
|
|
|
|
|
| max. difference between log2-ratios: |
9.4 |
|
|
|
|
|
|
|
|
|
|
|
|
| max. difference between log2-ratios excluding lowest and highest 5%: |
2.4 |
|
|
|
|
|
|
|
|
|
|
|
|
| Pathway |
Source |
Scores of Genes |
p[Score] |
No. of Genes |
p[genes] |
Link to hormones etc. heatmap |
|
|
|
|
|
|
|
| Phenylpropanoid Metabolism |
BioPath |
135 |
0.000 |
21 |
0.000 |
|
|
|
|
|
|
| Shikimate pathway |
LitPath |
82 |
0.000 |
11 |
0.000 |
|
|
|
|
|
| Aromatic amino acid (Phe, Tyr, Trp) metabolism |
BioPath |
78 |
0.000 |
11 |
0.000 |
|
|
|
|
|
| tryptophan biosynthesis |
TAIR-GO |
78 |
0.000 |
10 |
0.000 |
|
|
|
|
|
| Trp biosyntesis |
LitPath |
78 |
0.000 |
10 |
0.000 |
|
|
|
|
|
| Biosynthesis of Amino Acids and Derivatives |
BioPath |
68 |
0.000 |
9 |
0.024 |
|
|
|
|
|
| tryptophan biosynthesis |
AraCyc |
68 |
0.000 |
9 |
0.000 |
|
|
|
|
|
| Glutathione metabolism |
BioPath |
64 |
0.000 |
8 |
0.000 |
|
|
|
|
|
| amino acid metabolism |
FunCat |
59 |
0.000 |
8 |
0.000 |
|
|
|
|
|
| response to pathogenic bacteria |
TAIR-GO |
54 |
0.000 |
8 |
0.000 |
|
|
|
|
|
| Phenylalanine, tyrosine and tryptophan biosynthesis |
KEGG |
50 |
0.000 |
7 |
0.000 |
|
|
|
|
|
| sulfate assimilation III |
AraCyc |
44 |
0.000 |
6 |
0.000 |
|
|
|
|
|
| Phenylpropanoid pathway |
LitPath |
42 |
0.000 |
7 |
0.034 |
|
|
|
|
|
| toxin catabolism |
TAIR-GO |
40 |
0.000 |
12 |
0.000 |
|
|
|
|
|
|
|
|
|
|
|
| cysteine biosynthesis I |
AraCyc |
35 |
0.000 |
5 |
0.000 |
|
|
|
|
|
|
|
|
|
|
|
| Glucosyltransferases for benzoic acids |
BioPath |
30 |
0.000 |
3 |
0.000 |
|
|
|
|
|
|
|
|
|
|
|
| lignin biosynthesis |
AraCyc |
30 |
0.000 |
5 |
0.001 |
|
|
|
|
|
|
|
|
|
|
|
| Glutathione metabolism |
KEGG |
30 |
0.000 |
5 |
0.000 |
|
|
|
|
|
|
|
|
|
|
|
| response to wounding |
TAIR-GO |
28 |
0.000 |
4 |
0.002 |
|
|
|
|
|
|
|
|
|
|
|
| nitrogen and sulfur metabolism |
FunCat |
28 |
0.000 |
4 |
0.000 |
|
|
|
|
|
|
|
|
|
|
|
| core phenylpropanoid metabolism |
BioPath |
24 |
0.000 |
4 |
0.010 |
|
|
|
|
|
|
|
|
|
|
|
| biosynthesis of proto- and siroheme |
AraCyc |
21 |
0.000 |
3 |
0.017 |
|
|
|
|
|
|
|
|
|
|
|
| metabolism of the cysteine - aromatic group |
FunCat |
20 |
0.000 |
2 |
0.001 |
|
|
|
|
|
|
|
|
|
|
|
| Nitrogen metabolism |
KEGG |
19 |
0.000 |
2 |
0.042 |
|
|
|
|
|
|
|
|
|
|
|
| Stilbene, coumarine and lignin biosynthesis |
KEGG |
19 |
0.003 |
3 |
0.221 |
|
|
|
|
|
|
|
|
|
|
|
| IAA biosynthesis |
AraCyc |
18 |
0.000 |
2 |
0.003 |
|
|
|
|
|
|
|
|
|
|
|
| suberin biosynthesis |
AraCyc |
18 |
0.000 |
3 |
0.001 |
|
|
|
|
|
|
|
|
|
|
|
| Alanine and aspartate metabolism |
KEGG |
18 |
0.000 |
3 |
0.006 |
|
|
|
|
|
|
|
|
|
|
|
| Glutamate metabolism |
KEGG |
18 |
0.001 |
3 |
0.020 |
|
|
|
|
|
|
|
|
|
|
|
| sulfate assimilation |
TAIR-GO |
16 |
0.000 |
2 |
0.003 |
|
|
|
|
|
|
|
|
|
|
|
| alanine biosynthesis II |
AraCyc |
16 |
0.000 |
3 |
0.003 |
|
|
|
|
|
|
|
|
|
|
|
| dissimilatory sulfate reduction |
AraCyc |
16 |
0.000 |
2 |
0.000 |
|
|
|
|
|
|
|
|
|
|
|
| Alkaloid biosynthesis I |
KEGG |
16 |
0.000 |
2 |
0.015 |
|
|
|
|
|
|
|
|
|
|
|
| Citrate cycle (TCA cycle) |
KEGG |
16 |
0.000 |
3 |
0.017 |
|
|
|
|
|
|
|
|
|
|
|
| Phenylalanine metabolism |
KEGG |
16 |
0.005 |
2 |
0.357 |
|
|
|
|
|
|
|
|
|
|
|
| Tyrosine metabolism |
KEGG |
16 |
0.000 |
2 |
0.073 |
|
|
|
|
|
|
|
|
|
|
|
| Arginine and proline metabolism |
KEGG |
15 |
0.001 |
2 |
0.082 |
|
|
|
|
|
|
|
|
|
|
|
| defense response |
TAIR-GO |
14 |
0.001 |
2 |
0.046 |
|
|
|
|
|
|
|
|
|
|
|
| Cysteine metabolism |
KEGG |
14 |
0.000 |
2 |
0.027 |
|
|
|
|
|
|
|
|
|
|
|
| Glycine, serine and threonine metabolism |
KEGG |
14 |
0.001 |
2 |
0.056 |
|
|
|
|
|
|
|
|
|
|
|
| ethylene biosynthesis |
TAIR-GO |
13 |
0.000 |
2 |
0.003 |
|
|
|
|
|
|
|
|
|
|
|
| response to mechanical stimulus |
TAIR-GO |
13 |
0.000 |
2 |
0.000 |
|
|
|
|
|
|
|
|
|
|
|
| jasmonic acid biosynthesis |
TAIR-GO |
12 |
0.002 |
2 |
0.041 |
|
|
|
|
|
|
|
|
|
|
|
| jasmonic acid biosynthesis |
AraCyc |
12 |
0.000 |
2 |
0.009 |
|
|
|
|
|
|
|
|
|
|
|
| C-compound and carbohydrate utilization |
FunCat |
12 |
0.000 |
2 |
0.000 |
|
|
|
|
|
|
|
|
|
|
|
| lipid, fatty acid and isoprenoid degradation |
FunCat |
12 |
0.000 |
2 |
0.015 |
|
|
|
|
|
|
|
|
|
|
|
| respiration |
FunCat |
12 |
0.000 |
2 |
0.003 |
|
|
|
|
|
|
|
|
|
|
|
| beta-Alanine metabolism |
KEGG |
12 |
0.000 |
2 |
0.012 |
|
|
|
|
|
|
|
|
|
|
|
| Butanoate metabolism |
KEGG |
12 |
0.000 |
2 |
0.022 |
|
|
|
|
|
|
|
|
|
|
|
| Taurine and hypotaurine metabolism |
KEGG |
12 |
0.000 |
2 |
0.000 |
|
|
|
|
|
|
|
|
|
|
|
|
|
|
|
|
|
|
|
|
|
|
|
|
|
|
|
|
|
|
|
|
|
|
|
|
|
|
|
|
|
|
|
|
|
|
|
|
|
|
|
|
|
|
|
|
|
|
|
|
|
|
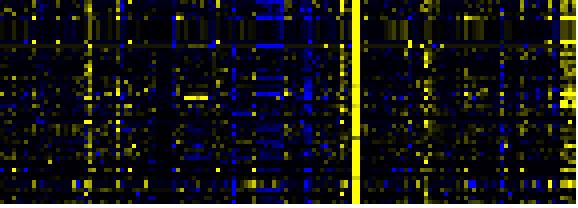
| Pathways co-expressed in the Mutant data set (with more than 10 annotation points) |
|
CYP71B15 (At3g26830) |
|
|
|
|
|
|
|
|
| max. difference between log2-ratios: |
8.6 |
|
|
|
|
|
|
|
|
|
|
|
|
| max. difference between log2-ratios excluding lowest and highest 5%: |
3.7 |
|
|
|
|
|
|
|
|
|
|
|
|
| Pathway |
Source |
Scores of Genes |
p[Score] |
No. of Genes |
p[genes] |
Link to mutants heatmap |
|
|
|
|
|
|
|
| Phenylpropanoid Metabolism |
BioPath |
103 |
0.000 |
15 |
0.000 |
|
|
|
|
| Shikimate pathway |
LitPath |
82 |
0.000 |
11 |
0.000 |
|
|
|
| tryptophan biosynthesis |
TAIR-GO |
78 |
0.000 |
10 |
0.000 |
|
|
|
| Trp biosyntesis |
LitPath |
78 |
0.000 |
10 |
0.000 |
|
|
|
| Aromatic amino acid (Phe, Tyr, Trp) metabolism |
BioPath |
76 |
0.000 |
10 |
0.000 |
|
|
|
| tryptophan biosynthesis |
AraCyc |
70 |
0.000 |
10 |
0.000 |
|
|
|
| response to pathogenic bacteria |
TAIR-GO |
48 |
0.000 |
7 |
0.000 |
|
|
|
| Phenylalanine, tyrosine and tryptophan biosynthesis |
KEGG |
48 |
0.000 |
6 |
0.000 |
|
|
|
| Phenylpropanoid pathway |
LitPath |
46 |
0.000 |
8 |
0.014 |
|
|
|
| Biosynthesis of Amino Acids and Derivatives |
BioPath |
40 |
0.005 |
6 |
0.130 |
|
|
|
| Benzoate degradation via CoA ligation |
KEGG |
36 |
0.000 |
10 |
0.000 |
|
|
|
| Inositol phosphate metabolism |
KEGG |
36 |
0.000 |
10 |
0.000 |
|
|
|
| Nicotinate and nicotinamide metabolism |
KEGG |
36 |
0.000 |
10 |
0.000 |
|
|
|
| lignin biosynthesis |
AraCyc |
30 |
0.000 |
5 |
0.000 |
|
|
|
|
|
|
|
|
|
|
|
| Lipid signaling |
AcylLipid |
30 |
0.000 |
8 |
0.038 |
|
|
|
|
|
|
|
|
|
|
|
| core phenylpropanoid metabolism |
BioPath |
26 |
0.000 |
4 |
0.005 |
|
|
|
|
|
|
|
|
|
|
|
| Methionin/SAM/ethylene metabolism from cysteine and aspartate |
BioPath |
26 |
0.000 |
3 |
0.007 |
|
|
|
|
|
|
|
|
|
|
|
| response to wounding |
TAIR-GO |
26 |
0.000 |
3 |
0.002 |
|
|
|
|
|
|
|
|
|
|
|
| Miscellaneous acyl lipid metabolism |
AcylLipid |
26 |
0.000 |
7 |
0.139 |
|
|
|
|
|
|
|
|
|
|
|
| triacylglycerol degradation |
AraCyc |
25 |
0.000 |
6 |
0.000 |
|
|
|
|
|
|
|
|
|
|
|
| intracellular signalling |
FunCat |
19 |
0.000 |
6 |
0.000 |
|
|
|
|
|
|
|
|
|
|
|
| biosynthesis of proto- and siroheme |
AraCyc |
14 |
0.000 |
2 |
0.033 |
|
|
|
|
|
|
|
|
|
|
|
| chlorophyll biosynthesis |
AraCyc |
14 |
0.000 |
2 |
0.060 |
|
|
|
|
|
|
|
|
|
|
|
| disease, virulence and defense |
FunCat |
13 |
0.000 |
3 |
0.000 |
|
|
|
|
|
|
|
|
|
|
|
| Stilbene, coumarine and lignin biosynthesis |
KEGG |
13 |
0.022 |
3 |
0.227 |
|
|
|
|
|
|
|
|
|
|
|
| cellulose biosynthesis |
BioPath |
12 |
0.016 |
2 |
0.107 |
|
|
|
|
|
|
|
|
|
|
|
| toxin catabolism |
TAIR-GO |
12 |
0.000 |
6 |
0.000 |
|
|
|
|
|
|
|
|
|
|
|
| flavonoid biosynthesis |
AraCyc |
12 |
0.000 |
2 |
0.011 |
|
|
|
|
|
|
|
|
|
|
|
| biogenesis of cell wall |
FunCat |
12 |
0.000 |
3 |
0.020 |
|
|
|
|
|
|
|
|
|
|
|
| Alanine and aspartate metabolism |
KEGG |
12 |
0.000 |
2 |
0.040 |
|
|
|
|
|
|
|
|
|
|
|
| beta-Alanine metabolism |
KEGG |
12 |
0.000 |
2 |
0.012 |
|
|
|
|
|
|
|
|
|
|
|
| Butanoate metabolism |
KEGG |
12 |
0.000 |
2 |
0.023 |
|
|
|
|
|
|
|
|
|
|
|
| Glutamate metabolism |
KEGG |
12 |
0.011 |
2 |
0.088 |
|
|
|
|
|
|
|
|
|
|
|
| Glycan Biosynthesis and Metabolism |
KEGG |
12 |
0.018 |
4 |
0.019 |
|
|
|
|
|
|
|
|
|
|
|
| Phenylalanine metabolism |
KEGG |
12 |
0.014 |
3 |
0.166 |
|
|
|
|
|
|
|
|
|
|
|
| Taurine and hypotaurine metabolism |
KEGG |
12 |
0.000 |
2 |
0.000 |
|
|
|
|
|
|
|
|
|
|
|
| systemic acquired resistance |
TAIR-GO |
11 |
0.000 |
2 |
0.001 |
|
|
|
|
|
|
|
|
|
|
|
| de novo biosynthesis of purine nucleotides I |
AraCyc |
11 |
0.024 |
2 |
0.189 |
|
|
|
|
|
|
|
|
|
|
|
| aging |
TAIR-GO |
10 |
0.000 |
1 |
0.017 |
|
|
|
|
|
|
|
|
|
|
|
| anthranilate synthase complex |
TAIR-GO |
10 |
0.000 |
1 |
0.001 |
|
|
|
|
|
|
|
|
|
|
|
| ethylene biosynthesis |
TAIR-GO |
10 |
0.000 |
1 |
0.017 |
|
|
|
|
|
|
|
|
|
|
|
| jasmonic acid biosynthesis |
TAIR-GO |
10 |
0.001 |
1 |
0.088 |
|
|
|
|
|
|
|
|
|
|
|
| lignin biosynthesis |
TAIR-GO |
10 |
0.000 |
1 |
0.022 |
|
|
|
|
|
|
|
|
|
|
|
| methionine biosynthesis |
TAIR-GO |
10 |
0.000 |
1 |
0.004 |
|
|
|
|
|
|
|
|
|
|
|
| phenylpropanoid metabolism |
TAIR-GO |
10 |
0.000 |
1 |
0.010 |
|
|
|
|
|
|
|
|
|
|
|
| porphyrin biosynthesis |
TAIR-GO |
10 |
0.000 |
1 |
0.045 |
|
|
|
|
|
|
|
|
|
|
|
| sulfate assimilation |
TAIR-GO |
10 |
0.000 |
1 |
0.017 |
|
|
|
|
|
|
|
|
|
|
|
| alanine biosynthesis II |
AraCyc |
10 |
0.000 |
2 |
0.009 |
|
|
|
|
|
|
|
|
|
|
|
| dissimilatory sulfate reduction |
AraCyc |
10 |
0.000 |
1 |
0.006 |
|
|
|
|
|
|
|
|
|
|
|
| jasmonic acid biosynthesis |
AraCyc |
10 |
0.000 |
1 |
0.038 |
|
|
|
|
|
|
|
|
|
|
|
|
|
|
|
|
|
|
|
|
|
|
|
|
|
|
|
|