| _________________________________________ |
|
|
|
|
|
|
|
|
|
|
|
|
|
|
|
|
| Pathways co-expressed in the 3 applicable data sets (with more than 6 annotation points each) |
|
Find below a list of pathways that are co-expressed with the bait. First a list of pathways is given that are co-expressed in all data sets. Lists for each individual dataset are shown underneath. Depending on the number of co-expressed pathways only the top scoring pathways are given; all data can be saved as text using the link above. |

|
|
|
|
|
|
|
|
| Pathway |
Source |
Sum of scores |
Sum of genes |
|
|
|
|
|
|
|
|
| Starch and sucrose metabolism |
KEGG |
94 |
21 |
|
|
|
|
|
|
|
|
| transport |
FunCat |
92 |
21 |
|
|
|
|
|
|
|
|
| biogenesis of cell wall |
FunCat |
70 |
22 |
|
|
|
|
|
|
|
|
| transport facilitation |
FunCat |
70 |
18 |
|
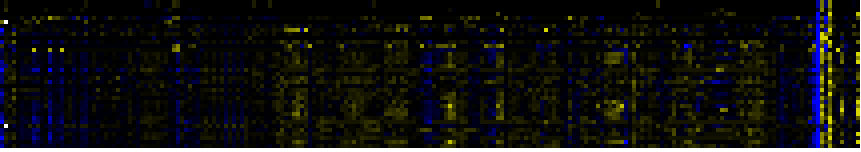
To the right of each table a thumbnail of the actual co-expression heatmap is given. Klick on the link to see the heatmap containing all co-expressed genes. |
|
|
|
|
|
|
|
|
|
| secondary metabolism |
FunCat |
59 |
13 |
|
|
|
|
|
|
|
|
|
|
| starch biosynthesis |
AraCyc |
45 |
6 |
|
|
|
|
|
|
|
|
|
|
| glucosinolate biosynthesis |
TAIR-GO |
30 |
3 |
|
For more information on how these pathway maps were generated please read the methods page |
|
|
|
|
|
|
|
|
|
|
|
|
|
|
|
|
|
|
|
|
|
|
|
|
|
|
|
|
|
|
|
|
|
|
|
|
|
|
|
|
|
|
|
|
|
|
|
|
|
|
|
|
|
|
|
|
|
|
|
|
|
|
|
|
|
|
|
|
|
|
|
|
|
|
| Pathways co-expressed in the Stress data set ( with more than 10 annotation points) |
|
CYP71B17 / CYP71B16 (At3g26160 / At3g26150) |
|
|
|
|
|
|
|
|
| max. difference between log2-ratios: |
3.5 |
|
|
|
|
|
|
|
|
|
|
|
|
| max. difference between log2-ratios excluding lowest and highest 5%: |
0.1 |
|
|
|
|
|
|
|
|
|
|
|
|
| Pathway |
Source |
Scores of Genes |
p[Score] |
No. of Genes |
p[genes] |
Link to stress heatmap |
|
|
|
|
|
|
|
| Photosystems |
BioPath |
96 |
0.000 |
13 |
0.000 |
|
| Photosystem I |
BioPath |
36 |
0.000 |
6 |
0.000 |
| Photosynthesis |
KEGG |
34 |
0.000 |
5 |
0.000 |
| biogenesis of chloroplast |
FunCat |
32 |
0.000 |
4 |
0.001 |
| additional photosystem II components |
BioPath |
28 |
0.000 |
3 |
0.010 |
| Photosystem II |
BioPath |
28 |
0.000 |
4 |
0.001 |
| Chlorophyll a/b binding proteins |
BioPath |
24 |
0.000 |
3 |
0.001 |
| secondary metabolism |
FunCat |
20 |
0.000 |
2 |
0.031 |
| Glucosinolate Metabolism |
LitPath |
20 |
0.000 |
2 |
0.001 |
| Photosystem II reaction center |
BioPath |
18 |
0.000 |
3 |
0.000 |
| transport |
FunCat |
18 |
0.000 |
2 |
0.000 |
|
|
|
|
|
|
|
|
|
|
|
| glycine biosynthesis I |
AraCyc |
17 |
0.000 |
3 |
0.002 |
|
|
|
|
|
|
|
|
|
|
|
| photorespiration |
AraCyc |
17 |
0.000 |
3 |
0.001 |
|
|
|
|
|
|
|
|
|
|
|
| superpathway of serine and glycine biosynthesis II |
AraCyc |
17 |
0.000 |
3 |
0.000 |
|
|
|
|
|
|
|
|
|
|
|
| light harvesting complex |
BioPath |
16 |
0.000 |
2 |
0.000 |
|
|
|
|
|
|
|
|
|
|
|
| aerobic respiration |
FunCat |
16 |
0.000 |
2 |
0.001 |
|
|
|
|
|
|
|
|
|
|
|
| respiration |
FunCat |
16 |
0.000 |
2 |
0.001 |
|
|
|
|
|
|
|
|
|
|
|
| Carbon fixation |
KEGG |
15 |
0.000 |
2 |
0.017 |
|
|
|
|
|
|
|
|
|
|
|
| photorespiration |
TAIR-GO |
13 |
0.000 |
2 |
0.000 |
|
|
|
|
|
|
|
|
|
|
|
| ATP-dependent proteolysis |
TAIR-GO |
12 |
0.000 |
3 |
0.000 |
|
|
|
|
|
|
|
|
|
|
|
| formaldehyde assimilation I (serine pathway) |
AraCyc |
12 |
0.000 |
2 |
0.008 |
|
|
|
|
|
|
|
|
|
|
|
| serine-isocitrate lyase pathway |
AraCyc |
12 |
0.000 |
2 |
0.018 |
|
|
|
|
|
|
|
|
|
|
|
| Starch and sucrose metabolism |
KEGG |
11 |
0.001 |
2 |
0.025 |
|
|
|
|
|
|
|
|
|
|
|
| ATP synthase components |
BioPath |
10 |
0.000 |
1 |
0.019 |
|
|
|
|
|
|
|
|
|
|
|
| Cytochrome b6/f complex |
BioPath |
10 |
0.000 |
1 |
0.015 |
|
|
|
|
|
|
|
|
|
|
|
| Oxygen-evolving enhancer protein |
BioPath |
10 |
0.000 |
1 |
0.005 |
|
|
|
|
|
|
|
|
|
|
|
| Plastocyanin |
BioPath |
10 |
0.000 |
1 |
0.000 |
|
|
|
|
|
|
|
|
|
|
|
| starch metabolism |
BioPath |
10 |
0.008 |
1 |
0.139 |
|
|
|
|
|
|
|
|
|
|
|
| ATP synthesis coupled proton transport |
TAIR-GO |
10 |
0.000 |
1 |
0.002 |
|
|
|
|
|
|
|
|
|
|
|
| chloroplast ATP synthase complex |
TAIR-GO |
10 |
0.000 |
1 |
0.000 |
|
|
|
|
|
|
|
|
|
|
|
| extrinsic to photosynthetic water oxidation |
TAIR-GO |
10 |
0.000 |
1 |
0.000 |
|
|
|
|
|
|
|
|
|
|
|
| glucosinolate biosynthesis |
TAIR-GO |
10 |
0.000 |
1 |
0.006 |
|
|
|
|
|
|
|
|
|
|
|
| glucosinolate catabolism |
TAIR-GO |
10 |
0.000 |
1 |
0.000 |
|
|
|
|
|
|
|
|
|
|
|
| hypersensitive response |
TAIR-GO |
10 |
0.000 |
1 |
0.003 |
|
|
|
|
|
|
|
|
|
|
|
| photosynthetic water oxidation |
TAIR-GO |
10 |
0.000 |
1 |
0.000 |
|
|
|
|
|
|
|
|
|
|
|
| proton transport |
TAIR-GO |
10 |
0.000 |
1 |
0.002 |
|
|
|
|
|
|
|
|
|
|
|
| response to bacteria |
TAIR-GO |
10 |
0.000 |
1 |
0.000 |
|
|
|
|
|
|
|
|
|
|
|
| response to chemical substance |
TAIR-GO |
10 |
0.000 |
1 |
0.000 |
|
|
|
|
|
|
|
|
|
|
|
| response to UV |
TAIR-GO |
10 |
0.000 |
1 |
0.015 |
|
|
|
|
|
|
|
|
|
|
|
| colanic acid building blocks biosynthesis |
AraCyc |
10 |
0.004 |
1 |
0.155 |
|
|
|
|
|
|
|
|
|
|
|
| dTDP-rhamnose biosynthesis |
AraCyc |
10 |
0.000 |
1 |
0.100 |
|
|
|
|
|
|
|
|
|
|
|
| galactose degradation I |
AraCyc |
10 |
0.000 |
1 |
0.003 |
|
|
|
|
|
|
|
|
|
|
|
| glucose and glucose-1-phosphate degradation |
AraCyc |
10 |
0.000 |
1 |
0.011 |
|
|
|
|
|
|
|
|
|
|
|
| glucose conversion |
AraCyc |
10 |
0.000 |
1 |
0.089 |
|
|
|
|
|
|
|
|
|
|
|
| glucosinolate biosynthesis from homomethionine |
AraCyc |
10 |
0.000 |
1 |
0.002 |
|
|
|
|
|
|
|
|
|
|
|
| lactose degradation IV |
AraCyc |
10 |
0.000 |
1 |
0.003 |
|
|
|
|
|
|
|
|
|
|
|
| peptidoglycan biosynthesis |
AraCyc |
10 |
0.000 |
1 |
0.004 |
|
|
|
|
|
|
|
|
|
|
|
| starch biosynthesis |
AraCyc |
10 |
0.000 |
1 |
0.000 |
|
|
|
|
|
|
|
|
|
|
|
| sucrose biosynthesis |
AraCyc |
10 |
0.000 |
1 |
0.025 |
|
|
|
|
|
|
|
|
|
|
|
| sucrose degradation III |
AraCyc |
10 |
0.000 |
1 |
0.016 |
|
|
|
|
|
|
|
|
|
|
|
|
|
|
|
|
|
|
|
|
|
|
|
|
|
|
|
|
|
|
|
|
|
|
|
|
|
|
|
|
|
|
|
|
|
| Pathways co-expressed in the Hormone etc. data set (with more than 10 annotation points) |
|
CYP71B17 / CYP71B16 (At3g26160 / At3g26150) |
|
|
|
|
|
|
|
|
| max. difference between log2-ratios: |
0.9 |
|
|
|
|
|
|
|
|
|
|
|
|
| max. difference between log2-ratios excluding lowest and highest 5%: |
0.0 |
|
|
|
|
|
|
|
|
|
|
|
|
| Pathway |
Source |
Scores of Genes |
p[Score] |
No. of Genes |
p[genes] |
Link to hormones etc. heatmap |
|
|
|
|
|
|
|
| Cell Wall Carbohydrate Metabolism |
BioPath |
96 |
0.000 |
33 |
0.000 |

|
|
|
|
|
|
| pectin metabolism |
BioPath |
64 |
0.000 |
26 |
0.000 |
|
|
|
|
|
| Intermediary Carbon Metabolism |
BioPath |
26 |
0.012 |
6 |
0.380 |
|
|
|
|
|
| nucleotide metabolism |
FunCat |
22 |
0.000 |
5 |
0.000 |
|
|
|
|
|
| mono-/sesqui-/di-terpene biosynthesis |
LitPath |
22 |
0.000 |
4 |
0.022 |
|
|
|
|
|
| terpenoid metabolism |
LitPath |
22 |
0.000 |
4 |
0.025 |
|
|
|
|
|
| (deoxy)ribose phosphate degradation |
AraCyc |
20 |
0.000 |
4 |
0.000 |
|
|
|
|
|
| biosynthesis of derivatives of homoisopentenyl pyrophosphate |
FunCat |
20 |
0.000 |
2 |
0.016 |
|
|
|
|
|
| pyrimidine nucleotide metabolism |
FunCat |
20 |
0.000 |
4 |
0.000 |
|
|
|
|
|
| Nucleotide Metabolism |
KEGG |
20 |
0.000 |
4 |
0.044 |
|
|
|
|
|
| Pyrimidine metabolism |
KEGG |
20 |
0.000 |
4 |
0.003 |
|
|
|
|
|
| Miscellaneous acyl lipid metabolism |
AcylLipid |
20 |
0.002 |
8 |
0.059 |
|
|
|
|
|
| Fatty acid elongation and wax and cutin metabolism |
AcylLipid |
19 |
0.000 |
6 |
0.004 |
|
|
|
|
|
| Flavonoid and anthocyanin metabolism |
BioPath |
18 |
0.000 |
4 |
0.054 |
|
|
|
|
|
|
|
|
|
|
|
| biogenesis of cell wall |
FunCat |
16 |
0.002 |
6 |
0.009 |
|
|
|
|
|
|
|
|
|
|
|
| Glycolysis / Gluconeogenesis |
KEGG |
16 |
0.002 |
4 |
0.047 |
|
|
|
|
|
|
|
|
|
|
|
| C-compound, carbohydrate catabolism |
FunCat |
14 |
0.000 |
3 |
0.064 |
|
|
|
|
|
|
|
|
|
|
|
| plant / fungal specific systemic sensing and response |
FunCat |
14 |
0.000 |
2 |
0.032 |
|
|
|
|
|
|
|
|
|
|
|
| plant hormonal regulation |
FunCat |
14 |
0.000 |
2 |
0.032 |
|
|
|
|
|
|
|
|
|
|
|
| transport |
FunCat |
14 |
0.000 |
4 |
0.000 |
|
|
|
|
|
|
|
|
|
|
|
| transport facilitation |
FunCat |
14 |
0.000 |
4 |
0.000 |
|
|
|
|
|
|
|
|
|
|
|
| Ligand-Receptor Interaction |
KEGG |
14 |
0.000 |
6 |
0.000 |
|
|
|
|
|
|
|
|
|
|
|
| Starch and sucrose metabolism |
KEGG |
14 |
0.017 |
5 |
0.012 |
|
|
|
|
|
|
|
|
|
|
|
| Nitrogen metabolism |
KEGG |
13 |
0.000 |
2 |
0.048 |
|
|
|
|
|
|
|
|
|
|
|
| abscisic acid biosynthesis |
AraCyc |
12 |
0.000 |
2 |
0.000 |
|
|
|
|
|
|
|
|
|
|
|
| acetate fermentation |
AraCyc |
12 |
0.002 |
3 |
0.046 |
|
|
|
|
|
|
|
|
|
|
|
| fructose degradation (anaerobic) |
AraCyc |
12 |
0.001 |
3 |
0.036 |
|
|
|
|
|
|
|
|
|
|
|
| glycerol degradation II |
AraCyc |
12 |
0.000 |
3 |
0.012 |
|
|
|
|
|
|
|
|
|
|
|
| glycolysis IV |
AraCyc |
12 |
0.001 |
3 |
0.038 |
|
|
|
|
|
|
|
|
|
|
|
| mixed acid fermentation |
AraCyc |
12 |
0.000 |
3 |
0.005 |
|
|
|
|
|
|
|
|
|
|
|
| non-phosphorylated glucose degradation |
AraCyc |
12 |
0.000 |
3 |
0.004 |
|
|
|
|
|
|
|
|
|
|
|
| sorbitol fermentation |
AraCyc |
12 |
0.002 |
3 |
0.042 |
|
|
|
|
|
|
|
|
|
|
|
| TCA cycle -- aerobic respiration |
AraCyc |
12 |
0.000 |
2 |
0.067 |
|
|
|
|
|
|
|
|
|
|
|
| TCA cycle variation IV |
AraCyc |
12 |
0.000 |
2 |
0.060 |
|
|
|
|
|
|
|
|
|
|
|
| TCA cycle variation VII |
AraCyc |
12 |
0.009 |
2 |
0.164 |
|
|
|
|
|
|
|
|
|
|
|
| TCA cycle variation VIII |
AraCyc |
12 |
0.000 |
2 |
0.074 |
|
|
|
|
|
|
|
|
|
|
|
| Carbon fixation |
KEGG |
12 |
0.021 |
3 |
0.085 |
|
|
|
|
|
|
|
|
|
|
|
| Citrate cycle (TCA cycle) |
KEGG |
12 |
0.000 |
2 |
0.087 |
|
|
|
|
|
|
|
|
|
|
|
| Ion channels |
KEGG |
12 |
0.000 |
5 |
0.001 |
|
|
|
|
|
|
|
|
|
|
|
| Purine metabolism |
KEGG |
12 |
0.007 |
3 |
0.067 |
|
|
|
|
|
|
|
|
|
|
|
| abscisic acid biosynthesis |
LitPath |
12 |
0.000 |
2 |
0.007 |
|
|
|
|
|
|
|
|
|
|
|
| Carotenoid and abscisic acid metabolism |
LitPath |
12 |
0.005 |
2 |
0.101 |
|
|
|
|
|
|
|
|
|
|
|
| flavonoid biosynthesis |
AraCyc |
11 |
0.000 |
3 |
0.002 |
|
|
|
|
|
|
|
|
|
|
|
| C-compound, carbohydrate anabolism |
FunCat |
11 |
0.000 |
3 |
0.005 |
|
|
|
|
|
|
|
|
|
|
|
| cellulose biosynthesis |
BioPath |
10 |
0.016 |
3 |
0.087 |
|
|
|
|
|
|
|
|
|
|
|
| gibberellic acid biosynthesis |
TAIR-GO |
10 |
0.000 |
1 |
0.007 |
|
|
|
|
|
|
|
|
|
|
|
| gibberellic acid mediated signaling |
TAIR-GO |
10 |
0.000 |
1 |
0.001 |
|
|
|
|
|
|
|
|
|
|
|
| glucosinolate biosynthesis |
TAIR-GO |
10 |
0.000 |
1 |
0.004 |
|
|
|
|
|
|
|
|
|
|
|
| monoterpenoid biosynthesis |
TAIR-GO |
10 |
0.000 |
1 |
0.001 |
|
|
|
|
|
|
|
|
|
|
|
| oxygen binding |
TAIR-GO |
10 |
0.000 |
1 |
0.000 |
|
|
|
|
|
|
|
|
|
|
|
|
|
|
|
|
|
|
|
|
|
|
|
|
|
|
|
|
|
|
|
|
|
|
|
|
|
|
|
|
|
|
|
|
|
|
|
|
|
|
|
|
|
|
|
|
|
|
|
|
|
|
| Pathways co-expressed in the Mutant data set (with more than 10 annotation points) |
|
CYP71B17 / CYP71B16 (At3g26160 / At3g26150) |
|
|
|
|
|
|
|
|
| max. difference between log2-ratios: |
3.1 |
|
|
|
|
|
|
|
|
|
|
|
|
| max. difference between log2-ratios excluding lowest and highest 5%: |
0.0 |
|
|
|
|
|
|
|
|
|
|
|
|
| Pathway |
Source |
Scores of Genes |
p[Score] |
No. of Genes |
p[genes] |
Link to mutants heatmap |
|
|
|
|
|
|
|
| Cell Wall Carbohydrate Metabolism |
BioPath |
301.5 |
0.000 |
81 |
0.000 |
|
|
|
|
| C-compound and carbohydrate metabolism |
FunCat |
161 |
0.000 |
40 |
0.014 |
|
|
|
| Phenylpropanoid Metabolism |
BioPath |
119 |
0.022 |
24 |
0.341 |
|
|
|
| pectin metabolism |
BioPath |
118.5 |
0.000 |
50 |
0.000 |
|
|
|
| Lipid signaling |
AcylLipid |
73 |
0.004 |
15 |
0.334 |
|
|
|
| Isoprenoid Biosynthesis in the Cytosol and in Mitochondria |
BioPath |
72 |
0.000 |
12 |
0.066 |
|
|
|
| mono-/sesqui-/di-terpene biosynthesis |
LitPath |
72 |
0.000 |
12 |
0.001 |
|
|
|
| terpenoid metabolism |
LitPath |
72 |
0.000 |
12 |
0.001 |
|
|
|
| triterpene, sterol, and brassinosteroid metabolism |
LitPath |
71 |
0.013 |
15 |
0.086 |
|
|
|
| Starch and sucrose metabolism |
KEGG |
69 |
0.000 |
14 |
0.006 |
|
|
|
| cellulose biosynthesis |
BioPath |
66 |
0.000 |
11 |
0.012 |
|
|
|
| Nucleotide Metabolism |
KEGG |
65 |
0.000 |
13 |
0.016 |
|
|
|
| transport |
FunCat |
60 |
0.000 |
15 |
0.000 |
|
|
|
| Purine metabolism |
KEGG |
53 |
0.000 |
10 |
0.032 |
|
|
|
|
|
|
|
|
|
|
|
| Pyruvate metabolism |
KEGG |
53 |
0.000 |
9 |
0.173 |
|
|
|
|
|
|
|
|
|
|
|
| Biosynthesis of prenyl diphosphates |
BioPath |
50 |
0.001 |
8 |
0.119 |
|
|
|
|
|
|
|
|
|
|
|
| lipases pathway |
AraCyc |
47 |
0.000 |
7 |
0.004 |
|
|
|
|
|
|
|
|
|
|
|
| Biosynthesis of steroids |
KEGG |
47 |
0.000 |
8 |
0.034 |
|
|
|
|
|
|
|
|
|
|
|
| transport facilitation |
FunCat |
46 |
0.000 |
13 |
0.000 |
|
|
|
|
|
|
|
|
|
|
|
| biogenesis of cell wall |
FunCat |
44 |
0.000 |
15 |
0.001 |
|
|
|
|
|
|
|
|
|
|
|
| lactose degradation IV |
AraCyc |
43 |
0.000 |
10 |
0.000 |
|
|
|
|
|
|
|
|
|
|
|
| Translation factors |
KEGG |
41 |
0.001 |
15 |
0.009 |
|
|
|
|
|
|
|
|
|
|
|
| Flavonoid and anthocyanin metabolism |
BioPath |
39 |
0.000 |
11 |
0.052 |
|
|
|
|
|
|
|
|
|
|
|
| starch metabolism |
BioPath |
37 |
0.000 |
5 |
0.199 |
|
|
|
|
|
|
|
|
|
|
|
| acetate fermentation |
AraCyc |
36 |
0.024 |
10 |
0.101 |
|
|
|
|
|
|
|
|
|
|
|
| trans-zeatin biosynthesis |
AraCyc |
36 |
0.000 |
7 |
0.000 |
|
|
|
|
|
|
|
|
|
|
|
| Citrate cycle (TCA cycle) |
KEGG |
36 |
0.000 |
6 |
0.106 |
|
|
|
|
|
|
|
|
|
|
|
| Phenylalanine, tyrosine and tryptophan biosynthesis |
KEGG |
36 |
0.001 |
4 |
0.428 |
|
|
|
|
|
|
|
|
|
|
|
| cellulose biosynthesis |
AraCyc |
34 |
0.001 |
6 |
0.180 |
|
|
|
|
|
|
|
|
|
|
|
| fructose degradation (anaerobic) |
AraCyc |
34 |
0.026 |
10 |
0.065 |
|
|
|
|
|
|
|
|
|
|
|
| glycolysis IV |
AraCyc |
34 |
0.029 |
10 |
0.071 |
|
|
|
|
|
|
|
|
|
|
|
| TCA cycle -- aerobic respiration |
AraCyc |
34 |
0.002 |
8 |
0.056 |
|
|
|
|
|
|
|
|
|
|
|
| TCA cycle variation IV |
AraCyc |
34 |
0.001 |
8 |
0.044 |
|
|
|
|
|
|
|
|
|
|
|
| TCA cycle variation VIII |
AraCyc |
34 |
0.007 |
8 |
0.069 |
|
|
|
|
|
|
|
|
|
|
|
| C-compound, carbohydrate catabolism |
FunCat |
34 |
0.000 |
9 |
0.012 |
|
|
|
|
|
|
|
|
|
|
|
| nucleotide metabolism |
FunCat |
34 |
0.000 |
7 |
0.000 |
|
|
|
|
|
|
|
|
|
|
|
| Pyrimidine metabolism |
KEGG |
34 |
0.000 |
8 |
0.014 |
|
|
|
|
|
|
|
|
|
|
|
| Fatty acid elongation and wax and cutin metabolism |
AcylLipid |
34 |
0.050 |
8 |
0.194 |
|
|
|
|
|
|
|
|
|
|
|
| lipid, fatty acid and isoprenoid degradation |
FunCat |
33 |
0.000 |
4 |
0.176 |
|
|
|
|
|
|
|
|
|
|
|
| brassinosteroid biosynthesis |
LitPath |
33 |
0.030 |
4 |
0.281 |
|
|
|
|
|
|
|
|
|
|
|
| intracellular signalling |
FunCat |
32.5 |
0.001 |
8 |
0.154 |
|
|
|
|
|
|
|
|
|
|
|
| triacylglycerol degradation |
AraCyc |
32 |
0.000 |
15 |
0.000 |
|
|
|
|
|
|
|
|
|
|
|
| secondary metabolism |
FunCat |
32 |
0.023 |
10 |
0.065 |
|
|
|
|
|
|
|
|
|
|
|
| aromatic amino acid family biosynthesis |
TAIR-GO |
30 |
0.000 |
3 |
0.008 |
|
|
|
|
|
|
|
|
|
|
|
| dTDP-rhamnose biosynthesis |
AraCyc |
30 |
0.000 |
6 |
0.165 |
|
|
|
|
|
|
|
|
|
|
|
| transcription |
FunCat |
30 |
0.000 |
8 |
0.000 |
|
|
|
|
|
|
|
|
|
|
|
| galactose degradation I |
AraCyc |
29 |
0.000 |
6 |
0.000 |
|
|
|
|
|
|
|
|
|
|
|
| Protein export |
KEGG |
29 |
0.000 |
8 |
0.001 |
|
|
|
|
|
|
|
|
|
|
|
| hemicellulose biosynthesis |
BioPath |
28 |
0.000 |
3 |
0.153 |
|
|
|
|
|
|
|
|
|
|
|
| energy |
FunCat |
28 |
0.000 |
6 |
0.000 |
|
|
|
|
|
|
|
|
|
|
|
|
|
|
|
|
|
|
|
|
|
|
|
|
|
|
|
|