|
|
|
|
|
|
|
|
|
|
|
|
|
|
|
|
|
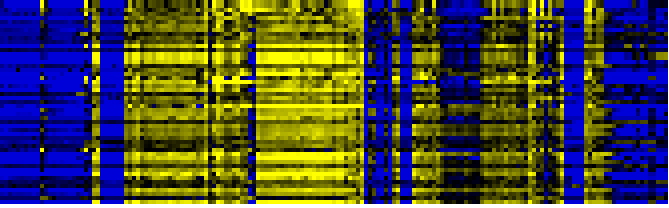
| Pathways co-expressed in the Organ and Tissue data set (with more than 10 annotation points) |
|
CYP71B19 / CYP71B20 (At3g26170 / At3g26180) |
|
|
|
|
|
|
|
|
| max. difference between log2-ratios: |
6.7 |
|
|
|
|
|
|
|
|
|
|
|
|
| max. difference between log2-ratios excluding lowest and highest 5%: |
5.7 |
|
|
|
|
|
|
|
|
|
|
|
|
| Pathway |
Source |
Scores of Genes |
p[Score] |
No. of Genes |
p[genes] |
Link to organ heatmap |
|
|
|
|
|
|
|
| Photosystems |
BioPath |
372 |
0.000 |
55 |
0.000 |
|
|
|
| Plastidial Isoprenoids (Chlorophylls, Carotenoids, Tocopherols, Plastoquinone, Phylloquinone) |
BioPath |
188 |
0.000 |
22 |
0.000 |
|
|
| additional photosystem II components |
BioPath |
155 |
0.000 |
21 |
0.000 |
|
|
| biogenesis of chloroplast |
FunCat |
151 |
0.000 |
25 |
0.000 |
|
|
| Photosynthesis |
KEGG |
145 |
0.000 |
24 |
0.000 |
|
|
| photosynthesis |
FunCat |
142 |
0.000 |
21 |
0.000 |
|
|
| Photosystem I |
BioPath |
131 |
0.000 |
22 |
0.000 |
|
|
| Chlorophyll a/b binding proteins |
BioPath |
122 |
0.000 |
15 |
0.000 |
|
|
| glycolysis and gluconeogenesis |
FunCat |
99 |
0.000 |
15 |
0.020 |
|
|
| transport |
FunCat |
99 |
0.000 |
16 |
0.000 |
|
|
| Carbon fixation |
KEGG |
96 |
0.000 |
13 |
0.000 |
|
|
| photosystem I |
TAIR-GO |
84 |
0.000 |
10 |
0.000 |
|
|
| Chlorophyll biosynthesis and breakdown |
BioPath |
83 |
0.000 |
9 |
0.005 |
|
|
| chlorophyll and phytochromobilin metabolism |
LitPath |
83 |
0.000 |
9 |
0.000 |
|
|
|
|
|
|
|
|
|
|
|
| Photosystem II |
BioPath |
73 |
0.000 |
10 |
0.006 |
|
|
|
|
|
|
|
|
|
|
|
| Porphyrin and chlorophyll metabolism |
KEGG |
73 |
0.000 |
9 |
0.000 |
|
|
|
|
|
|
|
|
|
|
|
| Biosynthesis of steroids |
KEGG |
63 |
0.000 |
8 |
0.000 |
|
|
|
|
|
|
|
|
|
|
|
| Pathway for nuclear-encoded, thylakoid-localized proteins |
BioPath |
62 |
0.000 |
8 |
0.000 |
|
|
|
|
|
|
|
|
|
|
|
| photosystem II |
TAIR-GO |
61 |
0.000 |
7 |
0.000 |
|
|
|
|
|
|
|
|
|
|
|
| chlorophyll binding |
TAIR-GO |
60 |
0.000 |
7 |
0.000 |
|
|
|
|
|
|
|
|
|
|
|
| chlorophyll biosynthesis |
TAIR-GO |
59 |
0.000 |
6 |
0.000 |
|
|
|
|
|
|
|
|
|
|
|
| Folding, Sorting and Degradation |
KEGG |
58 |
0.000 |
8 |
0.095 |
|
|
|
|
|
|
|
|
|
|
|
| gluconeogenesis |
AraCyc |
57 |
0.000 |
8 |
0.008 |
|
|
|
|
|
|
|
|
|
|
|
| acetate fermentation |
AraCyc |
56 |
0.000 |
10 |
0.019 |
|
|
|
|
|
|
|
|
|
|
|
| Calvin cycle |
AraCyc |
56 |
0.000 |
8 |
0.003 |
|
|
|
|
|
|
|
|
|
|
|
| photorespiration |
AraCyc |
56 |
0.000 |
13 |
0.000 |
|
|
|
|
|
|
|
|
|
|
|
| fructose degradation (anaerobic) |
AraCyc |
52 |
0.000 |
9 |
0.028 |
|
|
|
|
|
|
|
|
|
|
|
| glycolysis IV |
AraCyc |
52 |
0.000 |
9 |
0.030 |
|
|
|
|
|
|
|
|
|
|
|
| sorbitol fermentation |
AraCyc |
52 |
0.000 |
9 |
0.037 |
|
|
|
|
|
|
|
|
|
|
|
| chlorophyll biosynthesis |
AraCyc |
50 |
0.000 |
6 |
0.122 |
|
|
|
|
|
|
|
|
|
|
|
| transport facilitation |
FunCat |
50 |
0.000 |
8 |
0.000 |
|
|
|
|
|
|
|
|
|
|
|
| Carotenoid and abscisic acid metabolism |
LitPath |
50 |
0.000 |
6 |
0.001 |
|
|
|
|
|
|
|
|
|
|
|
| chlorophyll biosynthesis |
LitPath |
49 |
0.000 |
5 |
0.000 |
|
|
|
|
|
|
|
|
|
|
|
| light harvesting complex |
BioPath |
48 |
0.000 |
6 |
0.000 |
|
|
|
|
|
|
|
|
|
|
|
| Protein export |
KEGG |
45 |
0.000 |
6 |
0.000 |
|
|
|
|
|
|
|
|
|
|
|
| Carotenoid biosynthesis |
BioPath |
44 |
0.000 |
5 |
0.001 |
|
|
|
|
|
|
|
|
|
|
|
| photosynthesis |
TAIR-GO |
44 |
0.000 |
6 |
0.003 |
|
|
|
|
|
|
|
|
|
|
|
| carotenoid biosynthesis |
AraCyc |
44 |
0.000 |
5 |
0.000 |
|
|
|
|
|
|
|
|
|
|
|
| energy |
FunCat |
44 |
0.000 |
6 |
0.000 |
|
|
|
|
|
|
|
|
|
|
|
| respiration |
FunCat |
44 |
0.000 |
6 |
0.000 |
|
|
|
|
|
|
|
|
|
|
|
| Glycolysis / Gluconeogenesis |
KEGG |
44 |
0.000 |
7 |
0.041 |
|
|
|
|
|
|
|
|
|
|
|
| carotenid biosynthesis |
LitPath |
44 |
0.000 |
5 |
0.000 |
|
|
|
|
|
|
|
|
|
|
|
| Pentose phosphate pathway |
KEGG |
42 |
0.000 |
6 |
0.004 |
|
|
|
|
|
|
|
|
|
|
|
| Miscellaneous acyl lipid metabolism |
AcylLipid |
42 |
0.000 |
8 |
0.105 |
|
|
|
|
|
|
|
|
|
|
|
| Chloroplastic protein turnover |
BioPath |
40 |
0.000 |
7 |
0.000 |
|
|
|
|
|
|
|
|
|
|
|
| aerobic respiration |
FunCat |
40 |
0.000 |
5 |
0.001 |
|
|
|
|
|
|
|
|
|
|
|
| hypersensitive response |
TAIR-GO |
38 |
0.000 |
4 |
0.000 |
|
|
|
|
|
|
|
|
|
|
|
| glycine biosynthesis I |
AraCyc |
38 |
0.000 |
9 |
0.002 |
|
|
|
|
|
|
|
|
|
|
|
| superpathway of serine and glycine biosynthesis II |
AraCyc |
38 |
0.000 |
9 |
0.000 |
|
|
|
|
|
|
|
|
|
|
|
| calmodulin binding |
TAIR-GO |
37 |
0.000 |
5 |
0.001 |
|
|
|
|
|
|
|
|
|
|
|
| chloroplast thylakoid membrane protein import |
TAIR-GO |
37 |
0.000 |
4 |
0.000 |
|
|
|
|
|
|
|
|
|
|
|
|
|
|
|
|
|
|
|
|
|
|
|
|
|
|
|
|
|
|
|
|
|
|
|
|
|
|
|
|
|
|
|
|
|
| Pathways co-expressed in the Hormone etc. data set (with more than 10 annotation points) |
|
CYP71B19 / CYP71B20 (At3g26170 / At3g26180) |
|
|
|
|
|
|
|
|
| max. difference between log2-ratios: |
2.3 |
|
|
|
|
|
|
|
|
|
|
|
|
| max. difference between log2-ratios excluding lowest and highest 5%: |
1.5 |
|
|
|
|
|
|
|
|
|
|
|
|
| Pathway |
Source |
Scores of Genes |
p[Score] |
No. of Genes |
p[genes] |
Link to hormones etc. heatmap |
|
|
|
|
|
|
|
| Valine, leucine and isoleucine degradation |
KEGG |
16 |
0.000 |
3 |
0.000 |

|
|
|
|
|
|
| metabolism of acyl-lipids in mitochondria |
AcylLipid |
14 |
0.000 |
2 |
0.000 |
|
|
|
|
|
| amino acid metabolism |
FunCat |
12 |
0.000 |
2 |
0.004 |
|
|
|
|
|
| lipid, fatty acid and isoprenoid metabolism |
FunCat |
12 |
0.000 |
2 |
0.000 |
|
|
|
|
|
|
|
|
|
|
|
| Benzoate degradation via CoA ligation |
KEGG |
12 |
0.000 |
2 |
0.002 |
|
|
|
|
|
|
|
|
|
|
|
| fatty acid beta oxidation complex |
BioPath |
10 |
0.000 |
1 |
0.000 |
|
|
|
|
|
|
|
|
|
|
|
| Gluconeogenesis from lipids in seeds |
BioPath |
10 |
0.000 |
1 |
0.002 |
|
|
|
|
|
|
|
|
|
|
|
| development |
TAIR-GO |
10 |
0.000 |
1 |
0.003 |
|
|
|
|
|
|
|
|
|
|
|
| embryonic development |
TAIR-GO |
10 |
0.000 |
1 |
0.001 |
|
|
|
|
|
|
|
|
|
|
|
| embryonic development (sensu Magnoliophyta) |
TAIR-GO |
10 |
0.000 |
1 |
0.000 |
|
|
|
|
|
|
|
|
|
|
|
| fatty acid beta-oxidation |
TAIR-GO |
10 |
0.000 |
1 |
0.000 |
|
|
|
|
|
|
|
|
|
|
|
| leucine catabolism |
TAIR-GO |
10 |
0.000 |
1 |
0.000 |
|
|
|
|
|
|
|
|
|
|
|
| leucine degradation I |
AraCyc |
10 |
0.000 |
1 |
0.000 |
|
|
|
|
|
|
|
|
|
|
|
| leucine degradation II |
AraCyc |
10 |
0.000 |
1 |
0.000 |
|
|
|
|
|
|
|
|
|
|
|
| Fatty acid metabolism |
KEGG |
10 |
0.000 |
1 |
0.005 |
|
|
|
|
|
|
|
|
|
|
|
| Lysine degradation |
KEGG |
10 |
0.000 |
1 |
0.002 |
|
|
|
|
|
|
|
|
|
|
|
| Tryptophan metabolism |
KEGG |
10 |
0.000 |
1 |
0.005 |
|
|
|
|
|
|
|
|
|
|
|
| Degradation of storage lipids and straight fatty acids |
AcylLipid |
10 |
0.000 |
1 |
0.031 |
|
|
|
|
|
|
|
|
|
|
|
|
|
|
|
|
|
|
|
|
|
|
|
|
|
|
|
|