|
|
|
|
|
|
|
|
|
|
|
|
|
|
|
|
|
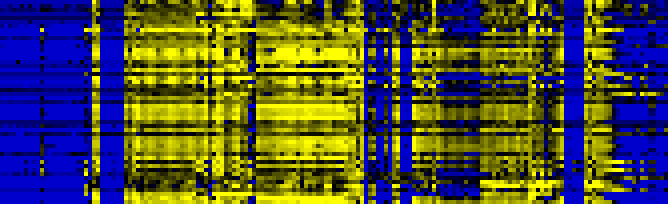
| Pathways co-expressed in the Organ and Tissue data set (with more than 20 annotation points) |
|
CYP71B26 (At3g26290) |
|
|
|
|
|
|
|
|
| max. difference between log2-ratios: |
5.9 |
|
|
|
|
|
|
|
|
|
|
|
|
| max. difference between log2-ratios excluding lowest and highest 5%: |
5.0 |
|
|
|
|
|
|
|
|
|
|
|
|
| Pathway |
Source |
Scores of Genes |
p[Score] |
No. of Genes |
p[genes] |
Link to organ heatmap |
|
|
|
|
|
|
|
| Photosystems |
BioPath |
257 |
0.000 |
37 |
0.000 |
|
|
|
| Photosystem I |
BioPath |
117 |
0.000 |
20 |
0.000 |
|
|
| Photosynthesis |
KEGG |
115 |
0.000 |
18 |
0.000 |
|
|
| Chlorophyll a/b binding proteins |
BioPath |
104 |
0.000 |
13 |
0.000 |
|
|
| additional photosystem II components |
BioPath |
100 |
0.000 |
12 |
0.000 |
|
|
| biogenesis of chloroplast |
FunCat |
86 |
0.000 |
12 |
0.000 |
|
|
| photosynthesis |
FunCat |
73 |
0.000 |
10 |
0.000 |
|
|
| photosystem I |
TAIR-GO |
67 |
0.000 |
8 |
0.000 |
|
|
| transport |
FunCat |
64 |
0.000 |
10 |
0.000 |
|
|
| Photosystem II |
BioPath |
59 |
0.000 |
8 |
0.000 |
|
|
| chlorophyll binding |
TAIR-GO |
52 |
0.000 |
6 |
0.000 |
|
|
| photosystem II |
TAIR-GO |
51 |
0.000 |
6 |
0.000 |
|
|
| Carbon fixation |
KEGG |
51 |
0.000 |
6 |
0.000 |
|
|
| respiration |
FunCat |
44 |
0.000 |
6 |
0.000 |
|
|
|
|
|
|
|
|
|
|
|
| aerobic respiration |
FunCat |
40 |
0.000 |
5 |
0.000 |
|
|
|
|
|
|
|
|
|
|
|
| photosystem II type I chlorophyll a /b binding protein |
BioPath |
36 |
0.000 |
4 |
0.000 |
|
|
|
|
|
|
|
|
|
|
|
| energy |
FunCat |
34 |
0.000 |
4 |
0.000 |
|
|
|
|
|
|
|
|
|
|
|
| photosystem I reaction center |
BioPath |
32 |
0.000 |
7 |
0.000 |
|
|
|
|
|
|
|
|
|
|
|
| light harvesting complex |
BioPath |
30 |
0.000 |
4 |
0.000 |
|
|
|
|
|
|
|
|
|
|
|
| photosynthesis |
TAIR-GO |
30 |
0.000 |
4 |
0.004 |
|
|
|
|
|
|
|
|
|
|
|
| photorespiration |
TAIR-GO |
28 |
0.000 |
4 |
0.000 |
|
|
|
|
|
|
|
|
|
|
|
| photorespiration |
AraCyc |
28 |
0.000 |
4 |
0.003 |
|
|
|
|
|
|
|
|
|
|
|
| photosystem I subunit precursor |
BioPath |
26 |
0.000 |
5 |
0.000 |
|
|
|
|
|
|
|
|
|
|
|
| Calvin cycle |
AraCyc |
26 |
0.000 |
3 |
0.028 |
|
|
|
|
|
|
|
|
|
|
|
| gluconeogenesis |
AraCyc |
26 |
0.000 |
3 |
0.048 |
|
|
|
|
|
|
|
|
|
|
|
| transport facilitation |
FunCat |
26 |
0.000 |
4 |
0.000 |
|
|
|
|
|
|
|
|
|
|
|
| assimilation of ammonia, metabolism of the glutamate group |
FunCat |
24 |
0.000 |
3 |
0.006 |
|
|
|
|
|
|
|
|
|
|
|
| electron transport and membrane-associated energy conservation |
FunCat |
24 |
0.000 |
3 |
0.000 |
|
|
|
|
|
|
|
|
|
|
|
| Biosynthesis of steroids |
KEGG |
24 |
0.000 |
3 |
0.012 |
|
|
|
|
|
|
|
|
|
|
|
| Nitrogen metabolism |
KEGG |
23 |
0.000 |
3 |
0.003 |
|
|
|
|
|
|
|
|
|
|
|
|
|
|
|
|
|
|
|
|
|
|
|
|
|
|
|
|
|
|
|
|
|
|
|
|
|
|
|
|
|
|
|
|
|
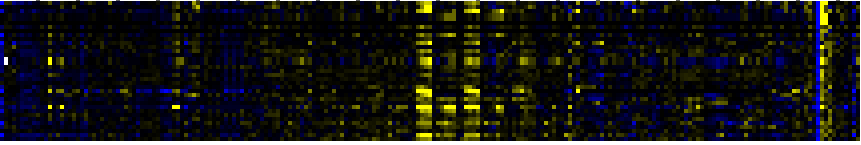
| Pathways co-expressed in the Stress data set ( with more than 10 annotation points) |
|
CYP71B26 (At3g26290) |
|
|
|
|
|
|
|
|
| max. difference between log2-ratios: |
11.3 |
|
|
|
|
|
|
|
|
|
|
|
|
| max. difference between log2-ratios excluding lowest and highest 5%: |
2.5 |
|
|
|
|
|
|
|
|
|
|
|
|
| Pathway |
Source |
Scores of Genes |
p[Score] |
No. of Genes |
p[genes] |
Link to stress heatmap |
|
|
|
|
|
|
|
| Cell Wall Carbohydrate Metabolism |
BioPath |
22 |
0.018 |
3 |
0.358 |
|
| C-compound and carbohydrate utilization |
FunCat |
20 |
0.000 |
2 |
0.000 |
| Phenylpropanoid Metabolism |
BioPath |
18 |
0.003 |
2 |
0.201 |
| indoleacetic acid biosynthesis |
TAIR-GO |
18 |
0.000 |
2 |
0.000 |
| IAA biosynthesis |
AraCyc |
18 |
0.000 |
2 |
0.000 |
| IAA biosynthesis I |
AraCyc |
18 |
0.000 |
2 |
0.000 |
| plant / fungal specific systemic sensing and response |
FunCat |
18 |
0.000 |
2 |
0.000 |
| plant hormonal regulation |
FunCat |
18 |
0.000 |
2 |
0.000 |
| Bile acid biosynthesis |
KEGG |
17 |
0.000 |
2 |
0.000 |
| Fatty acid metabolism |
KEGG |
17 |
0.000 |
2 |
0.003 |
|
|
|
|
|
|
|
|
|
|
|
| Glycerolipid metabolism |
KEGG |
17 |
0.000 |
2 |
0.003 |
|
|
|
|
|
|
|
|
|
|
|
| Glycolysis / Gluconeogenesis |
KEGG |
17 |
0.000 |
2 |
0.029 |
|
|
|
|
|
|
|
|
|
|
|
| Pyruvate metabolism |
KEGG |
17 |
0.000 |
2 |
0.024 |
|
|
|
|
|
|
|
|
|
|
|
| Tryptophan metabolism |
KEGG |
17 |
0.000 |
2 |
0.003 |
|
|
|
|
|
|
|
|
|
|
|
| vitamin E biosynthesis |
AraCyc |
14 |
0.000 |
2 |
0.000 |
|
|
|
|
|
|
|
|
|
|
|
| ascorbic acid biosynthesis |
BioPath |
12 |
0.000 |
2 |
0.001 |
|
|
|
|
|
|
|
|
|
|
|
| secondary metabolism |
FunCat |
12 |
0.000 |
2 |
0.008 |
|
|
|
|
|
|
|
|
|
|
|
| Fatty acid elongation and wax and cutin metabolism |
AcylLipid |
12 |
0.000 |
2 |
0.053 |
|
|
|
|
|
|
|
|
|
|
|
| Gluconeogenesis from lipids in seeds |
BioPath |
11 |
0.000 |
2 |
0.022 |
|
|
|
|
|
|
|
|
|
|
|
| Tyrosine metabolism |
KEGG |
11 |
0.000 |
2 |
0.005 |
|
|
|
|
|
|
|
|
|
|
|
|
|
|
|
|
|
|
|
|
|
|
|
|
|
|
|
|
|
|
|
|
|
|
|
|
|
|
|
|
|
|
|
|
|
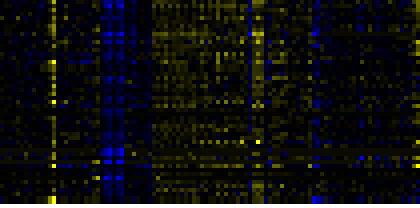
| Pathways co-expressed in the Hormone etc. data set (with more than 14 annotation points) |
|
CYP71B26 (At3g26290) |
|
|
|
|
|
|
|
|
| max. difference between log2-ratios: |
3.7 |
|
|
|
|
|
|
|
|
|
|
|
|
| max. difference between log2-ratios excluding lowest and highest 5%: |
1.8 |
|
|
|
|
|
|
|
|
|
|
|
|
| Pathway |
Source |
Scores of Genes |
p[Score] |
No. of Genes |
p[genes] |
Link to hormones etc. heatmap |
|
|
|
|
|
|
|
| beta-Alanine metabolism |
KEGG |
31 |
0.000 |
6 |
0.000 |
|
|
|
|
|
|
| Biosynthesis of Amino Acids and Derivatives |
BioPath |
30 |
0.000 |
3 |
0.075 |
|
|
|
|
|
| Stilbene, coumarine and lignin biosynthesis |
KEGG |
30 |
0.000 |
3 |
0.179 |
|
|
|
|
|
| Plastidial Isoprenoids (Chlorophylls, Carotenoids, Tocopherols, Plastoquinone, Phylloquinone) |
BioPath |
25 |
0.000 |
3 |
0.008 |
|
|
|
|
|
| lignin biosynthesis |
AraCyc |
24 |
0.000 |
4 |
0.001 |
|
|
|
|
|
| Glutathione metabolism |
KEGG |
24 |
0.000 |
3 |
0.014 |
|
|
|
|
|
| Miscellaneous acyl lipid metabolism |
AcylLipid |
24 |
0.000 |
6 |
0.005 |
|
|
|
|
|
| Phenylpropanoid pathway |
LitPath |
24 |
0.000 |
4 |
0.016 |
|
|
|
|
|
| Urea cycle and metabolism of amino groups |
KEGG |
22 |
0.000 |
3 |
0.002 |
|
|
|
|
|
| Phenylpropanoid Metabolism |
BioPath |
20 |
0.030 |
2 |
0.236 |
|
|
|
|
|
| Prolin/Hydroxyproline from glutamate |
BioPath |
20 |
0.000 |
2 |
0.000 |
|
|
|
|
|
| hyperosmotic salinity response |
TAIR-GO |
20 |
0.000 |
2 |
0.000 |
|
|
|
|
|
| proline biosynthesis |
TAIR-GO |
20 |
0.000 |
2 |
0.000 |
|
|
|
|
|
| response to abscisic acid stimulus |
TAIR-GO |
20 |
0.000 |
2 |
0.001 |
|
|
|
|
|
|
|
|
|
|
|
| phenylalanine degradation I |
AraCyc |
20 |
0.000 |
4 |
0.000 |
|
|
|
|
|
|
|
|
|
|
|
| tyrosine degradation |
AraCyc |
20 |
0.000 |
4 |
0.000 |
|
|
|
|
|
|
|
|
|
|
|
| biogenesis of cell wall |
FunCat |
20 |
0.000 |
2 |
0.021 |
|
|
|
|
|
|
|
|
|
|
|
| C-compound and carbohydrate utilization |
FunCat |
20 |
0.000 |
2 |
0.000 |
|
|
|
|
|
|
|
|
|
|
|
| secondary metabolism |
FunCat |
20 |
0.000 |
2 |
0.017 |
|
|
|
|
|
|
|
|
|
|
|
| Tyrosine metabolism |
KEGG |
20 |
0.000 |
4 |
0.002 |
|
|
|
|
|
|
|
|
|
|
|
| Intermediary Carbon Metabolism |
BioPath |
18 |
0.020 |
2 |
0.197 |
|
|
|
|
|
|
|
|
|
|
|
| response to water deprivation |
TAIR-GO |
18 |
0.000 |
2 |
0.000 |
|
|
|
|
|
|
|
|
|
|
|
| Fatty acid metabolism |
KEGG |
18 |
0.000 |
3 |
0.006 |
|
|
|
|
|
|
|
|
|
|
|
| Glycerolipid metabolism |
KEGG |
16 |
0.000 |
3 |
0.006 |
|
|
|
|
|
|
|
|
|
|
|
| Pyruvate metabolism |
KEGG |
16 |
0.030 |
3 |
0.076 |
|
|
|
|
|
|
|
|
|
|
|
| Nucleotide Metabolism |
KEGG |
15 |
0.021 |
2 |
0.241 |
|
|
|
|
|
|
|
|
|
|
|
| Pantothenate and CoA biosynthesis |
KEGG |
15 |
0.000 |
2 |
0.009 |
|
|
|
|
|
|
|
|
|
|
|
| Pyrimidine metabolism |
KEGG |
15 |
0.000 |
2 |
0.059 |
|
|
|
|
|
|
|
|
|
|
|
|
|
|
|
|
|
|
|
|
|
|
|
|
|
|
|
|
|
|
|
|
|
|
|
|
|
|
|
|
|
|
|
|
|
|
|
|
|
|
|
|
|
|
|
|
|
|
|
|
|
|
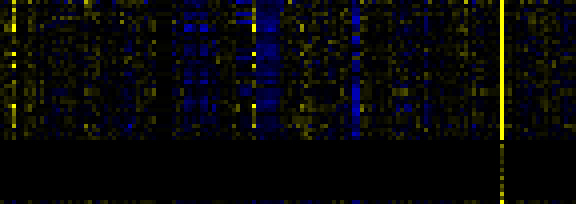
| Pathways co-expressed in the Mutant data set (with more than 30 annotation points) |
|
CYP71B26 (At3g26290) |
|
|
|
|
|
|
|
|
| max. difference between log2-ratios: |
8.7 |
|
|
|
|
|
|
|
|
|
|
|
|
| max. difference between log2-ratios excluding lowest and highest 5%: |
2.2 |
|
|
|
|
|
|
|
|
|
|
|
|
| Pathway |
Source |
Scores of Genes |
p[Score] |
No. of Genes |
p[genes] |
Link to mutants heatmap |
|
|
|
|
|
|
|
| C-compound and carbohydrate metabolism |
FunCat |
155 |
0.000 |
28 |
0.037 |
|
|
|
|
| Photosystems |
BioPath |
138 |
0.000 |
17 |
0.003 |
|
|
|
| Intermediary Carbon Metabolism |
BioPath |
118 |
0.000 |
20 |
0.021 |
|
|
|
| biogenesis of chloroplast |
FunCat |
96 |
0.000 |
13 |
0.000 |
|
|
|
| Plastidial Isoprenoids (Chlorophylls, Carotenoids, Tocopherols, Plastoquinone, Phylloquinone) |
BioPath |
93 |
0.000 |
12 |
0.020 |
|
|
|
| transport |
FunCat |
75 |
0.000 |
14 |
0.000 |
|
|
|
| Chlorophyll a/b binding proteins |
BioPath |
72 |
0.000 |
9 |
0.000 |
|
|
|
| Carbon fixation |
KEGG |
71 |
0.000 |
12 |
0.001 |
|
|
|
| photosynthesis |
FunCat |
70 |
0.000 |
11 |
0.000 |
|
|
|
| additional photosystem II components |
BioPath |
66 |
0.000 |
8 |
0.004 |
|
|
|
| Glycolysis / Gluconeogenesis |
KEGG |
65 |
0.000 |
11 |
0.009 |
|
|
|
| Chlorophyll biosynthesis and breakdown |
BioPath |
56 |
0.000 |
6 |
0.018 |
|
|
|
| Calvin cycle |
AraCyc |
56 |
0.000 |
10 |
0.000 |
|
|
|
| chlorophyll and phytochromobilin metabolism |
LitPath |
50 |
0.000 |
5 |
0.011 |
|
|
|
|
|
|
|
|
|
|
|
| development |
TAIR-GO |
47 |
0.000 |
6 |
0.023 |
|
|
|
|
|
|
|
|
|
|
|
| Oxidative phosphorylation |
KEGG |
47 |
0.000 |
11 |
0.006 |
|
|
|
|
|
|
|
|
|
|
|
| Pyruvate metabolism |
KEGG |
47 |
0.026 |
6 |
0.267 |
|
|
|
|
|
|
|
|
|
|
|
| chlorophyll biosynthesis |
TAIR-GO |
46 |
0.000 |
5 |
0.000 |
|
|
|
|
|
|
|
|
|
|
|
| chlorophyll biosynthesis |
AraCyc |
46 |
0.000 |
5 |
0.173 |
|
|
|
|
|
|
|
|
|
|
|
| chlorophyll binding |
TAIR-GO |
42 |
0.000 |
5 |
0.000 |
|
|
|
|
|
|
|
|
|
|
|
| Glutamate metabolism |
KEGG |
42 |
0.000 |
5 |
0.088 |
|
|
|
|
|
|
|
|
|
|
|
| Pentose phosphate pathway |
KEGG |
42 |
0.000 |
9 |
0.001 |
|
|
|
|
|
|
|
|
|
|
|
| Translation factors |
KEGG |
42 |
0.005 |
8 |
0.170 |
|
|
|
|
|
|
|
|
|
|
|
| Methionin/SAM/ethylene metabolism from cysteine and aspartate |
BioPath |
40 |
0.000 |
4 |
0.103 |
|
|
|
|
|
|
|
|
|
|
|
| Citrate cycle (TCA cycle) |
KEGG |
38 |
0.000 |
5 |
0.073 |
|
|
|
|
|
|
|
|
|
|
|
| Selenoamino acid metabolism |
KEGG |
36 |
0.000 |
4 |
0.062 |
|
|
|
|
|
|
|
|
|
|
|
| Glycerolipid metabolism |
KEGG |
35 |
0.000 |
5 |
0.029 |
|
|
|
|
|
|
|
|
|
|
|
| Sulfur metabolism |
KEGG |
35 |
0.000 |
4 |
0.018 |
|
|
|
|
|
|
|
|
|
|
|
| Nitrogen metabolism |
KEGG |
33 |
0.008 |
4 |
0.078 |
|
|
|
|
|
|
|
|
|
|
|
| acetate fermentation |
AraCyc |
32 |
0.039 |
8 |
0.055 |
|
|
|
|
|
|
|
|
|
|
|
| aerobic respiration |
FunCat |
32 |
0.000 |
5 |
0.001 |
|
|
|
|
|
|
|
|
|
|
|
| energy |
FunCat |
32 |
0.000 |
6 |
0.000 |
|
|
|
|
|
|
|
|
|
|
|
| respiration |
FunCat |
32 |
0.000 |
5 |
0.001 |
|
|
|
|
|
|
|
|
|
|
|
| Glutathione metabolism |
KEGG |
32 |
0.008 |
4 |
0.186 |
|
|
|
|
|
|
|
|
|
|
|
| transport facilitation |
FunCat |
31 |
0.000 |
6 |
0.000 |
|
|
|
|
|
|
|
|
|
|
|
| Fatty acid metabolism |
KEGG |
31 |
0.016 |
4 |
0.096 |
|
|
|
|
|
|
|
|
|
|
|
|
|
|
|
|
|
|
|
|
|
|
|
|
|
|
|
|