| _________________________________________ |
|
|
|
|
|
|
|
|
|
|
|
|
|
|
|
| Pathways co-expressed in all 4 data sets (with more than 6 annotation points each) |
|
Find below a list of pathways that are co-expressed with the bait. First a list of pathways is given that are co-expressed in all data sets. Lists for each individual dataset are shown underneath. Depending on the number of co-expressed pathways only the top scoring pathways are given; all data can be saved as text using the link above. |
|
|
|
|
|
|
| Pathway |
Source |
Sum of scores |
Sum of genes |
|
|
|
|
|
|
|
| Plastidial Isoprenoids (Chlorophylls, Carotenoids, Tocopherols, Plastoquinone, Phylloquinone) |
BioPath |
360 |
46 |
|
|
|
|
|
|
|
| photosynthesis |
FunCat |
170 |
29 |
|
|
|
|
|
|
|
| Chlorophyll biosynthesis and breakdown |
BioPath |
145 |
17 |
|
|
|
|
|
|
|
|
|
| chlorophyll and phytochromobilin metabolism |
LitPath |
139 |
16 |
|
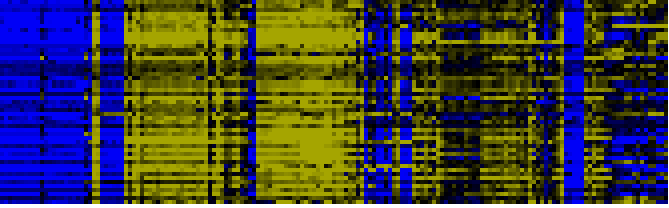
To the right of each table a thumbnail of the actual co-expression heatmap is given. Klick on the link to see the heatmap containing all co-expressed genes. |
|
|
|
|
|
|
|
|
| Pathway for nuclear-encoded, thylakoid-localized proteins |
BioPath |
136 |
16 |
|
|
|
|
|
|
|
|
|
| chlorophyll biosynthesis |
TAIR-GO |
135 |
14 |
|
|
|
|
|
|
|
|
|
| chlorophyll biosynthesis |
AraCyc |
134 |
15 |
|
For more information on how these pathway maps were generated please read the methods page |
|
|
|
|
|
|
|
|
| Carotenoid and abscisic acid metabolism |
LitPath |
121 |
16 |
|
|
|
|
|
|
|
|
|
| chlorophyll biosynthesis |
LitPath |
119 |
12 |
|
|
|
|
|
|
|
|
|
|
|
|
|
| Protein export |
KEGG |
113 |
15 |
|
|
|
|
|
|
|
|
|
|
|
|
|
| carotenoid biosynthesis |
AraCyc |
112 |
13 |
|
|
|
|
|
|
|
|
|
|
|
|
|
| photorespiration |
AraCyc |
106 |
18 |
|
|
|
|
|
|
|
|
|
|
|
|
|
| Carotenoid biosynthesis |
BioPath |
104 |
12 |
|
|
|
|
|
|
|
|
|
|
|
|
|
| carotenid biosynthesis |
LitPath |
104 |
12 |
|
|
|
|
|
|
|
|
|
|
|
|
|
| photorespiration |
TAIR-GO |
88 |
12 |
|
|
|
|
|
|
|
|
|
|
|
|
|
| carotenoid biosynthesis |
TAIR-GO |
76 |
9 |
|
|
|
|
|
|
|
|
|
|
|
|
|
| Thylakoid biogenesis and photosystem assembly |
BioPath |
74 |
8 |
|
|
|
|
|
|
|
|
|
|
|
|
|
| chloroplast thylakoid membrane protein import |
TAIR-GO |
67 |
7 |
|
|
|
|
|
|
|
|
|
|
|
|
|
| photosynthesis |
TAIR-GO |
56 |
11 |
|
|
|
|
|
|
|
|
|
|
|
|
|
| brassinosteroid biosynthesis |
BioPath |
50 |
5 |
|
|
|
|
|
|
|
|
|
|
|
|
|
| chlorophyll catabolism |
TAIR-GO |
50 |
5 |
|
|
|
|
|
|
|
|
|
|
|
|
|
| chlorophyll catabolism |
LitPath |
50 |
5 |
|
|
|
|
|
|
|
|
|
|
|
|
|
|
|
|
|
|
|
|
|
|
|
|
|
|
|
|
|
|
|
|
|
|
|
|
|
|
|
|
|
|
|
|
|
|
|
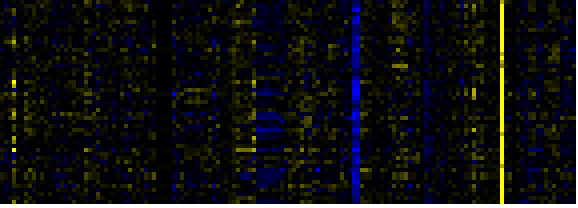
| Pathways co-expressed in the Organ and Tissue data set (with more than 50 annotation points) |
|
CYP71B34 (At3g26300) |
|
|
|
|
|
|
|
|
| max. difference between log2-ratios: |
4.9 |
|
|
|
|
|
|
|
|
|
|
|
|
| max. difference between log2-ratios excluding lowest and highest 5%: |
4.5 |
|
|
|
|
|
|
|
|
|
|
|
|
| Pathway |
Source |
Scores of Genes |
p[Score] |
No. of Genes |
p[genes] |
Link to organ heatmap |
|
|
|
|
|
|
|
| Photosystems |
BioPath |
313 |
0.000 |
49 |
0.000 |
|
|
|
| Plastidial Isoprenoids (Chlorophylls, Carotenoids, Tocopherols, Plastoquinone, Phylloquinone) |
BioPath |
207 |
0.000 |
27 |
0.000 |
|
|
| C-compound and carbohydrate metabolism |
FunCat |
156 |
0.000 |
27 |
0.039 |
|
|
| biogenesis of chloroplast |
FunCat |
147 |
0.000 |
23 |
0.000 |
|
|
| photosynthesis |
FunCat |
138 |
0.000 |
22 |
0.000 |
|
|
| additional photosystem II components |
BioPath |
132 |
0.000 |
20 |
0.000 |
|
|
| Photosystem I |
BioPath |
129 |
0.000 |
21 |
0.000 |
|
|
| Photosynthesis |
KEGG |
129 |
0.000 |
23 |
0.000 |
|
|
| Carbon fixation |
KEGG |
102 |
0.000 |
15 |
0.000 |
|
|
| glycolysis and gluconeogenesis |
FunCat |
95 |
0.000 |
15 |
0.014 |
|
|
| Chlorophyll a/b binding proteins |
BioPath |
90 |
0.000 |
11 |
0.000 |
|
|
| Chlorophyll biosynthesis and breakdown |
BioPath |
85 |
0.000 |
11 |
0.001 |
|
|
| transport |
FunCat |
81 |
0.000 |
14 |
0.000 |
|
|
| chlorophyll and phytochromobilin metabolism |
LitPath |
79 |
0.000 |
10 |
0.000 |
|
|
|
|
|
|
|
|
|
|
|
| photosystem I |
TAIR-GO |
77 |
0.000 |
10 |
0.000 |
|
|
|
|
|
|
|
|
|
|
|
| Folding, Sorting and Degradation |
KEGG |
74 |
0.000 |
11 |
0.023 |
|
|
|
|
|
|
|
|
|
|
|
| Photosystem II |
BioPath |
67 |
0.000 |
9 |
0.031 |
|
|
|
|
|
|
|
|
|
|
|
| Calvin cycle |
AraCyc |
66 |
0.000 |
12 |
0.000 |
|
|
|
|
|
|
|
|
|
|
|
| chlorophyll biosynthesis |
TAIR-GO |
65 |
0.000 |
7 |
0.000 |
|
|
|
|
|
|
|
|
|
|
|
| chlorophyll biosynthesis |
AraCyc |
64 |
0.000 |
8 |
0.036 |
|
|
|
|
|
|
|
|
|
|
|
| Carotenoid and abscisic acid metabolism |
LitPath |
63 |
0.000 |
9 |
0.000 |
|
|
|
|
|
|
|
|
|
|
|
| photosystem II |
TAIR-GO |
61 |
0.000 |
8 |
0.000 |
|
|
|
|
|
|
|
|
|
|
|
| Pathway for nuclear-encoded, thylakoid-localized proteins |
BioPath |
58 |
0.000 |
7 |
0.000 |
|
|
|
|
|
|
|
|
|
|
|
| Porphyrin and chlorophyll metabolism |
KEGG |
53 |
0.000 |
6 |
0.001 |
|
|
|
|
|
|
|
|
|
|
|
| Protein export |
KEGG |
53 |
0.000 |
7 |
0.000 |
|
|
|
|
|
|
|
|
|
|
|
| Carotenoid biosynthesis |
BioPath |
52 |
0.000 |
6 |
0.000 |
|
|
|
|
|
|
|
|
|
|
|
| carotenoid biosynthesis |
AraCyc |
52 |
0.000 |
6 |
0.000 |
|
|
|
|
|
|
|
|
|
|
|
| Biosynthesis of steroids |
KEGG |
52 |
0.000 |
6 |
0.017 |
|
|
|
|
|
|
|
|
|
|
|
| carotenid biosynthesis |
LitPath |
52 |
0.000 |
6 |
0.000 |
|
|
|
|
|
|
|
|
|
|
|
|
|
|
|
|
|
|
|
|
|
|
|
|
|
|
|
|
|
|
|
|
|
|
|
|
|
|
|
|
|
|
|
|
|
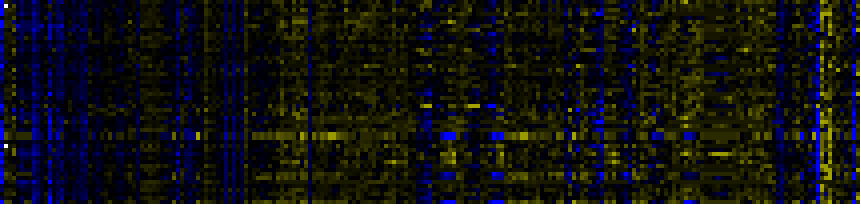
| Pathways co-expressed in the Stress data set ( with more than 10 annotation points) |
|
CYP71B34 (At3g26300) |
|
|
|
|
|
|
|
|
| max. difference between log2-ratios: |
5.5 |
|
|
|
|
|
|
|
|
|
|
|
|
| max. difference between log2-ratios excluding lowest and highest 5%: |
1.7 |
|
|
|
|
|
|
|
|
|
|
|
|
| Pathway |
Source |
Scores of Genes |
p[Score] |
No. of Genes |
p[genes] |
Link to stress heatmap |
|
|
|
|
|
|
|
| Pathway for nuclear-encoded, thylakoid-localized proteins |
BioPath |
44 |
0.000 |
5 |
0.000 |
|
| Plastidial Isoprenoids (Chlorophylls, Carotenoids, Tocopherols, Plastoquinone, Phylloquinone) |
BioPath |
44 |
0.000 |
5 |
0.007 |
| Glucosinolate Metabolism |
LitPath |
40 |
0.000 |
4 |
0.000 |
| Folding, Sorting and Degradation |
KEGG |
36 |
0.000 |
5 |
0.001 |
| Protein export |
KEGG |
36 |
0.000 |
5 |
0.000 |
| glucosinolate biosynthesis |
TAIR-GO |
30 |
0.000 |
3 |
0.000 |
| glucosinolate biosynthesis from homomethionine |
AraCyc |
30 |
0.000 |
3 |
0.000 |
| Transcription (chloroplast) |
BioPath |
24 |
0.000 |
3 |
0.000 |
| transcription initiation |
TAIR-GO |
24 |
0.000 |
3 |
0.000 |
| Chlorophyll biosynthesis and breakdown |
BioPath |
20 |
0.000 |
2 |
0.031 |
| SRP (signal recognition particle)-dependent pathway for integral membrane proteins |
BioPath |
20 |
0.000 |
2 |
0.000 |
| Thylakoid biogenesis and photosystem assembly |
BioPath |
20 |
0.000 |
2 |
0.000 |
| chloroplast thylakoid membrane protein import |
TAIR-GO |
20 |
0.000 |
2 |
0.000 |
| transport |
FunCat |
20 |
0.000 |
4 |
0.000 |
|
|
|
|
|
|
|
|
|
|
|
| chlorophyll and phytochromobilin metabolism |
LitPath |
20 |
0.000 |
2 |
0.026 |
|
|
|
|
|
|
|
|
|
|
|
| Glycine, serine and threonine metabolism |
KEGG |
15 |
0.000 |
2 |
0.006 |
|
|
|
|
|
|
|
|
|
|
|
| Delta-pH pathway |
BioPath |
14 |
0.000 |
2 |
0.000 |
|
|
|
|
|
|
|
|
|
|
|
| Ascorbate and aldarate metabolism |
KEGG |
14 |
0.000 |
2 |
0.002 |
|
|
|
|
|
|
|
|
|
|
|
| Stilbene, coumarine and lignin biosynthesis |
KEGG |
14 |
0.000 |
2 |
0.080 |
|
|
|
|
|
|
|
|
|
|
|
| ascorbic acid biosynthesis |
BioPath |
12 |
0.000 |
2 |
0.009 |
|
|
|
|
|
|
|
|
|
|
|
| carbon monoxide dehydrogenase pathway |
AraCyc |
11 |
0.000 |
3 |
0.000 |
|
|
|
|
|
|
|
|
|
|
|
|
|
|
|
|
|
|
|
|
|
|
|
|
|
|
|
|
|
|
|
|
|
|
|
|
|
|
|
|
|
|
|
|
|
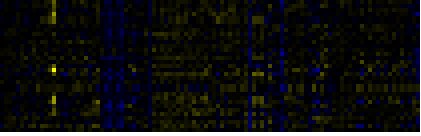
| Pathways co-expressed in the Hormone etc. data set (with more than 9 annotation points) |
|
CYP71B34 (At3g26300) |
|
|
|
|
|
|
|
|
| max. difference between log2-ratios: |
2.4 |
|
|
|
|
|
|
|
|
|
|
|
|
| max. difference between log2-ratios excluding lowest and highest 5%: |
0.8 |
|
|
|
|
|
|
|
|
|
|
|
|
| Pathway |
Source |
Scores of Genes |
p[Score] |
No. of Genes |
p[genes] |
Link to hormones etc. heatmap |
|
|
|
|
|
|
|
| C-compound and carbohydrate metabolism |
FunCat |
22 |
0.000 |
4 |
0.027 |
|
|
|
|
|
|
| Plastidial Isoprenoids (Chlorophylls, Carotenoids, Tocopherols, Plastoquinone, Phylloquinone) |
BioPath |
18 |
0.000 |
2 |
0.050 |
|
|
|
|
|
| Inositol phosphate metabolism |
KEGG |
17 |
0.000 |
3 |
0.015 |
|
|
|
|
|
| glycolysis and gluconeogenesis |
FunCat |
14 |
0.000 |
3 |
0.007 |
|
|
|
|
|
| Lipid signaling |
AcylLipid |
14 |
0.000 |
3 |
0.015 |
|
|
|
|
|
| Basal transcription factors |
KEGG |
12 |
0.000 |
2 |
0.005 |
|
|
|
|
|
| Streptomycin biosynthesis |
KEGG |
12 |
0.000 |
2 |
0.000 |
|
|
|
|
|
| Transcription |
KEGG |
12 |
0.000 |
2 |
0.041 |
|
|
|
|
|
| Benzoate degradation via CoA ligation |
KEGG |
11 |
0.001 |
2 |
0.058 |
|
|
|
|
|
| Nicotinate and nicotinamide metabolism |
KEGG |
11 |
0.000 |
2 |
0.048 |
|
|
|
|
|
|
|
|
|
|
|
| Chlorophyll biosynthesis and breakdown |
BioPath |
10 |
0.000 |
1 |
0.043 |
|
|
|
|
|
|
|
|
|
|
|
| Pathway for nuclear-encoded, thylakoid-localized proteins |
BioPath |
10 |
0.000 |
1 |
0.007 |
|
|
|
|
|
|
|
|
|
|
|
| Phytic acid biosynthesis |
BioPath |
10 |
0.000 |
3 |
0.000 |
|
|
|
|
|
|
|
|
|
|
|
| SRP (signal recognition particle)-dependent pathway for integral membrane proteins |
BioPath |
10 |
0.000 |
1 |
0.001 |
|
|
|
|
|
|
|
|
|
|
|
| cell death |
TAIR-GO |
10 |
0.000 |
1 |
0.000 |
|
|
|
|
|
|
|
|
|
|
|
| chlorophyll biosynthesis |
TAIR-GO |
10 |
0.000 |
1 |
0.003 |
|
|
|
|
|
|
|
|
|
|
|
| chloroplast thylakoid membrane protein import |
TAIR-GO |
10 |
0.000 |
1 |
0.000 |
|
|
|
|
|
|
|
|
|
|
|
| microtubule cytoskeleton |
TAIR-GO |
10 |
0.000 |
1 |
0.000 |
|
|
|
|
|
|
|
|
|
|
|
| programmed cell death |
TAIR-GO |
10 |
0.000 |
1 |
0.000 |
|
|
|
|
|
|
|
|
|
|
|
| chlorophyll biosynthesis |
AraCyc |
10 |
0.000 |
1 |
0.075 |
|
|
|
|
|
|
|
|
|
|
|
| lactose degradation IV |
AraCyc |
10 |
0.000 |
2 |
0.000 |
|
|
|
|
|
|
|
|
|
|
|
| lipases pathway |
AraCyc |
10 |
0.000 |
1 |
0.021 |
|
|
|
|
|
|
|
|
|
|
|
| stress response |
FunCat |
10 |
0.000 |
1 |
0.000 |
|
|
|
|
|
|
|
|
|
|
|
| Folding, Sorting and Degradation |
KEGG |
10 |
0.036 |
1 |
0.291 |
|
|
|
|
|
|
|
|
|
|
|
| Protein export |
KEGG |
10 |
0.000 |
1 |
0.033 |
|
|
|
|
|
|
|
|
|
|
|
| Starch and sucrose metabolism |
KEGG |
10 |
0.008 |
2 |
0.038 |
|
|
|
|
|
|
|
|
|
|
|
| chlorophyll and phytochromobilin metabolism |
LitPath |
10 |
0.000 |
1 |
0.021 |
|
|
|
|
|
|
|
|
|
|
|
| chlorophyll biosynthesis |
LitPath |
10 |
0.000 |
1 |
0.002 |
|
|
|
|
|
|
|
|
|
|
|
|
|
|
|
|
|
|
|
|
|
|
|
|
|
|
|
|
|
|
|
|
|
|
|
|
|
|
|
|
|
|
|
|
|
|
|
|
|
|
|
|
|
|
|
|
|
|
|
|
|
|
| Pathways co-expressed in the Mutant data set (with more than 20 annotation points) |
|
CYP71B34 (At3g26300) |
|
|
|
|
|
|
|
|
| max. difference between log2-ratios: |
3.1 |
|
|
|
|
|
|
|
|
|
|
|
|
| max. difference between log2-ratios excluding lowest and highest 5%: |
1.0 |
|
|
|
|
|
|
|
|
|
|
|
|
| Pathway |
Source |
Scores of Genes |
p[Score] |
No. of Genes |
p[genes] |
Link to mutants heatmap |
|
|
|
|
|
|
|
| Plastidial Isoprenoids (Chlorophylls, Carotenoids, Tocopherols, Plastoquinone, Phylloquinone) |
BioPath |
91 |
0.000 |
12 |
0.000 |
|
|
|
|
| Isoprenoid Biosynthesis in the Cytosol and in Mitochondria |
BioPath |
44 |
0.000 |
5 |
0.055 |
|
|
|
| Carotenoid and abscisic acid metabolism |
LitPath |
40 |
0.000 |
5 |
0.000 |
|
|
|
| triterpene, sterol, and brassinosteroid metabolism |
LitPath |
40 |
0.000 |
4 |
0.257 |
|
|
|
| amino acid metabolism |
FunCat |
36 |
0.000 |
5 |
0.085 |
|
|
|
| Biosynthesis of steroids |
KEGG |
35 |
0.000 |
4 |
0.016 |
|
|
|
| Carotenoid biosynthesis |
BioPath |
34 |
0.000 |
4 |
0.000 |
|
|
|
| carotenoid biosynthesis |
AraCyc |
34 |
0.000 |
4 |
0.000 |
|
|
|
| carotenid biosynthesis |
LitPath |
34 |
0.000 |
4 |
0.000 |
|
|
|
| Nitrogen metabolism |
KEGG |
33 |
0.000 |
5 |
0.000 |
|
|
|
| Chlorophyll biosynthesis and breakdown |
BioPath |
30 |
0.000 |
3 |
0.053 |
|
|
|
| sterol biosynthesis |
BioPath |
30 |
0.000 |
3 |
0.025 |
|
|
|
| sterol biosynthesis |
TAIR-GO |
30 |
0.000 |
3 |
0.009 |
|
|
|
| chlorophyll and phytochromobilin metabolism |
LitPath |
30 |
0.000 |
3 |
0.083 |
|
|
|
|
|
|
|
|
|
|
|
| Glycolysis / Gluconeogenesis |
KEGG |
28 |
0.000 |
6 |
0.012 |
|
|
|
|
|
|
|
|
|
|
|
| photorespiration |
AraCyc |
27 |
0.000 |
4 |
0.010 |
|
|
|
|
|
|
|
|
|
|
|
| biogenesis of chloroplast |
FunCat |
26 |
0.000 |
4 |
0.034 |
|
|
|
|
|
|
|
|
|
|
|
| Sulfur metabolism |
KEGG |
26 |
0.000 |
4 |
0.001 |
|
|
|
|
|
|
|
|
|
|
|
| transport |
FunCat |
25 |
0.000 |
5 |
0.000 |
|
|
|
|
|
|
|
|
|
|
|
| Delta-pH pathway |
BioPath |
24 |
0.000 |
3 |
0.000 |
|
|
|
|
|
|
|
|
|
|
|
| Pathway for nuclear-encoded, thylakoid-localized proteins |
BioPath |
24 |
0.000 |
3 |
0.002 |
|
|
|
|
|
|
|
|
|
|
|
| development |
TAIR-GO |
23 |
0.001 |
3 |
0.063 |
|
|
|
|
|
|
|
|
|
|
|
| Carbon fixation |
KEGG |
23 |
0.002 |
5 |
0.018 |
|
|
|
|
|
|
|
|
|
|
|
| Cyanoamino acid metabolism |
KEGG |
23 |
0.000 |
3 |
0.008 |
|
|
|
|
|
|
|
|
|
|
|
| ascorbic acid biosynthesis |
BioPath |
22 |
0.000 |
3 |
0.012 |
|
|
|
|
|
|
|
|
|
|
|
| cysteine biosynthesis I |
AraCyc |
21 |
0.000 |
4 |
0.018 |
|
|
|
|
|
|
|
|
|
|
|
| transport facilitation |
FunCat |
21 |
0.000 |
4 |
0.000 |
|
|
|
|
|
|
|
|
|
|
|
|
|
|
|
|
|
|
|
|
|
|
|
|
|
|
|
|