| _________________________________________ |
|
|
|
|
|
|
|
|
|
|
|
|
|
|
|
| Pathways co-expressed in all the 2 data sets with co-expressed pathways (with more than 6 annotation points each) |
|
Find below a list of pathways that are co-expressed with the bait. First a list of pathways is given that are co-expressed in all data sets. Lists for each individual dataset are shown underneath. Depending on the number of co-expressed pathways only the top scoring pathways are given; all data can be saved as text using the link above. |
|
|
|
|
|
|
| Pathway |
Source |
Sum of scores |
Sum of genes |
|
|
|
|
|
|
|
| C-compound and carbohydrate metabolism |
FunCat |
65 |
13 |
|
|
|
|
|
|
|
| Intermediary Carbon Metabolism |
BioPath |
56 |
9 |
|
|
|
|
|
|
|
|
|
| metabolism of acyl-lipids in mitochondria |
AcylLipid |
30 |
3 |
|
|
|
|
|
|
|
|
|
| lipoic acid metabolism |
TAIR-GO |
20 |
2 |
|
To the right of each table a thumbnail of the actual co-expression heatmap is given. Klick on the link to see the heatmap containing all co-expressed genes. |
|
|
|
|
|
|
|
|
|
|
|
|
|
|
|
|
|
|
|
|
|
|
|
|
|
|
|
|
|
|
|
|
|
|
|
|
|
|
|
For more information on how these pathway maps were generated please read the methods page |
|
|
|
|
|
|
|
|
|
|
|
|
|
|
|
|
|
|
|
|
|
|
|
|
|
|
|
|
|
|
|
|
|
|
|
|
|
|
|
|
|
|
|
|
|
|
|
|
|
|
|
|
|
|
|
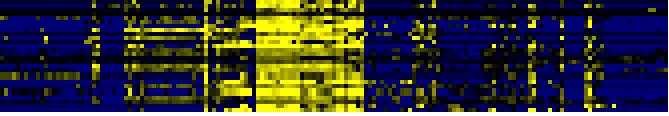
| Pathways co-expressed in the Organ and Tissue data set (with more than 6 annotation points) |
|
CYP71B36 (At3g26320) |
|
|
|
|
|
|
|
|
| max. difference between log2-ratios: |
4.3 |
|
|
|
|
|
|
|
|
|
|
|
|
| max. difference between log2-ratios excluding lowest and highest 5%: |
3.2 |
|
|
|
|
|
|
|
|
|
|
|
|
| Pathway |
Source |
Scores of Genes |
p[Score] |
No. of Genes |
p[genes] |
Link to organ heatmap |
|
|
|
|
|
|
|
| C-compound and carbohydrate metabolism |
FunCat |
12 |
0.005 |
2 |
0.168 |
|
|
|
| defense related proteins |
FunCat |
11 |
0.000 |
3 |
0.000 |
|
|
| disease, virulence and defense |
FunCat |
11 |
0.000 |
3 |
0.000 |
|
|
| Intermediary Carbon Metabolism |
BioPath |
10 |
0.000 |
2 |
0.002 |
|
|
| lipoic acid metabolism |
TAIR-GO |
10 |
0.000 |
1 |
0.000 |
|
|
| Ion channels |
KEGG |
10 |
0.000 |
5 |
0.000 |
|
|
| Ligand-Receptor Interaction |
KEGG |
10 |
0.000 |
5 |
0.000 |
|
|
| Starch and sucrose metabolism |
KEGG |
10 |
0.000 |
2 |
0.009 |
|
|
|
|
|
|
|
|
|
|
|
| metabolism of acyl-lipids in mitochondria |
AcylLipid |
10 |
0.000 |
1 |
0.006 |
|
|
|
|
|
|
|
|
|
|
|
|
|
|
|
|
|
|
|
|
|
|
|
|
|
|
|
|
|
|
|
|
|
|
|
|
|
|
|
|
|
|
|
|
|
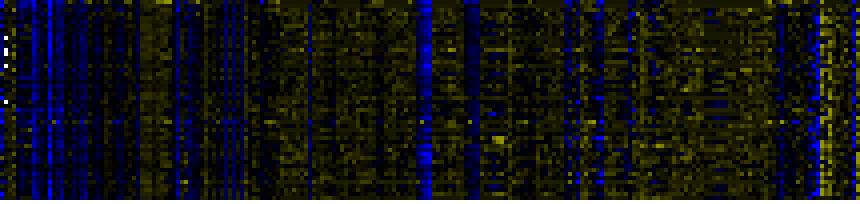
| Pathways co-expressed in the Stress data set ( with more than 20 annotation points) |
|
CYP71B36 (At3g26320) |
|
|
|
|
|
|
|
|
| max. difference between log2-ratios: |
5.2 |
|
|
|
|
|
|
|
|
|
|
|
|
| max. difference between log2-ratios excluding lowest and highest 5%: |
3.0 |
|
|
|
|
|
|
|
|
|
|
|
|
| Pathway |
Source |
Scores of Genes |
p[Score] |
No. of Genes |
p[genes] |
Link to stress heatmap |
|
|
|
|
|
|
|
| Plastidial Isoprenoids (Chlorophylls, Carotenoids, Tocopherols, Plastoquinone, Phylloquinone) |
BioPath |
59 |
0.000 |
9 |
0.000 |
|
| C-compound and carbohydrate metabolism |
FunCat |
53 |
0.000 |
11 |
0.037 |
| Intermediary Carbon Metabolism |
BioPath |
46 |
0.000 |
7 |
0.175 |
| Photosystems |
BioPath |
44 |
0.000 |
9 |
0.003 |
| biogenesis of chloroplast |
FunCat |
42 |
0.000 |
8 |
0.000 |
| photosynthesis |
FunCat |
40 |
0.000 |
9 |
0.000 |
| mRNA processing in chloroplast |
BioPath |
38 |
0.000 |
7 |
0.000 |
| Chlorophyll biosynthesis and breakdown |
BioPath |
31 |
0.000 |
4 |
0.005 |
| additional photosystem II components |
BioPath |
28 |
0.000 |
6 |
0.000 |
| glycolysis and gluconeogenesis |
FunCat |
28 |
0.000 |
6 |
0.031 |
| chlorophyll biosynthesis |
TAIR-GO |
25 |
0.000 |
3 |
0.000 |
| Porphyrin and chlorophyll metabolism |
KEGG |
25 |
0.000 |
3 |
0.002 |
| chlorophyll and phytochromobilin metabolism |
LitPath |
25 |
0.000 |
3 |
0.028 |
|
|
|
|
|
|
|
|
|
|
|
| Transcription (chloroplast) |
BioPath |
24 |
0.000 |
3 |
0.000 |
|
|
|
|
|
|
|
|
|
|
|
| transcription initiation |
TAIR-GO |
24 |
0.000 |
3 |
0.000 |
|
|
|
|
|
|
|
|
|
|
|
| Glycolysis / Gluconeogenesis |
KEGG |
24 |
0.000 |
4 |
0.020 |
|
|
|
|
|
|
|
|
|
|
|
| Pentose phosphate pathway |
KEGG |
23 |
0.000 |
5 |
0.000 |
|
|
|
|
|
|
|
|
|
|
|
|
|
|
|
|
|
|
|
|
|
|
|
|
|
|
|
|