|
|
|
|
|
|
|
|
|
|
|
|
|
|
|
|
|
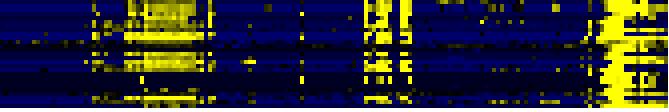
| Pathways co-expressed in the Organ and Tissue data set (with more than 6 annotation points) |
|
CYP71B37 (At3g26330) |
|
|
|
|
|
|
|
|
| max. difference between log2-ratios: |
6.6 |
|
|
|
|
|
|
|
|
|
|
|
|
| max. difference between log2-ratios excluding lowest and highest 5%: |
4.0 |
|
|
|
|
|
|
|
|
|
|
|
|
| Pathway |
Source |
Scores of Genes |
p[Score] |
No. of Genes |
p[genes] |
Link to organ heatmap |
|
|
|
|
|
|
|
| Stilbene, coumarine and lignin biosynthesis |
KEGG |
19 |
0.000 |
3 |
0.000 |
|
|
|
| Ascorbate and aldarate metabolism |
KEGG |
17 |
0.000 |
2 |
0.000 |
|
|
| Fluorene degradation |
KEGG |
17 |
0.000 |
2 |
0.000 |
|
|
| gamma-Hexachlorocyclohexane degradation |
KEGG |
17 |
0.000 |
2 |
0.000 |
|
|
| Leaf Glycerolipid Biosynthesis |
BioPath |
10 |
0.000 |
3 |
0.001 |
|
|
| Leaf Glycerolipid Biosynthesis in Plastid |
BioPath |
10 |
0.000 |
3 |
0.000 |
|
|
| fatty acid metabolism |
TAIR-GO |
10 |
0.000 |
1 |
0.002 |
|
|
| detoxification |
FunCat |
10 |
0.000 |
1 |
0.000 |
|
|
|
|
|
|
|
|
|
|
|
| detoxification involving cytochrome P450 |
FunCat |
10 |
0.000 |
1 |
0.001 |
|
|
|
|
|
|
|
|
|
|
|
| Fatty acid elongation and wax and cutin metabolism |
AcylLipid |
10 |
0.000 |
1 |
0.232 |
|
|
|
|
|
|
|
|
|
|
|
| fatty acid modulation |
LitPath |
10 |
0.000 |
1 |
0.000 |
|
|
|
|
|
|
|
|
|
|
|
| Synthesis of fatty acids in plastids |
AcylLipid |
8 |
0.001 |
2 |
0.019 |
|
|
|
|
|
|
|
|
|
|
|
| brassinosteroid biosynthesis |
TAIR-GO |
7 |
0.000 |
1 |
0.001 |
|
|
|
|
|
|
|
|
|
|
|
| growth |
TAIR-GO |
7 |
0.000 |
1 |
0.002 |
|
|
|
|
|
|
|
|
|
|
|
| leaf morphogenesis |
TAIR-GO |
7 |
0.000 |
1 |
0.000 |
|
|
|
|
|
|
|
|
|
|
|
| monopolar cell growth |
TAIR-GO |
7 |
0.000 |
1 |
0.000 |
|
|
|
|
|
|
|
|
|
|
|
| steroid biosynthesis |
TAIR-GO |
7 |
0.000 |
1 |
0.001 |
|
|
|
|
|
|
|
|
|
|
|
| biosynthesis of phenylpropanoids |
FunCat |
7 |
0.000 |
1 |
0.006 |
|
|
|
|
|
|
|
|
|
|
|
| biosynthesis of secondary products derived from L-phenylalanine and L-tyrosine |
FunCat |
7 |
0.000 |
1 |
0.006 |
|
|
|
|
|
|
|
|
|
|
|
| brassinosteroid biosynthesis |
LitPath |
7 |
0.000 |
1 |
0.013 |
|
|
|
|
|
|
|
|
|
|
|
| triterpene, sterol, and brassinosteroid metabolism |
LitPath |
7 |
0.003 |
1 |
0.111 |
|
|
|
|
|
|
|
|
|
|
|
|
|
|
|
|
|
|
|
|
|
|
|
|
|
|
|
|
|
|
|
|
|
|
|
|
|
|
|
|
|
|
|
|
|
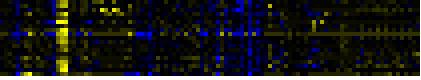
| Pathways co-expressed in the Stress data set ( with more than 6 annotation points) |
|
CYP71B37 (At3g26330) |
|
|
|
|
|
|
|
|
| max. difference between log2-ratios: |
7.7 |
|
|
|
|
|
|
|
|
|
|
|
|
| max. difference between log2-ratios excluding lowest and highest 5%: |
2.0 |
|
|
|
|
|
|
|
|
|
|
|
|
| Pathway |
Source |
Scores of Genes |
p[Score] |
No. of Genes |
p[genes] |
Link to stress heatmap |
|
|
|
|
|
|
|
| gibberellic acid biosynthesis |
TAIR-GO |
10 |
0.000 |
1 |
0.000 |

|
| seed germination |
TAIR-GO |
10 |
0.000 |
1 |
0.000 |
| Diterpenoid biosynthesis |
KEGG |
10 |
0.000 |
1 |
0.000 |
| Gibberellin metabolism |
LitPath |
10 |
0.000 |
1 |
0.003 |
|
|
|
|
|
|
|
|
|
|
|
| giberelin biosynthesis |
LitPath |
10 |
0.000 |
1 |
0.002 |
|
|
|
|
|
|
|
|
|
|
|
| trehalose biosynthesis |
TAIR-GO |
9 |
0.000 |
1 |
0.000 |
|
|
|
|
|
|
|
|
|
|
|
| trehalose biosynthesis I |
AraCyc |
9 |
0.000 |
1 |
0.001 |
|
|
|
|
|
|
|
|
|
|
|
| trehalose biosynthesis II |
AraCyc |
9 |
0.000 |
1 |
0.001 |
|
|
|
|
|
|
|
|
|
|
|
| trehalose biosynthesis III |
AraCyc |
9 |
0.000 |
1 |
0.000 |
|
|
|
|
|
|
|
|
|
|
|
| C-compound and carbohydrate metabolism |
FunCat |
9 |
0.000 |
1 |
0.038 |
|
|
|
|
|
|
|
|
|
|
|
| energy |
FunCat |
9 |
0.000 |
1 |
0.000 |
|
|
|
|
|
|
|
|
|
|
|
| metabolism of energy reserves (e.g. glycogen, trehalose) |
FunCat |
9 |
0.000 |
1 |
0.000 |
|
|
|
|
|
|
|
|
|
|
|
|
|
|
|
|
|
|
|
|
|
|
|
|
|
|
|
|
|
|
|
|
|
|
|
|
|
|
|
|
|
|
|
|
|
| Pathways co-expressed in the Hormone etc. data set (with more than 6 annotation points) |
|
CYP71B37 (At3g26330) |
|
|
|
|
|
|
|
|
| max. difference between log2-ratios: |
3.9 |
|
|
|
|
|
|
|
|
|
|
|
|
| max. difference between log2-ratios excluding lowest and highest 5%: |
1.6 |
|
|
|
|
|
|
|
|
|
|
|
|
| Pathway |
Source |
Scores of Genes |
p[Score] |
No. of Genes |
p[genes] |
Link to hormones etc. heatmap |
|
|
|
|
|
|
|
| Cell Wall Carbohydrate Metabolism |
BioPath |
10 |
0.000 |
1 |
0.168 |
|
|
|
|
|
|
| sucrose metabolism |
BioPath |
10 |
0.000 |
1 |
0.001 |
|
|
|
|
|
| tryptophan catabolism |
TAIR-GO |
10 |
0.000 |
1 |
0.000 |
|
|
|
|
|
| glucosinolate biosynthesis from tryptophan |
AraCyc |
10 |
0.000 |
1 |
0.000 |
|
|
|
|
|
| IAA biosynthesis |
AraCyc |
10 |
0.000 |
1 |
0.000 |
|
|
|
|
|
| IAA biosynthesis I |
AraCyc |
10 |
0.000 |
1 |
0.000 |
|
|
|
|
|
|
|
|
|
|
|
| C-compound and carbohydrate metabolism |
FunCat |
10 |
0.002 |
1 |
0.172 |
|
|
|
|
|
|
|
|
|
|
|
| glycolysis and gluconeogenesis |
FunCat |
10 |
0.000 |
1 |
0.042 |
|
|
|
|
|
|
|
|
|
|
|
| Galactose metabolism |
KEGG |
10 |
0.000 |
1 |
0.003 |
|
|
|
|
|
|
|
|
|
|
|
| Starch and sucrose metabolism |
KEGG |
10 |
0.000 |
1 |
0.015 |
|
|
|
|
|
|
|
|
|
|
|
| Glucosinolate Metabolism |
LitPath |
10 |
0.000 |
1 |
0.019 |
|
|
|
|
|
|
|
|
|
|
|
| secondary metabolism |
FunCat |
9 |
0.000 |
2 |
0.001 |
|
|
|
|
|
|
|
|
|
|
|
| triterpene, sterol, and brassinosteroid metabolism |
LitPath |
9 |
0.001 |
2 |
0.036 |
|
|
|
|
|
|
|
|
|
|
|
| pentacyclic triterpenoid biosynthesis |
TAIR-GO |
7 |
0.000 |
1 |
0.000 |
|
|
|
|
|
|
|
|
|
|
|
| Biosynthesis of steroids |
KEGG |
7 |
0.000 |
1 |
0.006 |
|
|
|
|
|
|
|
|
|
|
|
| triterpene biosynthesis |
LitPath |
7 |
0.000 |
1 |
0.005 |
|
|
|
|
|
|
|
|
|
|
|
|
|
|
|
|
|
|
|
|
|
|
|
|
|
|
|
|
|
|
|
|
|
|
|
|
|
|
|
|
|
|
|
|
|
|
|
|
|
|
|
|
|
|
|
|
|
|
|
|
|
|
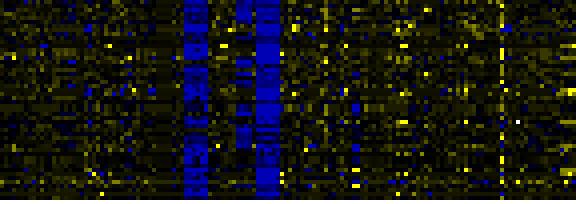
| Pathways co-expressed in the Mutant data set (with more than 10 annotation points) |
|
CYP71B37 (At3g26330) |
|
|
|
|
|
|
|
|
| max. difference between log2-ratios: |
3.7 |
|
|
|
|
|
|
|
|
|
|
|
|
| max. difference between log2-ratios excluding lowest and highest 5%: |
2.8 |
|
|
|
|
|
|
|
|
|
|
|
|
| Pathway |
Source |
Scores of Genes |
p[Score] |
No. of Genes |
p[genes] |
Link to mutants heatmap |
|
|
|
|
|
|
|
| C-compound and carbohydrate metabolism |
FunCat |
42 |
0.001 |
5 |
0.243 |
|
|
|
|
| Ribosome |
KEGG |
40 |
0.000 |
7 |
0.010 |
|
|
|
| Intermediary Carbon Metabolism |
BioPath |
36 |
0.000 |
4 |
0.022 |
|
|
|
| glycolysis and gluconeogenesis |
FunCat |
36 |
0.000 |
4 |
0.038 |
|
|
|
| Glycolysis / Gluconeogenesis |
KEGG |
26 |
0.000 |
3 |
0.013 |
|
|
|
| Photosystems |
BioPath |
22 |
0.000 |
3 |
0.024 |
|
|
|
| isoprenoid biosynthesis |
FunCat |
19 |
0.000 |
4 |
0.003 |
|
|
|
| lipid, fatty acid and isoprenoid biosynthesis |
FunCat |
19 |
0.000 |
4 |
0.001 |
|
|
|
| acetate fermentation |
AraCyc |
18 |
0.000 |
3 |
0.001 |
|
|
|
| additional photosystem II components |
BioPath |
16 |
0.000 |
2 |
0.007 |
|
|
|
| ATP synthase components |
BioPath |
16 |
0.000 |
2 |
0.000 |
|
|
|
| Gluconeogenesis from lipids in seeds |
BioPath |
16 |
0.000 |
2 |
0.033 |
|
|
|
| ATP synthesis coupled proton transport |
TAIR-GO |
16 |
0.000 |
2 |
0.000 |
|
|
|
|
|
|
|
|
|
|
|
| proton transport |
TAIR-GO |
16 |
0.000 |
2 |
0.000 |
|
|
|
|
|
|
|
|
|
|
|
| fructose degradation (anaerobic) |
AraCyc |
16 |
0.000 |
2 |
0.010 |
|
|
|
|
|
|
|
|
|
|
|
| gluconeogenesis |
AraCyc |
16 |
0.000 |
2 |
0.004 |
|
|
|
|
|
|
|
|
|
|
|
| glyceraldehyde 3-phosphate degradation |
AraCyc |
16 |
0.000 |
2 |
0.001 |
|
|
|
|
|
|
|
|
|
|
|
| glycerol degradation II |
AraCyc |
16 |
0.000 |
2 |
0.004 |
|
|
|
|
|
|
|
|
|
|
|
| glycolysis I |
AraCyc |
16 |
0.000 |
2 |
0.064 |
|
|
|
|
|
|
|
|
|
|
|
| glycolysis IV |
AraCyc |
16 |
0.000 |
2 |
0.011 |
|
|
|
|
|
|
|
|
|
|
|
| sorbitol fermentation |
AraCyc |
16 |
0.000 |
2 |
0.012 |
|
|
|
|
|
|
|
|
|
|
|
| triterpene, sterol, and brassinosteroid metabolism |
LitPath |
15 |
0.000 |
3 |
0.007 |
|
|
|
|
|
|
|
|
|
|
|
| Phytic acid biosynthesis |
BioPath |
14 |
0.000 |
2 |
0.002 |
|
|
|
|
|
|
|
|
|
|
|
| lipases pathway |
AraCyc |
14 |
0.000 |
2 |
0.001 |
|
|
|
|
|
|
|
|
|
|
|
| lipid, fatty acid and isoprenoid degradation |
FunCat |
14 |
0.000 |
2 |
0.009 |
|
|
|
|
|
|
|
|
|
|
|
| Lipid signaling |
AcylLipid |
14 |
0.000 |
2 |
0.242 |
|
|
|
|
|
|
|
|
|
|
|
| Biosynthesis of steroids |
KEGG |
13 |
0.001 |
2 |
0.017 |
|
|
|
|
|
|
|
|
|
|
|
| triterpene biosynthesis |
LitPath |
13 |
0.000 |
2 |
0.000 |
|
|
|
|
|
|
|
|
|
|
|
| transport |
FunCat |
12 |
0.000 |
2 |
0.000 |
|
|
|
|
|
|
|
|
|
|
|
| transport facilitation |
FunCat |
12 |
0.000 |
2 |
0.000 |
|
|
|
|
|
|
|
|
|
|
|
| Transcription |
KEGG |
11 |
0.002 |
2 |
0.065 |
|
|
|
|
|
|
|
|
|
|
|
|
|
|
|
|
|
|
|
|
|
|
|
|
|
|
|
|