|
|
|
|
|
|
|
|
|
|
|
|
|
|
|
|
|
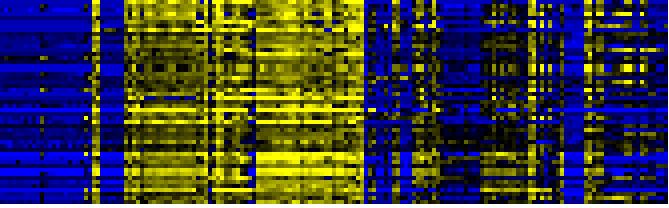
| Pathways co-expressed in the Organ and Tissue data set (with more than 10 annotation points) |
|
CYP71B4 (At3g26280) |
|
|
|
|
|
|
|
|
| max. difference between log2-ratios: |
7.3 |
|
|
|
|
|
|
|
|
|
|
|
|
| max. difference between log2-ratios excluding lowest and highest 5%: |
6.0 |
|
|
|
|
|
|
|
|
|
|
|
|
| Pathway |
Source |
Scores of Genes |
p[Score] |
No. of Genes |
p[genes] |
Link to organ heatmap |
|
|
|
|
|
|
|
| C-compound and carbohydrate metabolism |
FunCat |
69 |
0.001 |
13 |
0.067 |
|
|
|
| Plastidial Isoprenoids (Chlorophylls, Carotenoids, Tocopherols, Plastoquinone, Phylloquinone) |
BioPath |
58 |
0.000 |
8 |
0.017 |
|
|
| biogenesis of chloroplast |
FunCat |
56 |
0.000 |
9 |
0.000 |
|
|
| Carbon fixation |
KEGG |
55 |
0.000 |
8 |
0.000 |
|
|
| Carotenoid and abscisic acid metabolism |
LitPath |
55 |
0.000 |
8 |
0.000 |
|
|
| Intermediary Carbon Metabolism |
BioPath |
54 |
0.037 |
9 |
0.223 |
|
|
| Photosystems |
BioPath |
50 |
0.009 |
8 |
0.067 |
|
|
| photosynthesis |
FunCat |
45 |
0.000 |
7 |
0.000 |
|
|
| Carotenoid biosynthesis |
BioPath |
44 |
0.000 |
5 |
0.000 |
|
|
| carotenoid biosynthesis |
AraCyc |
44 |
0.000 |
5 |
0.000 |
|
|
| carotenid biosynthesis |
LitPath |
44 |
0.000 |
5 |
0.000 |
|
|
| Chloroplastic protein turnover |
BioPath |
40 |
0.000 |
7 |
0.000 |
|
|
| Calvin cycle |
AraCyc |
40 |
0.000 |
6 |
0.001 |
|
|
| glycolysis and gluconeogenesis |
FunCat |
38 |
0.001 |
6 |
0.109 |
|
|
|
|
|
|
|
|
|
|
|
| Biosynthesis of steroids |
KEGG |
36 |
0.000 |
5 |
0.001 |
|
|
|
|
|
|
|
|
|
|
|
| Miscellaneous acyl lipid metabolism |
AcylLipid |
36 |
0.001 |
7 |
0.139 |
|
|
|
|
|
|
|
|
|
|
|
| ATP-dependent proteolysis |
TAIR-GO |
34 |
0.000 |
7 |
0.000 |
|
|
|
|
|
|
|
|
|
|
|
| photorespiration |
AraCyc |
34 |
0.000 |
7 |
0.000 |
|
|
|
|
|
|
|
|
|
|
|
| Folding, Sorting and Degradation |
KEGG |
33 |
0.000 |
4 |
0.127 |
|
|
|
|
|
|
|
|
|
|
|
| additional photosystem II components |
BioPath |
31 |
0.000 |
5 |
0.010 |
|
|
|
|
|
|
|
|
|
|
|
| Leaf Glycerolipid Biosynthesis in Plastid |
BioPath |
28 |
0.039 |
3 |
0.295 |
|
|
|
|
|
|
|
|
|
|
|
| jasmonic acid biosynthesis |
TAIR-GO |
28 |
0.000 |
4 |
0.001 |
|
|
|
|
|
|
|
|
|
|
|
| photorespiration |
TAIR-GO |
28 |
0.000 |
4 |
0.000 |
|
|
|
|
|
|
|
|
|
|
|
| jasmonic acid biosynthesis |
AraCyc |
28 |
0.000 |
4 |
0.001 |
|
|
|
|
|
|
|
|
|
|
|
| Glycolysis / Gluconeogenesis |
KEGG |
28 |
0.000 |
5 |
0.012 |
|
|
|
|
|
|
|
|
|
|
|
| starch metabolism |
BioPath |
26 |
0.000 |
4 |
0.013 |
|
|
|
|
|
|
|
|
|
|
|
| energy |
FunCat |
26 |
0.000 |
4 |
0.000 |
|
|
|
|
|
|
|
|
|
|
|
| Pentose phosphate pathway |
KEGG |
26 |
0.000 |
4 |
0.003 |
|
|
|
|
|
|
|
|
|
|
|
| Chlorophyll a/b binding proteins |
BioPath |
24 |
0.000 |
3 |
0.011 |
|
|
|
|
|
|
|
|
|
|
|
| photosystem I |
TAIR-GO |
24 |
0.000 |
3 |
0.000 |
|
|
|
|
|
|
|
|
|
|
|
| glycine biosynthesis I |
AraCyc |
24 |
0.000 |
5 |
0.008 |
|
|
|
|
|
|
|
|
|
|
|
| superpathway of serine and glycine biosynthesis II |
AraCyc |
24 |
0.000 |
5 |
0.000 |
|
|
|
|
|
|
|
|
|
|
|
| degradation |
FunCat |
21 |
0.000 |
4 |
0.002 |
|
|
|
|
|
|
|
|
|
|
|
| protein degradation |
FunCat |
21 |
0.000 |
4 |
0.000 |
|
|
|
|
|
|
|
|
|
|
|
| ClpP protease complex |
BioPath |
20 |
0.000 |
5 |
0.000 |
|
|
|
|
|
|
|
|
|
|
|
| Pathway for nuclear-encoded, thylakoid-localized proteins |
BioPath |
20 |
0.000 |
2 |
0.022 |
|
|
|
|
|
|
|
|
|
|
|
| Transcriptional regulators (chloroplast) |
BioPath |
20 |
0.000 |
2 |
0.000 |
|
|
|
|
|
|
|
|
|
|
|
| positive regulation of transcription |
TAIR-GO |
20 |
0.000 |
2 |
0.000 |
|
|
|
|
|
|
|
|
|
|
|
| regulation of transcription |
TAIR-GO |
20 |
0.000 |
2 |
0.000 |
|
|
|
|
|
|
|
|
|
|
|
| response to ethylene stimulus |
TAIR-GO |
20 |
0.000 |
5 |
0.000 |
|
|
|
|
|
|
|
|
|
|
|
| gluconeogenesis |
AraCyc |
20 |
0.002 |
3 |
0.113 |
|
|
|
|
|
|
|
|
|
|
|
| Fructose and mannose metabolism |
KEGG |
20 |
0.000 |
3 |
0.027 |
|
|
|
|
|
|
|
|
|
|
|
| Protein export |
KEGG |
20 |
0.000 |
2 |
0.034 |
|
|
|
|
|
|
|
|
|
|
|
| Pyruvate metabolism |
KEGG |
20 |
0.006 |
3 |
0.103 |
|
|
|
|
|
|
|
|
|
|
|
| Thylakoid biogenesis and photosystem assembly |
BioPath |
18 |
0.000 |
2 |
0.003 |
|
|
|
|
|
|
|
|
|
|
|
| carotene biosynthesis |
TAIR-GO |
18 |
0.000 |
2 |
0.000 |
|
|
|
|
|
|
|
|
|
|
|
| lipid biosynthesis |
TAIR-GO |
18 |
0.000 |
2 |
0.001 |
|
|
|
|
|
|
|
|
|
|
|
| glycosylglyceride biosynthesis |
AraCyc |
18 |
0.000 |
2 |
0.002 |
|
|
|
|
|
|
|
|
|
|
|
| xanthophyll cycle |
AraCyc |
18 |
0.000 |
2 |
0.000 |
|
|
|
|
|
|
|
|
|
|
|
| lipid, fatty acid and isoprenoid biosynthesis |
FunCat |
18 |
0.020 |
2 |
0.278 |
|
|
|
|
|
|
|
|
|
|
|
| Synthesis of membrane lipids in plastids |
AcylLipid |
18 |
0.000 |
2 |
0.034 |
|
|
|
|
|
|
|
|
|
|
|
|
|
|
|
|
|
|
|
|
|
|
|
|
|
|
|
|
|
|
|
|
|
|
|
|
|
|
|
|
|
|
|
|
|
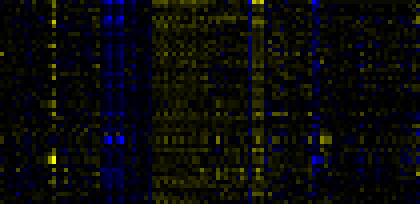
| Pathways co-expressed in the Hormone etc. data set (with more than 10 annotation points) |
|
CYP71B4 (At3g26280) |
|
|
|
|
|
|
|
|
| max. difference between log2-ratios: |
7.4 |
|
|
|
|
|
|
|
|
|
|
|
|
| max. difference between log2-ratios excluding lowest and highest 5%: |
2.5 |
|
|
|
|
|
|
|
|
|
|
|
|
| Pathway |
Source |
Scores of Genes |
p[Score] |
No. of Genes |
p[genes] |
Link to hormones etc. heatmap |
|
|
|
|
|
|
|
| Biosynthesis of Amino Acids and Derivatives |
BioPath |
46 |
0.000 |
6 |
0.005 |
|
|
|
|
|
|
| Pyruvate metabolism |
KEGG |
28 |
0.000 |
4 |
0.021 |
|
|
|
|
|
| Glutathione metabolism |
BioPath |
26 |
0.000 |
4 |
0.002 |
|
|
|
|
|
| Intermediary Carbon Metabolism |
BioPath |
24 |
0.001 |
3 |
0.149 |
|
|
|
|
|
| response to water deprivation |
TAIR-GO |
24 |
0.000 |
3 |
0.000 |
|
|
|
|
|
| Miscellaneous acyl lipid metabolism |
AcylLipid |
24 |
0.000 |
4 |
0.100 |
|
|
|
|
|
| beta-Alanine metabolism |
KEGG |
23 |
0.000 |
3 |
0.001 |
|
|
|
|
|
| Glutathione metabolism |
KEGG |
22 |
0.000 |
3 |
0.013 |
|
|
|
|
|
| Urea cycle and metabolism of amino groups |
KEGG |
22 |
0.000 |
3 |
0.002 |
|
|
|
|
|
| Prolin/Hydroxyproline from glutamate |
BioPath |
20 |
0.000 |
2 |
0.000 |
|
|
|
|
|
| hyperosmotic salinity response |
TAIR-GO |
20 |
0.000 |
2 |
0.000 |
|
|
|
|
|
| proline biosynthesis |
TAIR-GO |
20 |
0.000 |
2 |
0.000 |
|
|
|
|
|
| response to abscisic acid stimulus |
TAIR-GO |
20 |
0.000 |
2 |
0.001 |
|
|
|
|
|
| amino acid metabolism |
FunCat |
20 |
0.002 |
3 |
0.041 |
|
|
|
|
|
|
|
|
|
|
|
| Arginine and proline metabolism |
KEGG |
20 |
0.000 |
3 |
0.013 |
|
|
|
|
|
|
|
|
|
|
|
| Plastidial Isoprenoids (Chlorophylls, Carotenoids, Tocopherols, Plastoquinone, Phylloquinone) |
BioPath |
19 |
0.002 |
3 |
0.022 |
|
|
|
|
|
|
|
|
|
|
|
| Basal transcription factors |
KEGG |
19 |
0.000 |
3 |
0.007 |
|
|
|
|
|
|
|
|
|
|
|
| Transcription |
KEGG |
19 |
0.000 |
3 |
0.089 |
|
|
|
|
|
|
|
|
|
|
|
| Butanoate metabolism |
KEGG |
18 |
0.000 |
2 |
0.017 |
|
|
|
|
|
|
|
|
|
|
|
| Glycolysis / Gluconeogenesis |
KEGG |
18 |
0.015 |
2 |
0.241 |
|
|
|
|
|
|
|
|
|
|
|
| tricarboxylic-acid pathway (citrate cycle, Krebs cycle, TCA cycle) |
FunCat |
16 |
0.003 |
2 |
0.138 |
|
|
|
|
|
|
|
|
|
|
|
| Gluconeogenesis from lipids in seeds |
BioPath |
15 |
0.000 |
2 |
0.059 |
|
|
|
|
|
|
|
|
|
|
|
| Nucleotide Metabolism |
KEGG |
15 |
0.035 |
2 |
0.235 |
|
|
|
|
|
|
|
|
|
|
|
| Pantothenate and CoA biosynthesis |
KEGG |
15 |
0.000 |
2 |
0.009 |
|
|
|
|
|
|
|
|
|
|
|
| Pyrimidine metabolism |
KEGG |
15 |
0.000 |
2 |
0.057 |
|
|
|
|
|
|
|
|
|
|
|
| toxin catabolism |
TAIR-GO |
14 |
0.000 |
3 |
0.006 |
|
|
|
|
|
|
|
|
|
|
|
| phenylalanine degradation I |
AraCyc |
14 |
0.000 |
3 |
0.003 |
|
|
|
|
|
|
|
|
|
|
|
| threonine degradation |
AraCyc |
14 |
0.000 |
5 |
0.000 |
|
|
|
|
|
|
|
|
|
|
|
| Carotenoid and abscisic acid metabolism |
LitPath |
14 |
0.000 |
2 |
0.002 |
|
|
|
|
|
|
|
|
|
|
|
| carbon monoxide dehydrogenase pathway |
AraCyc |
13 |
0.000 |
2 |
0.023 |
|
|
|
|
|
|
|
|
|
|
|
| Degradation of storage lipids and straight fatty acids |
AcylLipid |
13 |
0.000 |
3 |
0.004 |
|
|
|
|
|
|
|
|
|
|
|
| aspartate degradation I |
AraCyc |
12 |
0.000 |
2 |
0.019 |
|
|
|
|
|
|
|
|
|
|
|
| aspartate degradation II |
AraCyc |
12 |
0.000 |
2 |
0.005 |
|
|
|
|
|
|
|
|
|
|
|
| methylglyoxal degradation |
AraCyc |
12 |
0.000 |
4 |
0.000 |
|
|
|
|
|
|
|
|
|
|
|
| biosynthesis of phenylpropanoids |
FunCat |
12 |
0.000 |
2 |
0.009 |
|
|
|
|
|
|
|
|
|
|
|
| biosynthesis of secondary products derived from L-phenylalanine and L-tyrosine |
FunCat |
12 |
0.000 |
2 |
0.009 |
|
|
|
|
|
|
|
|
|
|
|
| Glycerolipid metabolism |
KEGG |
12 |
0.005 |
2 |
0.035 |
|
|
|
|
|
|
|
|
|
|
|
| Tyrosine metabolism |
KEGG |
12 |
0.007 |
2 |
0.057 |
|
|
|
|
|
|
|
|
|
|
|
| Biosynthesis of prenyl diphosphates |
BioPath |
11 |
0.004 |
2 |
0.019 |
|
|
|
|
|
|
|
|
|
|
|
| core phenylpropanoid metabolism |
BioPath |
10 |
0.005 |
1 |
0.118 |
|
|
|
|
|
|
|
|
|
|
|
| acyl-CoA binding |
TAIR-GO |
10 |
0.000 |
1 |
0.000 |
|
|
|
|
|
|
|
|
|
|
|
| lignin biosynthesis |
TAIR-GO |
10 |
0.000 |
1 |
0.009 |
|
|
|
|
|
|
|
|
|
|
|
| lipid transport |
TAIR-GO |
10 |
0.000 |
1 |
0.005 |
|
|
|
|
|
|
|
|
|
|
|
| response to dessication |
TAIR-GO |
10 |
0.000 |
1 |
0.002 |
|
|
|
|
|
|
|
|
|
|
|
| lignin biosynthesis |
AraCyc |
10 |
0.020 |
1 |
0.253 |
|
|
|
|
|
|
|
|
|
|
|
| biogenesis of chloroplast |
FunCat |
10 |
0.037 |
2 |
0.042 |
|
|
|
|
|
|
|
|
|
|
|
| cellular sensing and response |
FunCat |
10 |
0.000 |
1 |
0.000 |
|
|
|
|
|
|
|
|
|
|
|
| chemoperception and response |
FunCat |
10 |
0.000 |
1 |
0.000 |
|
|
|
|
|
|
|
|
|
|
|
| osmosensing |
FunCat |
10 |
0.000 |
1 |
0.000 |
|
|
|
|
|
|
|
|
|
|
|
| Cysteine metabolism |
KEGG |
10 |
0.007 |
2 |
0.021 |
|
|
|
|
|
|
|
|
|
|
|
|
|
|
|
|
|
|
|
|
|
|
|
|
|
|
|
|
|
|
|
|
|
|
|
|
|
|
|
|
|
|
|
|
|
|
|
|
|
|
|
|
|
|
|
|
|
|
|
|
|
|
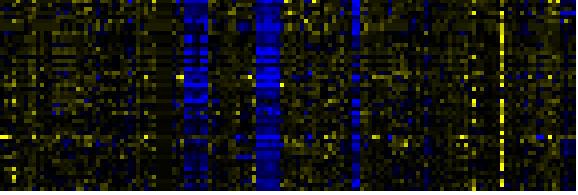
| Pathways co-expressed in the Mutant data set (with more than 10 annotation points) |
|
CYP71B4 (At3g26280) |
|
|
|
|
|
|
|
|
| max. difference between log2-ratios: |
7.9 |
|
|
|
|
|
|
|
|
|
|
|
|
| max. difference between log2-ratios excluding lowest and highest 5%: |
4.0 |
|
|
|
|
|
|
|
|
|
|
|
|
| Pathway |
Source |
Scores of Genes |
p[Score] |
No. of Genes |
p[genes] |
Link to mutants heatmap |
|
|
|
|
|
|
|
| C-compound and carbohydrate metabolism |
FunCat |
46 |
0.000 |
6 |
0.144 |
|
|
|
|
| glycolysis and gluconeogenesis |
FunCat |
46 |
0.000 |
6 |
0.003 |
|
|
|
| Intermediary Carbon Metabolism |
BioPath |
42 |
0.000 |
5 |
0.047 |
|
|
|
| Photosystems |
BioPath |
40 |
0.000 |
5 |
0.008 |
|
|
|
| Biosynthesis of Amino Acids and Derivatives |
BioPath |
36 |
0.000 |
5 |
0.059 |
|
|
|
| Glycolysis / Gluconeogenesis |
KEGG |
26 |
0.000 |
3 |
0.008 |
|
|
|
| additional photosystem II components |
BioPath |
24 |
0.000 |
3 |
0.004 |
|
|
|
| Translation factors |
KEGG |
20.5 |
0.000 |
4 |
0.002 |
|
|
|
| photosynthesis |
FunCat |
20 |
0.000 |
3 |
0.006 |
|
|
|
| protein synthesis |
FunCat |
20 |
0.039 |
3 |
0.154 |
|
|
|
| Pyruvate metabolism |
KEGG |
20 |
0.000 |
2 |
0.039 |
|
|
|
| Valine, leucine and isoleucine biosynthesis |
KEGG |
20 |
0.000 |
2 |
0.004 |
|
|
|
| Gluconeogenesis from lipids in seeds |
BioPath |
18 |
0.000 |
3 |
0.027 |
|
|
|
|
|
|
|
|
|
|
|
| isoprenoid biosynthesis |
FunCat |
18 |
0.000 |
3 |
0.018 |
|
|
|
|
|
|
|
|
|
|
|
| lipid, fatty acid and isoprenoid biosynthesis |
FunCat |
18 |
0.000 |
3 |
0.011 |
|
|
|
|
|
|
|
|
|
|
|
| ATP synthase components |
BioPath |
16 |
0.000 |
2 |
0.001 |
|
|
|
|
|
|
|
|
|
|
|
| Glutathione metabolism |
BioPath |
16 |
0.005 |
3 |
0.028 |
|
|
|
|
|
|
|
|
|
|
|
| ATP synthesis coupled proton transport |
TAIR-GO |
16 |
0.000 |
2 |
0.000 |
|
|
|
|
|
|
|
|
|
|
|
| photosystem I |
TAIR-GO |
16 |
0.000 |
2 |
0.001 |
|
|
|
|
|
|
|
|
|
|
|
| photosystem II |
TAIR-GO |
16 |
0.000 |
2 |
0.000 |
|
|
|
|
|
|
|
|
|
|
|
| proton transport |
TAIR-GO |
16 |
0.000 |
2 |
0.000 |
|
|
|
|
|
|
|
|
|
|
|
| response to heat |
TAIR-GO |
16 |
0.000 |
2 |
0.003 |
|
|
|
|
|
|
|
|
|
|
|
| acetate fermentation |
AraCyc |
16 |
0.000 |
2 |
0.038 |
|
|
|
|
|
|
|
|
|
|
|
| Calvin cycle |
AraCyc |
16 |
0.000 |
2 |
0.008 |
|
|
|
|
|
|
|
|
|
|
|
| fructose degradation (anaerobic) |
AraCyc |
16 |
0.000 |
2 |
0.031 |
|
|
|
|
|
|
|
|
|
|
|
| gluconeogenesis |
AraCyc |
16 |
0.000 |
2 |
0.013 |
|
|
|
|
|
|
|
|
|
|
|
| glyceraldehyde 3-phosphate degradation |
AraCyc |
16 |
0.000 |
2 |
0.002 |
|
|
|
|
|
|
|
|
|
|
|
| glycerol degradation II |
AraCyc |
16 |
0.000 |
2 |
0.013 |
|
|
|
|
|
|
|
|
|
|
|
| glycolysis I |
AraCyc |
16 |
0.002 |
2 |
0.166 |
|
|
|
|
|
|
|
|
|
|
|
| glycolysis IV |
AraCyc |
16 |
0.000 |
2 |
0.033 |
|
|
|
|
|
|
|
|
|
|
|
| sorbitol fermentation |
AraCyc |
16 |
0.000 |
2 |
0.035 |
|
|
|
|
|
|
|
|
|
|
|
| transport |
FunCat |
16 |
0.000 |
2 |
0.000 |
|
|
|
|
|
|
|
|
|
|
|
| transport facilitation |
FunCat |
16 |
0.000 |
2 |
0.000 |
|
|
|
|
|
|
|
|
|
|
|
| Carbon fixation |
KEGG |
16 |
0.000 |
2 |
0.030 |
|
|
|
|
|
|
|
|
|
|
|
| Translation (chloroplast) |
BioPath |
14 |
0.000 |
2 |
0.000 |
|
|
|
|
|
|
|
|
|
|
|
| methionine degradation I |
AraCyc |
14 |
0.000 |
2 |
0.000 |
|
|
|
|
|
|
|
|
|
|
|
| translation |
FunCat |
14 |
0.000 |
2 |
0.004 |
|
|
|
|
|
|
|
|
|
|
|
| Selenoamino acid metabolism |
KEGG |
14 |
0.000 |
2 |
0.004 |
|
|
|
|
|
|
|
|
|
|
|
| Glutathione metabolism |
KEGG |
12 |
0.000 |
2 |
0.009 |
|
|
|
|
|
|
|
|
|
|
|
| Branched-chain amino acids from aspartate |
BioPath |
10 |
0.000 |
1 |
0.066 |
|
|
|
|
|
|
|
|
|
|
|
| core phenylpropanoid metabolism |
BioPath |
10 |
0.032 |
1 |
0.177 |
|
|
|
|
|
|
|
|
|
|
|
| Cytochrome b6/f complex |
BioPath |
10 |
0.000 |
1 |
0.009 |
|
|
|
|
|
|
|
|
|
|
|
| Methionin/SAM/ethylene metabolism from cysteine and aspartate |
BioPath |
10 |
0.002 |
1 |
0.091 |
|
|
|
|
|
|
|
|
|
|
|
| cytochrome b6f complex |
TAIR-GO |
10 |
0.000 |
1 |
0.009 |
|
|
|
|
|
|
|
|
|
|
|
| electron transport |
TAIR-GO |
10 |
0.001 |
1 |
0.093 |
|
|
|
|
|
|
|
|
|
|
|
| glucosinolate biosynthesis |
TAIR-GO |
10 |
0.000 |
1 |
0.017 |
|
|
|
|
|
|
|
|
|
|
|
| glycolysis |
TAIR-GO |
10 |
0.000 |
1 |
0.001 |
|
|
|
|
|
|
|
|
|
|
|
| hypersensitive response |
TAIR-GO |
10 |
0.000 |
1 |
0.009 |
|
|
|
|
|
|
|
|
|
|
|
| methylation-dependent chromatin silencing |
TAIR-GO |
10 |
0.000 |
1 |
0.000 |
|
|
|
|
|
|
|
|
|
|
|
| nonphotochemical quenching |
TAIR-GO |
10 |
0.000 |
1 |
0.001 |
|
|
|
|
|
|
|
|
|
|
|
|
|
|
|
|
|
|
|
|
|
|
|
|
|
|
|
|