|
|
|
|
|
|
|
|
|
|
|
|
|
|
|
|
|
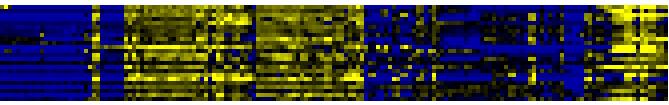
| Pathways co-expressed in the Organ and Tissue data set (with more than 6 annotation points) |
|
CYP71B5 (At3g53280) |
|
|
|
|
|
|
|
|
| max. difference between log2-ratios: |
6.1 |
|
|
|
|
|
|
|
|
|
|
|
|
| max. difference between log2-ratios excluding lowest and highest 5%: |
4.4 |
|
|
|
|
|
|
|
|
|
|
|
|
| Pathway |
Source |
Scores of Genes |
p[Score] |
No. of Genes |
p[genes] |
Link to organ heatmap |
|
|
|
|
|
|
|
| Phenylpropanoid Metabolism |
BioPath |
21 |
0.000 |
3 |
0.010 |
|
|
|
| biogenesis of chloroplast |
FunCat |
18 |
0.000 |
3 |
0.000 |
|
|
| Aromatic amino acid (Phe, Tyr, Trp) metabolism |
BioPath |
10 |
0.000 |
1 |
0.033 |
|
|
| Glucosyltransferases for benzoic acids |
BioPath |
10 |
0.000 |
1 |
0.002 |
|
|
| aromatic amino acid family biosynthesis |
TAIR-GO |
10 |
0.000 |
1 |
0.001 |
|
|
| aromatic amino acid family biosynthesis, shikimate pathway |
TAIR-GO |
10 |
0.000 |
1 |
0.001 |
|
|
| amino acid metabolism |
FunCat |
10 |
0.000 |
1 |
0.096 |
|
|
| Phenylalanine, tyrosine and tryptophan biosynthesis |
KEGG |
10 |
0.000 |
1 |
0.026 |
|
|
|
|
|
|
|
|
|
|
|
| chorismate biosynthesis |
LitPath |
10 |
0.000 |
1 |
0.004 |
|
|
|
|
|
|
|
|
|
|
|
| Shikimate pathway |
LitPath |
10 |
0.000 |
1 |
0.030 |
|
|
|
|
|
|
|
|
|
|
|
| C-compound and carbohydrate metabolism |
FunCat |
9 |
0.042 |
3 |
0.040 |
|
|
|
|
|
|
|
|
|
|
|
| ascorbic acid biosynthesis |
BioPath |
8 |
0.000 |
1 |
0.005 |
|
|
|
|
|
|
|
|
|
|
|
| Chloroplastic protein turnover |
BioPath |
8 |
0.000 |
2 |
0.000 |
|
|
|
|
|
|
|
|
|
|
|
| ClpP protease complex |
BioPath |
8 |
0.000 |
2 |
0.000 |
|
|
|
|
|
|
|
|
|
|
|
| ATP-dependent proteolysis |
TAIR-GO |
8 |
0.000 |
2 |
0.000 |
|
|
|
|
|
|
|
|
|
|
|
| degradation |
FunCat |
8 |
0.000 |
2 |
0.000 |
|
|
|
|
|
|
|
|
|
|
|
| protein degradation |
FunCat |
8 |
0.000 |
2 |
0.000 |
|
|
|
|
|
|
|
|
|
|
|
| Methane metabolism |
KEGG |
8 |
0.000 |
2 |
0.011 |
|
|
|
|
|
|
|
|
|
|
|
|
|
|
|
|
|
|
|
|
|
|
|
|
|
|
|
|
|
|
|
|
|
|
|
|
|
|
|
|
|
|
|
|
|
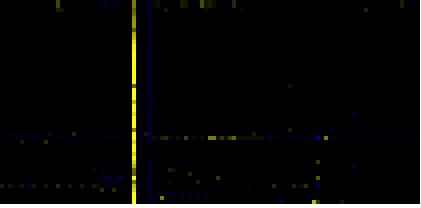
| Pathways co-expressed in the Stress data set ( with more than 6 annotation points) |
|
CYP71B5 (At3g53280) |
|
|
|
|
|
|
|
|
| max. difference between log2-ratios: |
1.2 |
|
|
|
|
|
|
|
|
|
|
|
|
| max. difference between log2-ratios excluding lowest and highest 5%: |
0.2 |
|
|
|
|
|
|
|
|
|
|
|
|
| Pathway |
Source |
Scores of Genes |
p[Score] |
No. of Genes |
p[genes] |
Link to stress heatmap |
|
|
|
|
|
|
|
| nucleotide metabolism |
FunCat |
16 |
0.000 |
4 |
0.000 |

|
| (deoxy)ribose phosphate degradation |
AraCyc |
14 |
0.000 |
3 |
0.000 |
| pyrimidine nucleotide metabolism |
FunCat |
14 |
0.000 |
3 |
0.000 |
| Nucleotide Metabolism |
KEGG |
14 |
0.000 |
3 |
0.001 |
| Pyrimidine metabolism |
KEGG |
14 |
0.000 |
3 |
0.000 |
| secondary metabolism |
FunCat |
11 |
0.000 |
2 |
0.013 |
| Cell Wall Carbohydrate Metabolism |
BioPath |
10 |
0.000 |
4 |
0.023 |
| gibberellic acid biosynthesis |
TAIR-GO |
10 |
0.000 |
1 |
0.000 |
|
|
|
|
|
|
|
|
|
|
|
| gibberellin biosynthesis |
AraCyc |
10 |
0.000 |
1 |
0.000 |
|
|
|
|
|
|
|
|
|
|
|
| plant / fungal specific systemic sensing and response |
FunCat |
10 |
0.000 |
1 |
0.010 |
|
|
|
|
|
|
|
|
|
|
|
| plant hormonal regulation |
FunCat |
10 |
0.000 |
1 |
0.010 |
|
|
|
|
|
|
|
|
|
|
|
| Diterpenoid biosynthesis |
KEGG |
10 |
0.000 |
1 |
0.003 |
|
|
|
|
|
|
|
|
|
|
|
| Gibberellin metabolism |
LitPath |
10 |
0.000 |
1 |
0.028 |
|
|
|
|
|
|
|
|
|
|
|
| giberelin biosynthesis |
LitPath |
10 |
0.000 |
1 |
0.017 |
|
|
|
|
|
|
|
|
|
|
|
| Intermediary Carbon Metabolism |
BioPath |
8 |
0.000 |
2 |
0.046 |
|
|
|
|
|
|
|
|
|
|
|
| iron-sulfur cluster assembly |
TAIR-GO |
7 |
0.000 |
1 |
0.000 |
|
|
|
|
|
|
|
|
|
|
|
| Nitrogen metabolism |
KEGG |
7 |
0.000 |
1 |
0.017 |
|
|
|
|
|
|
|
|
|
|
|
| Carotenoid and abscisic acid metabolism |
LitPath |
7 |
0.000 |
2 |
0.004 |
|
|
|
|
|
|
|
|
|
|
|
|
|
|
|
|
|
|
|
|
|
|
|
|
|
|
|
|
|
|
|
|
|
|
|
|
|
|
|
|
|
|
|
|
|
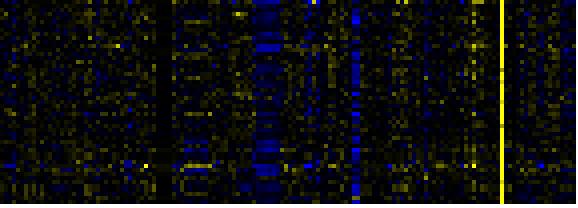
| Pathways co-expressed in the Hormone etc. data set (with more than 6 annotation points) |
|
CYP71B5 (At3g53280) |
|
|
|
|
|
|
|
|
| max. difference between log2-ratios: |
1.9 |
|
|
|
|
|
|
|
|
|
|
|
|
| max. difference between log2-ratios excluding lowest and highest 5%: |
0.5 |
|
|
|
|
|
|
|
|
|
|
|
|
| Pathway |
Source |
Scores of Genes |
p[Score] |
No. of Genes |
p[genes] |
Link to hormones etc. heatmap |
|
|
|
|
|
|
|
| Cell Wall Carbohydrate Metabolism |
BioPath |
91 |
0.000 |
22 |
0.000 |
|
|
|
|
|
|
| pectin metabolism |
BioPath |
69 |
0.000 |
18 |
0.000 |
|
|
|
|
|
| mono-/sesqui-/di-terpene biosynthesis |
LitPath |
54 |
0.000 |
6 |
0.000 |
|
|
|
|
|
| terpenoid metabolism |
LitPath |
54 |
0.000 |
6 |
0.000 |
|
|
|
|
|
| Miscellaneous acyl lipid metabolism |
AcylLipid |
44 |
0.000 |
16 |
0.000 |
|
|
|
|
|
| Starch and sucrose metabolism |
KEGG |
42 |
0.000 |
6 |
0.000 |
|
|
|
|
|
| sexual reproduction |
TAIR-GO |
20 |
0.000 |
5 |
0.000 |
|
|
|
|
|
| monoterpene biosynthesis |
LitPath |
20 |
0.000 |
2 |
0.000 |
|
|
|
|
|
| sucrose metabolism |
BioPath |
16 |
0.000 |
2 |
0.004 |
|
|
|
|
|
| Galactose metabolism |
KEGG |
16 |
0.000 |
2 |
0.003 |
|
|
|
|
|
| biogenesis of cell wall |
FunCat |
14 |
0.000 |
6 |
0.000 |
|
|
|
|
|
| C-compound and carbohydrate utilization |
FunCat |
14 |
0.000 |
2 |
0.000 |
|
|
|
|
|
| jasmonic acid biosynthesis |
TAIR-GO |
10 |
0.000 |
1 |
0.017 |
|
|
|
|
|
| jasmonic acid mediated signaling pathway |
TAIR-GO |
10 |
0.000 |
1 |
0.000 |
|
|
|
|
|
|
|
|
|
|
|
| jasmonic acid metabolism |
TAIR-GO |
10 |
0.000 |
1 |
0.000 |
|
|
|
|
|
|
|
|
|
|
|
| monoterpenoid biosynthesis |
TAIR-GO |
10 |
0.000 |
1 |
0.001 |
|
|
|
|
|
|
|
|
|
|
|
| N-terminal protein myristoylation |
TAIR-GO |
10 |
0.000 |
1 |
0.006 |
|
|
|
|
|
|
|
|
|
|
|
| pentacyclic triterpenoid biosynthesis |
TAIR-GO |
10 |
0.000 |
1 |
0.003 |
|
|
|
|
|
|
|
|
|
|
|
| response to wounding |
TAIR-GO |
10 |
0.000 |
1 |
0.022 |
|
|
|
|
|
|
|
|
|
|
|
| jasmonic acid biosynthesis |
AraCyc |
10 |
0.000 |
1 |
0.001 |
|
|
|
|
|
|
|
|
|
|
|
| monoterpene biosynthesis |
AraCyc |
10 |
0.000 |
1 |
0.000 |
|
|
|
|
|
|
|
|
|
|
|
| plant monoterpene biosynthesis |
AraCyc |
10 |
0.000 |
1 |
0.000 |
|
|
|
|
|
|
|
|
|
|
|
| C-compound, carbohydrate catabolism |
FunCat |
10 |
0.000 |
3 |
0.002 |
|
|
|
|
|
|
|
|
|
|
|
| Biosynthesis of steroids |
KEGG |
10 |
0.000 |
1 |
0.067 |
|
|
|
|
|
|
|
|
|
|
|
| sequiterpene biosynthesis |
LitPath |
10 |
0.000 |
1 |
0.001 |
|
|
|
|
|
|
|
|
|
|
|
| triterpene biosynthesis |
LitPath |
10 |
0.000 |
1 |
0.032 |
|
|
|
|
|
|
|
|
|
|
|
| cellulose biosynthesis |
AraCyc |
8 |
0.000 |
2 |
0.000 |
|
|
|
|
|
|
|
|
|
|
|
| lactose degradation IV |
AraCyc |
8 |
0.000 |
2 |
0.000 |
|
|
|
|
|
|
|
|
|
|
|
| Oxidative phosphorylation |
KEGG |
8 |
0.000 |
2 |
0.029 |
|
|
|
|
|
|
|
|
|
|
|
| Pentose and glucuronate interconversions |
KEGG |
8 |
0.000 |
2 |
0.000 |
|
|
|
|
|
|
|
|
|
|
|
|
|
|
|
|
|
|
|
|
|
|
|
|
|
|
|
|
|
|
|
|
|
|
|
|
|
|
|
|
|
|
|
|
|
|
|
|
|
|
|
|
|
|
|
|
|
|
|
|
|
|
| Pathways co-expressed in the Mutant data set (with more than 8 annotation points) |
|
CYP71B5 (At3g53280) |
|
|
|
|
|
|
|
|
| max. difference between log2-ratios: |
8.8 |
|
|
|
|
|
|
|
|
|
|
|
|
| max. difference between log2-ratios excluding lowest and highest 5%: |
2.8 |
|
|
|
|
|
|
|
|
|
|
|
|
| Pathway |
Source |
Scores of Genes |
p[Score] |
No. of Genes |
p[genes] |
Link to mutants heatmap |
|
|
|
|
|
|
|
| Lipid signaling |
AcylLipid |
21 |
0.000 |
7 |
0.001 |
|
|
|
|
| Plastidial Isoprenoids (Chlorophylls, Carotenoids, Tocopherols, Plastoquinone, Phylloquinone) |
BioPath |
19 |
0.001 |
3 |
0.035 |
|
|
|
| indoleacetic acid biosynthesis |
TAIR-GO |
18 |
0.000 |
2 |
0.000 |
|
|
|
| IAA biosynthesis |
AraCyc |
18 |
0.000 |
2 |
0.002 |
|
|
|
| IAA biosynthesis I |
AraCyc |
18 |
0.000 |
2 |
0.001 |
|
|
|
| plant / fungal specific systemic sensing and response |
FunCat |
18 |
0.000 |
2 |
0.003 |
|
|
|
| plant hormonal regulation |
FunCat |
18 |
0.000 |
2 |
0.003 |
|
|
|
| Gluconeogenesis from lipids in seeds |
BioPath |
17 |
0.000 |
3 |
0.018 |
|
|
|
| acetyl-CoA assimilation |
AraCyc |
16 |
0.000 |
2 |
0.035 |
|
|
|
| glyoxylate cycle |
AraCyc |
16 |
0.000 |
2 |
0.015 |
|
|
|
| serine-isocitrate lyase pathway |
AraCyc |
16 |
0.000 |
2 |
0.082 |
|
|
|
| TCA cycle -- aerobic respiration |
AraCyc |
16 |
0.000 |
2 |
0.091 |
|
|
|
| TCA cycle variation VII |
AraCyc |
16 |
0.010 |
2 |
0.213 |
|
|
|
| TCA cycle variation VIII |
AraCyc |
16 |
0.000 |
2 |
0.100 |
|
|
|
|
|
|
|
|
|
|
|
| Citrate cycle (TCA cycle) |
KEGG |
16 |
0.000 |
2 |
0.035 |
|
|
|
|
|
|
|
|
|
|
|
| Glyoxylate and dicarboxylate metabolism |
KEGG |
16 |
0.000 |
2 |
0.013 |
|
|
|
|
|
|
|
|
|
|
|
| Reductive carboxylate cycle (CO2 fixation) |
KEGG |
16 |
0.000 |
2 |
0.005 |
|
|
|
|
|
|
|
|
|
|
|
| Carbon fixation |
KEGG |
15 |
0.000 |
2 |
0.107 |
|
|
|
|
|
|
|
|
|
|
|
| ATP-dependent proteolysis |
TAIR-GO |
14 |
0.000 |
2 |
0.002 |
|
|
|
|
|
|
|
|
|
|
|
| development |
TAIR-GO |
13 |
0.000 |
2 |
0.045 |
|
|
|
|
|
|
|
|
|
|
|
| glycine biosynthesis I |
AraCyc |
13 |
0.000 |
3 |
0.016 |
|
|
|
|
|
|
|
|
|
|
|
| photorespiration |
AraCyc |
13 |
0.000 |
3 |
0.007 |
|
|
|
|
|
|
|
|
|
|
|
| superpathway of serine and glycine biosynthesis II |
AraCyc |
13 |
0.000 |
3 |
0.001 |
|
|
|
|
|
|
|
|
|
|
|
| Ascorbate and aldarate metabolism |
KEGG |
13 |
0.000 |
3 |
0.001 |
|
|
|
|
|
|
|
|
|
|
|
| Benzoate degradation via CoA ligation |
KEGG |
13 |
0.003 |
3 |
0.072 |
|
|
|
|
|
|
|
|
|
|
|
| Fluorene degradation |
KEGG |
13 |
0.000 |
3 |
0.000 |
|
|
|
|
|
|
|
|
|
|
|
| gamma-Hexachlorocyclohexane degradation |
KEGG |
13 |
0.000 |
3 |
0.000 |
|
|
|
|
|
|
|
|
|
|
|
| Stilbene, coumarine and lignin biosynthesis |
KEGG |
13 |
0.002 |
3 |
0.097 |
|
|
|
|
|
|
|
|
|
|
|
| Tryptophan metabolism |
KEGG |
13 |
0.000 |
2 |
0.022 |
|
|
|
|
|
|
|
|
|
|
|
| response to ethylene stimulus |
TAIR-GO |
12 |
0.000 |
3 |
0.000 |
|
|
|
|
|
|
|
|
|
|
|
| leucine biosynthesis |
AraCyc |
12 |
0.000 |
2 |
0.005 |
|
|
|
|
|
|
|
|
|
|
|
| isoleucine degradation I |
AraCyc |
11 |
0.000 |
2 |
0.016 |
|
|
|
|
|
|
|
|
|
|
|
| isoleucine degradation III |
AraCyc |
11 |
0.000 |
2 |
0.002 |
|
|
|
|
|
|
|
|
|
|
|
| leucine degradation I |
AraCyc |
11 |
0.000 |
2 |
0.016 |
|
|
|
|
|
|
|
|
|
|
|
| leucine degradation II |
AraCyc |
11 |
0.000 |
2 |
0.002 |
|
|
|
|
|
|
|
|
|
|
|
| valine degradation I |
AraCyc |
11 |
0.000 |
2 |
0.041 |
|
|
|
|
|
|
|
|
|
|
|
| valine degradation II |
AraCyc |
11 |
0.000 |
2 |
0.006 |
|
|
|
|
|
|
|
|
|
|
|
| Glycan Biosynthesis and Metabolism |
KEGG |
11 |
0.006 |
2 |
0.100 |
|
|
|
|
|
|
|
|
|
|
|
| Nitrogen metabolism |
KEGG |
11 |
0.001 |
2 |
0.018 |
|
|
|
|
|
|
|
|
|
|
|
| Degradation of storage lipids and straight fatty acids |
AcylLipid |
11 |
0.000 |
2 |
0.044 |
|
|
|
|
|
|
|
|
|
|
|
| triterpene, sterol, and brassinosteroid metabolism |
LitPath |
11 |
0.035 |
2 |
0.258 |
|
|
|
|
|
|
|
|
|
|
|
| brassinosteroid biosynthesis |
BioPath |
10 |
0.000 |
1 |
0.001 |
|
|
|
|
|
|
|
|
|
|
|
| Chlorophyll biosynthesis and breakdown |
BioPath |
10 |
0.002 |
1 |
0.087 |
|
|
|
|
|
|
|
|
|
|
|
| Chloroplastic protein turnover |
BioPath |
10 |
0.000 |
1 |
0.013 |
|
|
|
|
|
|
|
|
|
|
|
| ERD1 protease (ClpC-like) |
BioPath |
10 |
0.000 |
1 |
0.000 |
|
|
|
|
|
|
|
|
|
|
|
| Methionin/SAM/ethylene metabolism from cysteine and aspartate |
BioPath |
10 |
0.000 |
1 |
0.074 |
|
|
|
|
|
|
|
|
|
|
|
| brassinosteroid biosynthesis |
TAIR-GO |
10 |
0.000 |
1 |
0.028 |
|
|
|
|
|
|
|
|
|
|
|
| chlorophyll catabolism |
TAIR-GO |
10 |
0.000 |
1 |
0.001 |
|
|
|
|
|
|
|
|
|
|
|
| growth |
TAIR-GO |
10 |
0.000 |
1 |
0.099 |
|
|
|
|
|
|
|
|
|
|
|
| hypersensitive response |
TAIR-GO |
10 |
0.000 |
1 |
0.007 |
|
|
|
|
|
|
|
|
|
|
|
|
|
|
|
|
|
|
|
|
|
|
|
|
|
|
|
|