|
|
|
|
|
|
|
|
|
|
|
|
|
|
|
|
|
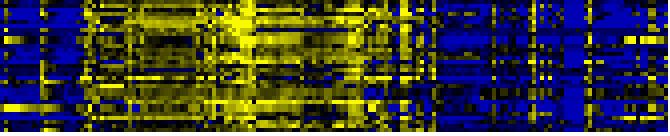
| Pathways co-expressed in the Organ and Tissue data set (with more than 6 annotation points) |
|
CYP71B6 (At2g24180) |
|
|
|
|
|
|
|
|
| max. difference between log2-ratios: |
5.1 |
|
|
|
|
|
|
|
|
|
|
|
|
| max. difference between log2-ratios excluding lowest and highest 5%: |
3.4 |
|
|
|
|
|
|
|
|
|
|
|
|
| Pathway |
Source |
Scores of Genes |
p[Score] |
No. of Genes |
p[genes] |
Link to organ heatmap |
|
|
|
|
|
|
|
| Biosynthesis of Amino Acids and Derivatives |
BioPath |
44 |
0.000 |
6 |
0.000 |
|
|
|
| Glutathione metabolism |
BioPath |
34 |
0.000 |
5 |
0.000 |
|
|
| indoleacetic acid biosynthesis |
TAIR-GO |
28 |
0.000 |
3 |
0.000 |
|
|
| IAA biosynthesis |
AraCyc |
28 |
0.000 |
3 |
0.000 |
|
|
| IAA biosynthesis I |
AraCyc |
28 |
0.000 |
3 |
0.000 |
|
|
| toxin catabolism |
TAIR-GO |
26 |
0.000 |
5 |
0.000 |
|
|
| Glutathione metabolism |
KEGG |
26 |
0.000 |
5 |
0.000 |
|
|
| glucosinolate biosynthesis from tryptophan |
AraCyc |
20 |
0.000 |
2 |
0.000 |
|
|
| Glucosinolate Metabolism |
LitPath |
20 |
0.000 |
2 |
0.000 |
|
|
| plant / fungal specific systemic sensing and response |
FunCat |
18 |
0.000 |
2 |
0.000 |
|
|
|
|
|
|
|
|
|
|
|
| plant hormonal regulation |
FunCat |
18 |
0.000 |
2 |
0.000 |
|
|
|
|
|
|
|
|
|
|
|
| Benzoate degradation via CoA ligation |
KEGG |
13 |
0.000 |
3 |
0.007 |
|
|
|
|
|
|
|
|
|
|
|
| Stilbene, coumarine and lignin biosynthesis |
KEGG |
12 |
0.000 |
2 |
0.054 |
|
|
|
|
|
|
|
|
|
|
|
| Glucosyltransferases for benzoic acids |
BioPath |
10 |
0.000 |
1 |
0.003 |
|
|
|
|
|
|
|
|
|
|
|
| Methionin/SAM/ethylene metabolism from cysteine and aspartate |
BioPath |
10 |
0.000 |
1 |
0.017 |
|
|
|
|
|
|
|
|
|
|
|
| sucrose metabolism |
BioPath |
10 |
0.000 |
1 |
0.007 |
|
|
|
|
|
|
|
|
|
|
|
| cellular response to sulfate starvation |
TAIR-GO |
10 |
0.000 |
1 |
0.000 |
|
|
|
|
|
|
|
|
|
|
|
| glucosinolate biosynthesis |
TAIR-GO |
10 |
0.000 |
1 |
0.004 |
|
|
|
|
|
|
|
|
|
|
|
| indole glucosinolate biosynthesis |
TAIR-GO |
10 |
0.000 |
1 |
0.000 |
|
|
|
|
|
|
|
|
|
|
|
| response to red light |
TAIR-GO |
10 |
0.000 |
1 |
0.000 |
|
|
|
|
|
|
|
|
|
|
|
| response to stress |
TAIR-GO |
10 |
0.000 |
1 |
0.001 |
|
|
|
|
|
|
|
|
|
|
|
| shade avoidance |
TAIR-GO |
10 |
0.000 |
1 |
0.000 |
|
|
|
|
|
|
|
|
|
|
|
| tryptophan biosynthesis |
TAIR-GO |
10 |
0.000 |
1 |
0.016 |
|
|
|
|
|
|
|
|
|
|
|
| tryptophan catabolism |
TAIR-GO |
10 |
0.000 |
1 |
0.000 |
|
|
|
|
|
|
|
|
|
|
|
| cysteine biosynthesis I |
AraCyc |
10 |
0.000 |
1 |
0.012 |
|
|
|
|
|
|
|
|
|
|
|
| glucosinolate biosynthesis from phenylalanine |
AraCyc |
10 |
0.000 |
1 |
0.000 |
|
|
|
|
|
|
|
|
|
|
|
| sulfate assimilation III |
AraCyc |
10 |
0.000 |
1 |
0.008 |
|
|
|
|
|
|
|
|
|
|
|
| biosynthesis of phenylpropanoids |
FunCat |
10 |
0.000 |
1 |
0.021 |
|
|
|
|
|
|
|
|
|
|
|
| biosynthesis of secondary products derived from L-phenylalanine and L-tyrosine |
FunCat |
10 |
0.000 |
1 |
0.021 |
|
|
|
|
|
|
|
|
|
|
|
| glycolysis and gluconeogenesis |
FunCat |
10 |
0.026 |
1 |
0.185 |
|
|
|
|
|
|
|
|
|
|
|
| nitrogen and sulfur metabolism |
FunCat |
10 |
0.000 |
1 |
0.008 |
|
|
|
|
|
|
|
|
|
|
|
| Ascorbate and aldarate metabolism |
KEGG |
10 |
0.000 |
1 |
0.020 |
|
|
|
|
|
|
|
|
|
|
|
| Cysteine metabolism |
KEGG |
10 |
0.000 |
1 |
0.023 |
|
|
|
|
|
|
|
|
|
|
|
| Fluorene degradation |
KEGG |
10 |
0.000 |
1 |
0.007 |
|
|
|
|
|
|
|
|
|
|
|
| Galactose metabolism |
KEGG |
10 |
0.000 |
1 |
0.029 |
|
|
|
|
|
|
|
|
|
|
|
| gamma-Hexachlorocyclohexane degradation |
KEGG |
10 |
0.000 |
1 |
0.009 |
|
|
|
|
|
|
|
|
|
|
|
| Starch and sucrose metabolism |
KEGG |
10 |
0.003 |
1 |
0.139 |
|
|
|
|
|
|
|
|
|
|
|
| Sulfur metabolism |
KEGG |
10 |
0.000 |
1 |
0.015 |
|
|
|
|
|
|
|
|
|
|
|
| Tryptophan metabolism |
KEGG |
10 |
0.000 |
2 |
0.003 |
|
|
|
|
|
|
|
|
|
|
|
| Lipid signaling |
AcylLipid |
10 |
0.000 |
2 |
0.000 |
|
|
|
|
|
|
|
|
|
|
|
| Phenylpropanoid pathway |
LitPath |
10 |
0.000 |
1 |
0.037 |
|
|
|
|
|
|
|
|
|
|
|
| response to pathogenic bacteria |
TAIR-GO |
9 |
0.000 |
1 |
0.001 |
|
|
|
|
|
|
|
|
|
|
|
| Cyanoamino acid metabolism |
KEGG |
9 |
0.000 |
1 |
0.020 |
|
|
|
|
|
|
|
|
|
|
|
| Nitrogen metabolism |
KEGG |
9 |
0.000 |
1 |
0.031 |
|
|
|
|
|
|
|
|
|
|
|
| Phytic acid biosynthesis |
BioPath |
8 |
0.000 |
1 |
0.010 |
|
|
|
|
|
|
|
|
|
|
|
| abscisic acid mediated signaling |
TAIR-GO |
8 |
0.000 |
1 |
0.001 |
|
|
|
|
|
|
|
|
|
|
|
| response to cold |
TAIR-GO |
8 |
0.000 |
1 |
0.003 |
|
|
|
|
|
|
|
|
|
|
|
| response to salt stress |
TAIR-GO |
8 |
0.000 |
1 |
0.001 |
|
|
|
|
|
|
|
|
|
|
|
| response to water deprivation |
TAIR-GO |
8 |
0.000 |
1 |
0.000 |
|
|
|
|
|
|
|
|
|
|
|
| lipases pathway |
AraCyc |
8 |
0.000 |
1 |
0.005 |
|
|
|
|
|
|
|
|
|
|
|
| degradation |
FunCat |
8 |
0.000 |
1 |
0.013 |
|
|
|
|
|
|
|
|
|
|
|
|
|
|
|
|
|
|
|
|
|
|
|
|
|
|
|
|
|
|
|
|
|
|
|
|
|
|
|
|
|
|
|
|
|
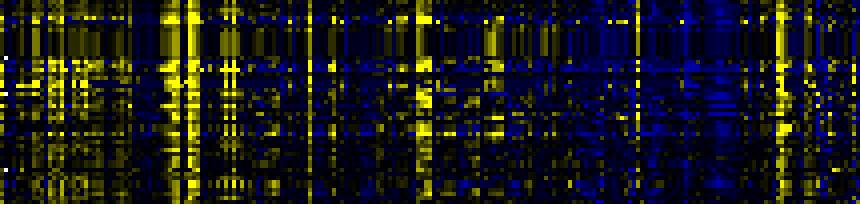
| Pathways co-expressed in the Stress data set ( with more than 10 annotation points) |
|
CYP71B6 (At2g24180) |
|
|
|
|
|
|
|
|
| max. difference between log2-ratios: |
4.8 |
|
|
|
|
|
|
|
|
|
|
|
|
| max. difference between log2-ratios excluding lowest and highest 5%: |
2.5 |
|
|
|
|
|
|
|
|
|
|
|
|
| Pathway |
Source |
Scores of Genes |
p[Score] |
No. of Genes |
p[genes] |
Link to stress heatmap |
|
|
|
|
|
|
|
| Phenylpropanoid Metabolism |
BioPath |
140 |
0.000 |
21 |
0.000 |
|
| Aromatic amino acid (Phe, Tyr, Trp) metabolism |
BioPath |
106 |
0.000 |
15 |
0.000 |
| Shikimate pathway |
LitPath |
104 |
0.000 |
14 |
0.000 |
| tryptophan biosynthesis |
TAIR-GO |
88 |
0.000 |
11 |
0.000 |
| Trp biosyntesis |
LitPath |
88 |
0.000 |
11 |
0.000 |
| tryptophan biosynthesis |
AraCyc |
78 |
0.000 |
10 |
0.000 |
| Phenylalanine, tyrosine and tryptophan biosynthesis |
KEGG |
76 |
0.000 |
10 |
0.000 |
| response to pathogenic bacteria |
TAIR-GO |
54 |
0.000 |
8 |
0.000 |
| Biosynthesis of Amino Acids and Derivatives |
BioPath |
52 |
0.000 |
8 |
0.048 |
| amino acid metabolism |
FunCat |
50 |
0.000 |
8 |
0.000 |
| Gluconeogenesis from lipids in seeds |
BioPath |
49 |
0.000 |
6 |
0.003 |
| Stilbene, coumarine and lignin biosynthesis |
KEGG |
49 |
0.000 |
10 |
0.000 |
| Glutathione metabolism |
BioPath |
40 |
0.000 |
6 |
0.003 |
| Fatty acid metabolism |
KEGG |
38 |
0.000 |
4 |
0.003 |
|
|
|
|
|
|
|
|
|
|
|
| Degradation of storage lipids and straight fatty acids |
AcylLipid |
37 |
0.000 |
4 |
0.002 |
|
|
|
|
|
|
|
|
|
|
|
| Intermediary Carbon Metabolism |
BioPath |
34 |
0.045 |
8 |
0.036 |
|
|
|
|
|
|
|
|
|
|
|
| toxin catabolism |
TAIR-GO |
32 |
0.000 |
8 |
0.000 |
|
|
|
|
|
|
|
|
|
|
|
| lignin biosynthesis |
AraCyc |
28 |
0.000 |
4 |
0.002 |
|
|
|
|
|
|
|
|
|
|
|
| Pyruvate metabolism |
KEGG |
28 |
0.001 |
5 |
0.021 |
|
|
|
|
|
|
|
|
|
|
|
| Glycolysis / Gluconeogenesis |
KEGG |
26 |
0.002 |
4 |
0.083 |
|
|
|
|
|
|
|
|
|
|
|
| Ascorbate and aldarate metabolism |
KEGG |
25 |
0.000 |
3 |
0.006 |
|
|
|
|
|
|
|
|
|
|
|
| Arginine and proline metabolism |
KEGG |
24 |
0.000 |
3 |
0.037 |
|
|
|
|
|
|
|
|
|
|
|
| Glutathione metabolism |
KEGG |
24 |
0.000 |
4 |
0.008 |
|
|
|
|
|
|
|
|
|
|
|
| core phenylpropanoid metabolism |
BioPath |
22 |
0.000 |
3 |
0.040 |
|
|
|
|
|
|
|
|
|
|
|
| cysteine biosynthesis I |
AraCyc |
22 |
0.000 |
4 |
0.001 |
|
|
|
|
|
|
|
|
|
|
|
| lipid, fatty acid and isoprenoid degradation |
FunCat |
22 |
0.000 |
3 |
0.001 |
|
|
|
|
|
|
|
|
|
|
|
| response to wounding |
TAIR-GO |
20 |
0.000 |
2 |
0.025 |
|
|
|
|
|
|
|
|
|
|
|
| Cysteine metabolism |
KEGG |
20 |
0.000 |
2 |
0.047 |
|
|
|
|
|
|
|
|
|
|
|
| Phenylalanine metabolism |
KEGG |
20 |
0.003 |
6 |
0.016 |
|
|
|
|
|
|
|
|
|
|
|
| Glucosinolate Metabolism |
LitPath |
20 |
0.003 |
2 |
0.079 |
|
|
|
|
|
|
|
|
|
|
|
| fatty acid beta oxidation complex |
BioPath |
19 |
0.000 |
3 |
0.003 |
|
|
|
|
|
|
|
|
|
|
|
| IAA biosynthesis |
AraCyc |
19 |
0.000 |
2 |
0.002 |
|
|
|
|
|
|
|
|
|
|
|
| sulfate assimilation III |
AraCyc |
18 |
0.000 |
3 |
0.005 |
|
|
|
|
|
|
|
|
|
|
|
| nitrogen and sulfur metabolism |
FunCat |
18 |
0.000 |
3 |
0.000 |
|
|
|
|
|
|
|
|
|
|
|
| Glycine, serine and threonine metabolism |
KEGG |
18 |
0.000 |
3 |
0.022 |
|
|
|
|
|
|
|
|
|
|
|
| Pyrimidine metabolism |
KEGG |
18 |
0.000 |
2 |
0.120 |
|
|
|
|
|
|
|
|
|
|
|
| beta-Alanine metabolism |
KEGG |
17 |
0.000 |
2 |
0.021 |
|
|
|
|
|
|
|
|
|
|
|
| Fluorene degradation |
KEGG |
17 |
0.000 |
2 |
0.009 |
|
|
|
|
|
|
|
|
|
|
|
| gamma-Hexachlorocyclohexane degradation |
KEGG |
17 |
0.000 |
2 |
0.014 |
|
|
|
|
|
|
|
|
|
|
|
| defense response |
TAIR-GO |
16 |
0.000 |
2 |
0.020 |
|
|
|
|
|
|
|
|
|
|
|
| metabolism of the cysteine - aromatic group |
FunCat |
16 |
0.000 |
2 |
0.001 |
|
|
|
|
|
|
|
|
|
|
|
| Flavonoid and anthocyanin metabolism |
BioPath |
12 |
0.011 |
3 |
0.073 |
|
|
|
|
|
|
|
|
|
|
|
| aromatic amino acid family biosynthesis |
TAIR-GO |
12 |
0.000 |
2 |
0.007 |
|
|
|
|
|
|
|
|
|
|
|
| aromatic amino acid family biosynthesis, shikimate pathway |
TAIR-GO |
12 |
0.000 |
2 |
0.004 |
|
|
|
|
|
|
|
|
|
|
|
| Propanoate metabolism |
KEGG |
12 |
0.006 |
2 |
0.061 |
|
|
|
|
|
|
|
|
|
|
|
| chorismate biosynthesis |
LitPath |
12 |
0.003 |
2 |
0.036 |
|
|
|
|
|
|
|
|
|
|
|
| Methionin/SAM/ethylene metabolism from cysteine and aspartate |
BioPath |
10 |
0.042 |
1 |
0.216 |
|
|
|
|
|
|
|
|
|
|
|
| anthranilate synthase complex |
TAIR-GO |
10 |
0.000 |
1 |
0.001 |
|
|
|
|
|
|
|
|
|
|
|
| cellular response to sulfate starvation |
TAIR-GO |
10 |
0.000 |
1 |
0.001 |
|
|
|
|
|
|
|
|
|
|
|
| fatty acid metabolism |
TAIR-GO |
10 |
0.027 |
1 |
0.167 |
|
|
|
|
|
|
|
|
|
|
|
|
|
|
|
|
|
|
|
|
|
|
|
|
|
|
|
|
|
|
|
|
|
|
|
|
|
|
|
|
|
|
|
|
|
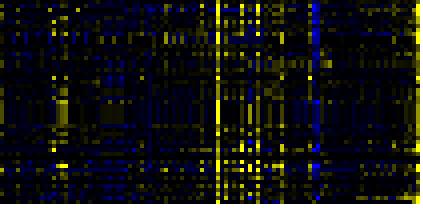
| Pathways co-expressed in the Hormone etc. data set (with more than 10 annotation points) |
|
CYP71B6 (At2g24180) |
|
|
|
|
|
|
|
|
| max. difference between log2-ratios: |
3.2 |
|
|
|
|
|
|
|
|
|
|
|
|
| max. difference between log2-ratios excluding lowest and highest 5%: |
0.8 |
|
|
|
|
|
|
|
|
|
|
|
|
| Pathway |
Source |
Scores of Genes |
p[Score] |
No. of Genes |
p[genes] |
Link to hormones etc. heatmap |
|
|
|
|
|
|
|
| Phenylpropanoid Metabolism |
BioPath |
87 |
0.000 |
13 |
0.000 |
|
|
|
|
|
|
| tryptophan biosynthesis |
TAIR-GO |
68 |
0.000 |
9 |
0.000 |
|
|
|
|
|
| Shikimate pathway |
LitPath |
68 |
0.000 |
9 |
0.000 |
|
|
|
|
|
| Trp biosyntesis |
LitPath |
68 |
0.000 |
9 |
0.000 |
|
|
|
|
|
| Aromatic amino acid (Phe, Tyr, Trp) metabolism |
BioPath |
64 |
0.000 |
9 |
0.000 |
|
|
|
|
|
| tryptophan biosynthesis |
AraCyc |
58 |
0.000 |
8 |
0.000 |
|
|
|
|
|
| response to pathogenic bacteria |
TAIR-GO |
54 |
0.000 |
8 |
0.000 |
|
|
|
|
|
| Intermediary Carbon Metabolism |
BioPath |
36 |
0.000 |
6 |
0.021 |
|
|
|
|
|
| Phenylalanine, tyrosine and tryptophan biosynthesis |
KEGG |
34 |
0.000 |
5 |
0.000 |
|
|
|
|
|
| Glutathione metabolism |
BioPath |
28 |
0.000 |
4 |
0.007 |
|
|
|
|
|
| Fatty acid metabolism |
KEGG |
28 |
0.000 |
3 |
0.002 |
|
|
|
|
|
| Glutathione metabolism |
KEGG |
28 |
0.000 |
5 |
0.000 |
|
|
|
|
|
| C-compound and carbohydrate metabolism |
FunCat |
27 |
0.000 |
8 |
0.002 |
|
|
|
|
|
| toxin catabolism |
TAIR-GO |
26 |
0.000 |
5 |
0.000 |
|
|
|
|
|
|
|
|
|
|
|
| Gluconeogenesis from lipids in seeds |
BioPath |
24 |
0.000 |
3 |
0.033 |
|
|
|
|
|
|
|
|
|
|
|
| lipid, fatty acid and isoprenoid degradation |
FunCat |
22 |
0.000 |
3 |
0.000 |
|
|
|
|
|
|
|
|
|
|
|
| Pyruvate metabolism |
KEGG |
22 |
0.000 |
3 |
0.024 |
|
|
|
|
|
|
|
|
|
|
|
| Stilbene, coumarine and lignin biosynthesis |
KEGG |
21 |
0.000 |
4 |
0.017 |
|
|
|
|
|
|
|
|
|
|
|
| Degradation of storage lipids and straight fatty acids |
AcylLipid |
20 |
0.000 |
2 |
0.002 |
|
|
|
|
|
|
|
|
|
|
|
| IAA biosynthesis |
AraCyc |
18 |
0.000 |
2 |
0.000 |
|
|
|
|
|
|
|
|
|
|
|
| Glycolysis / Gluconeogenesis |
KEGG |
18 |
0.001 |
2 |
0.114 |
|
|
|
|
|
|
|
|
|
|
|
| Tryptophan metabolism |
KEGG |
17 |
0.000 |
2 |
0.015 |
|
|
|
|
|
|
|
|
|
|
|
| 4-hydroxyproline degradation |
AraCyc |
16 |
0.000 |
2 |
0.000 |
|
|
|
|
|
|
|
|
|
|
|
| arginine degradation IX |
AraCyc |
16 |
0.000 |
2 |
0.000 |
|
|
|
|
|
|
|
|
|
|
|
| lignin biosynthesis |
AraCyc |
16 |
0.000 |
2 |
0.018 |
|
|
|
|
|
|
|
|
|
|
|
| proline degradation I |
AraCyc |
16 |
0.000 |
2 |
0.003 |
|
|
|
|
|
|
|
|
|
|
|
| proline degradation II |
AraCyc |
16 |
0.000 |
2 |
0.000 |
|
|
|
|
|
|
|
|
|
|
|
| amino acid metabolism |
FunCat |
16 |
0.001 |
3 |
0.027 |
|
|
|
|
|
|
|
|
|
|
|
| cysteine biosynthesis I |
AraCyc |
15 |
0.000 |
3 |
0.001 |
|
|
|
|
|
|
|
|
|
|
|
| Ascorbate and aldarate metabolism |
KEGG |
15 |
0.000 |
2 |
0.006 |
|
|
|
|
|
|
|
|
|
|
|
| Arginine and proline metabolism |
KEGG |
14 |
0.000 |
2 |
0.026 |
|
|
|
|
|
|
|
|
|
|
|
| Citrate cycle (TCA cycle) |
KEGG |
14 |
0.000 |
2 |
0.025 |
|
|
|
|
|
|
|
|
|
|
|
| Glycine, serine and threonine metabolism |
KEGG |
14 |
0.000 |
2 |
0.017 |
|
|
|
|
|
|
|
|
|
|
|
| core phenylpropanoid metabolism |
BioPath |
12 |
0.008 |
2 |
0.046 |
|
|
|
|
|
|
|
|
|
|
|
| Cyanoamino acid metabolism |
KEGG |
11 |
0.000 |
2 |
0.006 |
|
|
|
|
|
|
|
|
|
|
|
| Chloroplastic protein turnover |
BioPath |
10 |
0.000 |
1 |
0.019 |
|
|
|
|
|
|
|
|
|
|
|
| ERD1 protease (ClpC-like) |
BioPath |
10 |
0.000 |
1 |
0.000 |
|
|
|
|
|
|
|
|
|
|
|
| fatty acid beta oxidation complex |
BioPath |
10 |
0.000 |
1 |
0.059 |
|
|
|
|
|
|
|
|
|
|
|
| salycilic acid biosynthesis |
BioPath |
10 |
0.000 |
1 |
0.002 |
|
|
|
|
|
|
|
|
|
|
|
| anthranilate synthase complex |
TAIR-GO |
10 |
0.000 |
1 |
0.000 |
|
|
|
|
|
|
|
|
|
|
|
| ATP-dependent proteolysis |
TAIR-GO |
10 |
0.000 |
1 |
0.021 |
|
|
|
|
|
|
|
|
|
|
|
| fatty acid metabolism |
TAIR-GO |
10 |
0.002 |
1 |
0.094 |
|
|
|
|
|
|
|
|
|
|
|
| lignin biosynthesis |
TAIR-GO |
10 |
0.000 |
1 |
0.014 |
|
|
|
|
|
|
|
|
|
|
|
| long-chain fatty acid metabolism |
TAIR-GO |
10 |
0.000 |
1 |
0.047 |
|
|
|
|
|
|
|
|
|
|
|
| response to stress |
TAIR-GO |
10 |
0.000 |
1 |
0.002 |
|
|
|
|
|
|
|
|
|
|
|
| response to wounding |
TAIR-GO |
10 |
0.001 |
1 |
0.076 |
|
|
|
|
|
|
|
|
|
|
|
| metabolism of the cysteine - aromatic group |
FunCat |
10 |
0.000 |
1 |
0.005 |
|
|
|
|
|
|
|
|
|
|
|
| stress response |
FunCat |
10 |
0.000 |
1 |
0.000 |
|
|
|
|
|
|
|
|
|
|
|
| metabolism of acyl-lipids in mitochondria |
AcylLipid |
10 |
0.000 |
1 |
0.012 |
|
|
|
|
|
|
|
|
|
|
|
| auxin biosynthesis |
TAIR-GO |
9 |
0.000 |
1 |
0.002 |
|
|
|
|
|
|
|
|
|
|
|
|
|
|
|
|
|
|
|
|
|
|
|
|
|
|
|
|
|
|
|
|
|
|
|
|
|
|
|
|
|
|
|
|
|
|
|
|
|
|
|
|
|
|
|
|
|
|
|
|
|
|
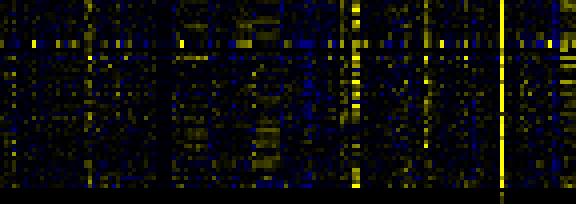
| Pathways co-expressed in the Mutant data set (with more than 10 annotation points) |
|
CYP71B6 (At2g24180) |
|
|
|
|
|
|
|
|
| max. difference between log2-ratios: |
3.9 |
|
|
|
|
|
|
|
|
|
|
|
|
| max. difference between log2-ratios excluding lowest and highest 5%: |
1.3 |
|
|
|
|
|
|
|
|
|
|
|
|
| Pathway |
Source |
Scores of Genes |
p[Score] |
No. of Genes |
p[genes] |
Link to mutants heatmap |
|
|
|
|
|
|
|
| Biosynthesis of Amino Acids and Derivatives |
BioPath |
54 |
0.000 |
7 |
0.019 |
|
|
|
|
| Glutathione metabolism |
BioPath |
44 |
0.000 |
6 |
0.000 |
|
|
|
| Phenylpropanoid Metabolism |
BioPath |
43 |
0.000 |
7 |
0.023 |
|
|
|
| Intermediary Carbon Metabolism |
BioPath |
42 |
0.000 |
8 |
0.004 |
|
|
|
| Aromatic amino acid (Phe, Tyr, Trp) metabolism |
BioPath |
40 |
0.000 |
5 |
0.001 |
|
|
|
| tryptophan biosynthesis |
TAIR-GO |
40 |
0.000 |
5 |
0.000 |
|
|
|
| Shikimate pathway |
LitPath |
40 |
0.000 |
5 |
0.001 |
|
|
|
| Trp biosyntesis |
LitPath |
40 |
0.000 |
5 |
0.000 |
|
|
|
| Glutathione metabolism |
KEGG |
38 |
0.000 |
5 |
0.001 |
|
|
|
| Glutamate metabolism |
KEGG |
36 |
0.000 |
5 |
0.001 |
|
|
|
| TCA cycle -- aerobic respiration |
AraCyc |
34 |
0.000 |
6 |
0.000 |
|
|
|
| tricarboxylic-acid pathway (citrate cycle, Krebs cycle, TCA cycle) |
FunCat |
34 |
0.000 |
6 |
0.015 |
|
|
|
| Citrate cycle (TCA cycle) |
KEGG |
34 |
0.000 |
6 |
0.000 |
|
|
|
| acetyl-CoA assimilation |
AraCyc |
30 |
0.000 |
5 |
0.000 |
|
|
|
|
|
|
|
|
|
|
|
| TCA cycle variation VII |
AraCyc |
30 |
0.000 |
5 |
0.011 |
|
|
|
|
|
|
|
|
|
|
|
| TCA cycle variation VIII |
AraCyc |
30 |
0.000 |
5 |
0.002 |
|
|
|
|
|
|
|
|
|
|
|
| tryptophan biosynthesis |
AraCyc |
30 |
0.000 |
4 |
0.001 |
|
|
|
|
|
|
|
|
|
|
|
| amino acid metabolism |
FunCat |
30 |
0.002 |
4 |
0.128 |
|
|
|
|
|
|
|
|
|
|
|
| Gluconeogenesis from lipids in seeds |
BioPath |
28 |
0.000 |
5 |
0.002 |
|
|
|
|
|
|
|
|
|
|
|
| glyoxylate cycle |
AraCyc |
26 |
0.000 |
4 |
0.000 |
|
|
|
|
|
|
|
|
|
|
|
| serine-isocitrate lyase pathway |
AraCyc |
26 |
0.000 |
4 |
0.007 |
|
|
|
|
|
|
|
|
|
|
|
| Glyoxylate and dicarboxylate metabolism |
KEGG |
26 |
0.000 |
4 |
0.001 |
|
|
|
|
|
|
|
|
|
|
|
| Phenylalanine, tyrosine and tryptophan biosynthesis |
KEGG |
26 |
0.000 |
3 |
0.023 |
|
|
|
|
|
|
|
|
|
|
|
| Reductive carboxylate cycle (CO2 fixation) |
KEGG |
26 |
0.000 |
4 |
0.000 |
|
|
|
|
|
|
|
|
|
|
|
| Carbon fixation |
KEGG |
22 |
0.000 |
4 |
0.024 |
|
|
|
|
|
|
|
|
|
|
|
| glutathione biosynthesis |
TAIR-GO |
20 |
0.000 |
2 |
0.000 |
|
|
|
|
|
|
|
|
|
|
|
| glutathione biosynthesis |
AraCyc |
20 |
0.000 |
2 |
0.000 |
|
|
|
|
|
|
|
|
|
|
|
| leucine biosynthesis |
AraCyc |
20 |
0.000 |
3 |
0.001 |
|
|
|
|
|
|
|
|
|
|
|
| C-compound and carbohydrate glyoxylate cycle |
FunCat |
20 |
0.000 |
3 |
0.000 |
|
|
|
|
|
|
|
|
|
|
|
| glyoxylate cycle |
FunCat |
20 |
0.000 |
3 |
0.000 |
|
|
|
|
|
|
|
|
|
|
|
| transport |
FunCat |
20 |
0.000 |
4 |
0.000 |
|
|
|
|
|
|
|
|
|
|
|
| Miscellaneous acyl lipid metabolism |
AcylLipid |
20 |
0.000 |
2 |
0.061 |
|
|
|
|
|
|
|
|
|
|
|
| mixed acid fermentation |
AraCyc |
18 |
0.000 |
4 |
0.002 |
|
|
|
|
|
|
|
|
|
|
|
| development |
TAIR-GO |
16 |
0.000 |
2 |
0.045 |
|
|
|
|
|
|
|
|
|
|
|
| Oxidative phosphorylation |
KEGG |
16 |
0.000 |
4 |
0.037 |
|
|
|
|
|
|
|
|
|
|
|
| growth |
TAIR-GO |
15 |
0.000 |
2 |
0.015 |
|
|
|
|
|
|
|
|
|
|
|
| toxin catabolism |
TAIR-GO |
15 |
0.000 |
4 |
0.003 |
|
|
|
|
|
|
|
|
|
|
|
| response to pathogenic bacteria |
TAIR-GO |
14 |
0.000 |
2 |
0.000 |
|
|
|
|
|
|
|
|
|
|
|
| Translation factors |
KEGG |
14 |
0.011 |
4 |
0.066 |
|
|
|
|
|
|
|
|
|
|
|
| electron transport |
TAIR-GO |
12 |
0.000 |
3 |
0.001 |
|
|
|
|
|
|
|
|
|
|
|
| aspartate degradation I |
AraCyc |
12 |
0.001 |
2 |
0.032 |
|
|
|
|
|
|
|
|
|
|
|
| aspartate degradation II |
AraCyc |
12 |
0.000 |
2 |
0.008 |
|
|
|
|
|
|
|
|
|
|
|
| lignin biosynthesis |
AraCyc |
12 |
0.028 |
4 |
0.006 |
|
|
|
|
|
|
|
|
|
|
|
| tRNA charging pathway |
AraCyc |
12 |
0.000 |
5 |
0.001 |
|
|
|
|
|
|
|
|
|
|
|
| transport facilitation |
FunCat |
12 |
0.000 |
2 |
0.000 |
|
|
|
|
|
|
|
|
|
|
|
| Alanine and aspartate metabolism |
KEGG |
12 |
0.000 |
2 |
0.043 |
|
|
|
|
|
|
|
|
|
|
|
| Aminoacyl-tRNA biosynthesis |
KEGG |
12 |
0.000 |
5 |
0.001 |
|
|
|
|
|
|
|
|
|
|
|
| Chlorophyll biosynthesis and breakdown |
BioPath |
10 |
0.025 |
1 |
0.148 |
|
|
|
|
|
|
|
|
|
|
|
| Methionin/SAM/ethylene metabolism from cysteine and aspartate |
BioPath |
10 |
0.002 |
1 |
0.127 |
|
|
|
|
|
|
|
|
|
|
|
| cell death |
TAIR-GO |
10 |
0.000 |
1 |
0.003 |
|
|
|
|
|
|
|
|
|
|
|
|
|
|
|
|
|
|
|
|
|
|
|
|
|
|
|
|