|
|
|
|
|
|
|
|
|
|
|
|
|
|
|
|
|
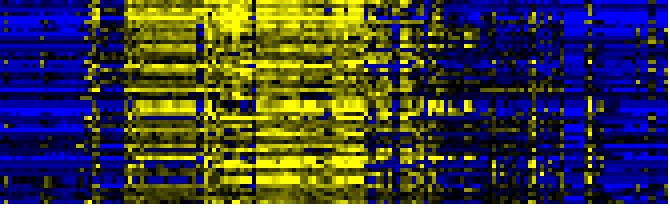
| Pathways co-expressed in the Organ and Tissue data set (with more than 10 annotation points) |
|
CYP71B7 (At1g13110) |
|
|
|
|
|
|
|
|
| max. difference between log2-ratios: |
6.6 |
|
|
|
|
|
|
|
|
|
|
|
|
| max. difference between log2-ratios excluding lowest and highest 5%: |
5.8 |
|
|
|
|
|
|
|
|
|
|
|
|
| Pathway |
Source |
Scores of Genes |
p[Score] |
No. of Genes |
p[genes] |
Link to organ heatmap |
|
|
|
|
|
|
|
| Glucosinolate Metabolism |
LitPath |
130 |
0.000 |
13 |
0.000 |
|
|
|
| Biosynthesis of Amino Acids and Derivatives |
BioPath |
118 |
0.000 |
16 |
0.000 |
|
|
| Glutathione metabolism |
BioPath |
70 |
0.000 |
10 |
0.000 |
|
|
| Phenylpropanoid Metabolism |
BioPath |
52 |
0.000 |
6 |
0.103 |
|
|
| glucosinolate biosynthesis |
TAIR-GO |
50 |
0.000 |
5 |
0.000 |
|
|
| sulfate assimilation III |
AraCyc |
46 |
0.000 |
6 |
0.000 |
|
|
| amino acid metabolism |
FunCat |
44 |
0.000 |
6 |
0.001 |
|
|
| Selenoamino acid metabolism |
KEGG |
40 |
0.000 |
5 |
0.000 |
|
|
| Sulfur metabolism |
KEGG |
40 |
0.000 |
5 |
0.000 |
|
|
| Lipid signaling |
AcylLipid |
40 |
0.000 |
8 |
0.007 |
|
|
| Stilbene, coumarine and lignin biosynthesis |
KEGG |
39 |
0.000 |
4 |
0.056 |
|
|
| gamma-Hexachlorocyclohexane degradation |
KEGG |
33 |
0.000 |
4 |
0.000 |
|
|
| Flavonoid and anthocyanin metabolism |
BioPath |
30 |
0.000 |
3 |
0.038 |
|
|
| cysteine biosynthesis I |
AraCyc |
30 |
0.000 |
4 |
0.004 |
|
|
|
|
|
|
|
|
|
|
|
| glucosinolate biosynthesis from homomethionine |
AraCyc |
30 |
0.000 |
3 |
0.000 |
|
|
|
|
|
|
|
|
|
|
|
| glucosinolate biosynthesis from phenylalanine |
AraCyc |
30 |
0.000 |
3 |
0.000 |
|
|
|
|
|
|
|
|
|
|
|
| glucosinolate biosynthesis from tryptophan |
AraCyc |
30 |
0.000 |
3 |
0.000 |
|
|
|
|
|
|
|
|
|
|
|
| Ascorbate and aldarate metabolism |
KEGG |
29 |
0.000 |
3 |
0.002 |
|
|
|
|
|
|
|
|
|
|
|
| Fluorene degradation |
KEGG |
29 |
0.000 |
3 |
0.000 |
|
|
|
|
|
|
|
|
|
|
|
| Branched-chain amino acids from aspartate |
BioPath |
28 |
0.000 |
4 |
0.000 |
|
|
|
|
|
|
|
|
|
|
|
| leucine biosynthesis |
AraCyc |
28 |
0.000 |
4 |
0.000 |
|
|
|
|
|
|
|
|
|
|
|
| Glutamate metabolism |
KEGG |
28 |
0.000 |
3 |
0.012 |
|
|
|
|
|
|
|
|
|
|
|
| Miscellaneous acyl lipid metabolism |
AcylLipid |
26 |
0.008 |
6 |
0.108 |
|
|
|
|
|
|
|
|
|
|
|
| Pyruvate metabolism |
KEGG |
24 |
0.001 |
3 |
0.064 |
|
|
|
|
|
|
|
|
|
|
|
| Valine, leucine and isoleucine biosynthesis |
KEGG |
24 |
0.000 |
3 |
0.004 |
|
|
|
|
|
|
|
|
|
|
|
| jasmonic acid biosynthesis |
TAIR-GO |
22 |
0.000 |
3 |
0.002 |
|
|
|
|
|
|
|
|
|
|
|
| jasmonic acid biosynthesis |
AraCyc |
22 |
0.000 |
3 |
0.001 |
|
|
|
|
|
|
|
|
|
|
|
| Glycan Biosynthesis and Metabolism |
KEGG |
22 |
0.000 |
3 |
0.043 |
|
|
|
|
|
|
|
|
|
|
|
| indoleacetic acid biosynthesis |
TAIR-GO |
20 |
0.000 |
2 |
0.000 |
|
|
|
|
|
|
|
|
|
|
|
| tryptophan biosynthesis |
TAIR-GO |
20 |
0.000 |
2 |
0.014 |
|
|
|
|
|
|
|
|
|
|
|
| tryptophan catabolism |
TAIR-GO |
20 |
0.000 |
2 |
0.000 |
|
|
|
|
|
|
|
|
|
|
|
| IAA biosynthesis |
AraCyc |
20 |
0.000 |
2 |
0.004 |
|
|
|
|
|
|
|
|
|
|
|
| IAA biosynthesis I |
AraCyc |
20 |
0.000 |
2 |
0.002 |
|
|
|
|
|
|
|
|
|
|
|
| nitrogen and sulfur metabolism |
FunCat |
20 |
0.000 |
2 |
0.004 |
|
|
|
|
|
|
|
|
|
|
|
| Cysteine metabolism |
KEGG |
20 |
0.000 |
3 |
0.002 |
|
|
|
|
|
|
|
|
|
|
|
| Glycerolipid metabolism |
KEGG |
20 |
0.000 |
3 |
0.005 |
|
|
|
|
|
|
|
|
|
|
|
| Phenylalanine, tyrosine and tryptophan biosynthesis |
KEGG |
20 |
0.000 |
2 |
0.061 |
|
|
|
|
|
|
|
|
|
|
|
| Purine metabolism |
KEGG |
20 |
0.001 |
2 |
0.132 |
|
|
|
|
|
|
|
|
|
|
|
| alanine biosynthesis II |
AraCyc |
19 |
0.000 |
2 |
0.032 |
|
|
|
|
|
|
|
|
|
|
|
| response to water deprivation |
TAIR-GO |
18 |
0.000 |
2 |
0.000 |
|
|
|
|
|
|
|
|
|
|
|
| C-compound and carbohydrate utilization |
FunCat |
18 |
0.000 |
3 |
0.000 |
|
|
|
|
|
|
|
|
|
|
|
| Alanine and aspartate metabolism |
KEGG |
18 |
0.000 |
2 |
0.026 |
|
|
|
|
|
|
|
|
|
|
|
| toxin catabolism |
TAIR-GO |
16 |
0.000 |
4 |
0.011 |
|
|
|
|
|
|
|
|
|
|
|
| dissimilatory sulfate reduction |
AraCyc |
16 |
0.000 |
2 |
0.001 |
|
|
|
|
|
|
|
|
|
|
|
| lipoxygenase pathway |
AraCyc |
16 |
0.000 |
2 |
0.004 |
|
|
|
|
|
|
|
|
|
|
|
| nitrogen and sulfur utilization |
FunCat |
16 |
0.000 |
2 |
0.001 |
|
|
|
|
|
|
|
|
|
|
|
| Ion channels |
KEGG |
16 |
0.000 |
5 |
0.000 |
|
|
|
|
|
|
|
|
|
|
|
| Ligand-Receptor Interaction |
KEGG |
16 |
0.000 |
5 |
0.001 |
|
|
|
|
|
|
|
|
|
|
|
| Nitrogen metabolism |
KEGG |
16 |
0.002 |
2 |
0.029 |
|
|
|
|
|
|
|
|
|
|
|
| cellulose biosynthesis |
BioPath |
14 |
0.006 |
2 |
0.086 |
|
|
|
|
|
|
|
|
|
|
|
| Fructose and mannose metabolism |
KEGG |
14 |
0.018 |
2 |
0.072 |
|
|
|
|
|
|
|
|
|
|
|
|
|
|
|
|
|
|
|
|
|
|
|
|
|
|
|
|
|
|
|
|
|
|
|
|
|
|
|
|
|
|
|
|
|
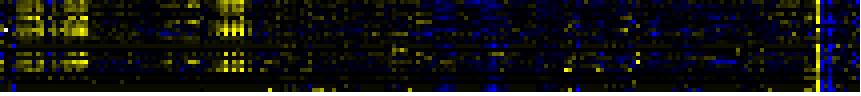
| Pathways co-expressed in the Stress data set ( with more than 6 annotation points) |
|
CYP71B7 (At1g13110) |
|
|
|
|
|
|
|
|
| max. difference between log2-ratios: |
9.1 |
|
|
|
|
|
|
|
|
|
|
|
|
| max. difference between log2-ratios excluding lowest and highest 5%: |
2.1 |
|
|
|
|
|
|
|
|
|
|
|
|
| Pathway |
Source |
Scores of Genes |
p[Score] |
No. of Genes |
p[genes] |
Link to stress heatmap |
|
|
|
|
|
|
|
| Stilbene, coumarine and lignin biosynthesis |
KEGG |
26 |
0.000 |
5 |
0.000 |
|
| core phenylpropanoid metabolism |
BioPath |
20 |
0.000 |
2 |
0.001 |
| Phenylpropanoid Metabolism |
BioPath |
20 |
0.000 |
2 |
0.030 |
| lignin biosynthesis |
TAIR-GO |
20 |
0.000 |
2 |
0.000 |
| phenylpropanoid biosynthesis |
TAIR-GO |
20 |
0.000 |
2 |
0.000 |
| lignin biosynthesis |
AraCyc |
20 |
0.000 |
2 |
0.003 |
| Ascorbate and aldarate metabolism |
KEGG |
20 |
0.000 |
2 |
0.001 |
|
|
|
|
|
|
|
|
|
|
|
| Fluorene degradation |
KEGG |
20 |
0.000 |
2 |
0.000 |
|
|
|
|
|
|
|
|
|
|
|
| gamma-Hexachlorocyclohexane degradation |
KEGG |
20 |
0.000 |
2 |
0.000 |
|
|
|
|
|
|
|
|
|
|
|
| Phenylpropanoid pathway |
LitPath |
20 |
0.000 |
2 |
0.000 |
|
|
|
|
|
|
|
|
|
|
|
| Biosynthesis of Amino Acids and Derivatives |
BioPath |
16 |
0.000 |
2 |
0.027 |
|
|
|
|
|
|
|
|
|
|
|
| Miscellaneous acyl lipid metabolism |
AcylLipid |
14 |
0.000 |
3 |
0.005 |
|
|
|
|
|
|
|
|
|
|
|
| biogenesis of cell wall |
FunCat |
12 |
0.000 |
2 |
0.002 |
|
|
|
|
|
|
|
|
|
|
|
| Glutamate/glutamine from nitrogen fixation |
BioPath |
10 |
0.000 |
1 |
0.001 |
|
|
|
|
|
|
|
|
|
|
|
| fatty acid biosynthesis |
TAIR-GO |
10 |
0.000 |
1 |
0.005 |
|
|
|
|
|
|
|
|
|
|
|
| ammonia assimilation cycle |
AraCyc |
10 |
0.000 |
1 |
0.002 |
|
|
|
|
|
|
|
|
|
|
|
| fatty acid oxidation pathway |
AraCyc |
10 |
0.000 |
1 |
0.008 |
|
|
|
|
|
|
|
|
|
|
|
| glutamine biosynthesis I |
AraCyc |
10 |
0.000 |
1 |
0.001 |
|
|
|
|
|
|
|
|
|
|
|
| nitrate assimilation pathway |
AraCyc |
10 |
0.000 |
1 |
0.002 |
|
|
|
|
|
|
|
|
|
|
|
| octane oxidation |
AraCyc |
10 |
0.000 |
1 |
0.002 |
|
|
|
|
|
|
|
|
|
|
|
| phenylpropanoid biosynthesis |
AraCyc |
10 |
0.000 |
1 |
0.001 |
|
|
|
|
|
|
|
|
|
|
|
| suberin biosynthesis |
AraCyc |
10 |
0.000 |
1 |
0.007 |
|
|
|
|
|
|
|
|
|
|
|
| amino acid metabolism |
FunCat |
10 |
0.001 |
1 |
0.058 |
|
|
|
|
|
|
|
|
|
|
|
| assimilation of ammonia, metabolism of the glutamate group |
FunCat |
10 |
0.000 |
1 |
0.003 |
|
|
|
|
|
|
|
|
|
|
|
| biosynthesis of phenylpropanoids |
FunCat |
10 |
0.000 |
1 |
0.007 |
|
|
|
|
|
|
|
|
|
|
|
| biosynthesis of secondary products derived from L-phenylalanine and L-tyrosine |
FunCat |
10 |
0.000 |
1 |
0.007 |
|
|
|
|
|
|
|
|
|
|
|
| nitrogen and sulfur metabolism |
FunCat |
10 |
0.000 |
1 |
0.002 |
|
|
|
|
|
|
|
|
|
|
|
| Fatty acid metabolism |
KEGG |
10 |
0.000 |
1 |
0.023 |
|
|
|
|
|
|
|
|
|
|
|
| auxin mediated signaling pathway |
TAIR-GO |
9 |
0.000 |
1 |
0.000 |
|
|
|
|
|
|
|
|
|
|
|
| Mo-molybdopterin cofactor biosynthesis |
TAIR-GO |
9 |
0.000 |
1 |
0.000 |
|
|
|
|
|
|
|
|
|
|
|
| molybdenum ion binding |
TAIR-GO |
9 |
0.000 |
1 |
0.000 |
|
|
|
|
|
|
|
|
|
|
|
| phosphorylation |
TAIR-GO |
9 |
0.000 |
1 |
0.000 |
|
|
|
|
|
|
|
|
|
|
|
| protein amino acid phosphorylation |
TAIR-GO |
9 |
0.000 |
1 |
0.001 |
|
|
|
|
|
|
|
|
|
|
|
| asparagine degradation I |
AraCyc |
9 |
0.000 |
1 |
0.005 |
|
|
|
|
|
|
|
|
|
|
|
| gluconeogenesis |
AraCyc |
9 |
0.000 |
1 |
0.039 |
|
|
|
|
|
|
|
|
|
|
|
| phenylalanine degradation I |
AraCyc |
9 |
0.000 |
1 |
0.015 |
|
|
|
|
|
|
|
|
|
|
|
| TCA cycle variation IV |
AraCyc |
9 |
0.000 |
1 |
0.039 |
|
|
|
|
|
|
|
|
|
|
|
| TCA cycle variation VII |
AraCyc |
9 |
0.002 |
1 |
0.086 |
|
|
|
|
|
|
|
|
|
|
|
| biosynthesis of vitamins, cofactors, and prosthetic groups |
FunCat |
9 |
0.000 |
1 |
0.001 |
|
|
|
|
|
|
|
|
|
|
|
| Folate biosynthesis |
KEGG |
9 |
0.000 |
1 |
0.005 |
|
|
|
|
|
|
|
|
|
|
|
| Gluconeogenesis from lipids in seeds |
BioPath |
8 |
0.000 |
1 |
0.031 |
|
|
|
|
|
|
|
|
|
|
|
| defense response |
TAIR-GO |
8 |
0.000 |
1 |
0.010 |
|
|
|
|
|
|
|
|
|
|
|
| defense response to bacteria |
TAIR-GO |
8 |
0.000 |
1 |
0.000 |
|
|
|
|
|
|
|
|
|
|
|
| response to bacteria |
TAIR-GO |
8 |
0.000 |
1 |
0.000 |
|
|
|
|
|
|
|
|
|
|
|
| glycerol degradation II |
AraCyc |
8 |
0.000 |
1 |
0.039 |
|
|
|
|
|
|
|
|
|
|
|
| glycerol metabolism |
AraCyc |
8 |
0.000 |
1 |
0.005 |
|
|
|
|
|
|
|
|
|
|
|
| Glycerolipid metabolism |
KEGG |
8 |
0.000 |
1 |
0.021 |
|
|
|
|
|
|
|
|
|
|
|
|
|
|
|
|
|
|
|
|
|
|
|
|
|
|
|
|
|
|
|
|
|
|
|
|
|
|
|
|
|
|
|
|
|
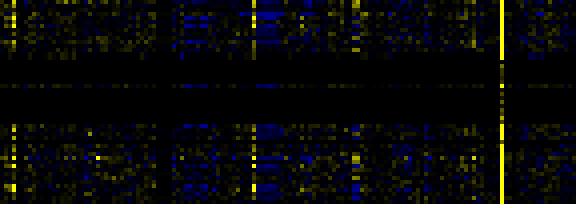
| Pathways co-expressed in the Hormone etc. data set (with more than 10 annotation points) |
|
CYP71B7 (At1g13110) |
|
|
|
|
|
|
|
|
| max. difference between log2-ratios: |
2.9 |
|
|
|
|
|
|
|
|
|
|
|
|
| max. difference between log2-ratios excluding lowest and highest 5%: |
1.2 |
|
|
|
|
|
|
|
|
|
|
|
|
| Pathway |
Source |
Scores of Genes |
p[Score] |
No. of Genes |
p[genes] |
Link to hormones etc. heatmap |
|
|
|
|
|
|
|
| Intermediary Carbon Metabolism |
BioPath |
10 |
0.000 |
1 |
0.000 |

|
|
|
|
|
|
| acetyl-CoA assimilation |
AraCyc |
10 |
0.000 |
1 |
0.001 |
|
|
|
|
|
|
|
|
|
|
|
| glyoxylate cycle |
AraCyc |
10 |
0.000 |
1 |
0.001 |
|
|
|
|
|
|
|
|
|
|
|
| leucine biosynthesis |
AraCyc |
10 |
0.000 |
1 |
0.000 |
|
|
|
|
|
|
|
|
|
|
|
| serine-isocitrate lyase pathway |
AraCyc |
10 |
0.000 |
1 |
0.003 |
|
|
|
|
|
|
|
|
|
|
|
| TCA cycle -- aerobic respiration |
AraCyc |
10 |
0.000 |
1 |
0.003 |
|
|
|
|
|
|
|
|
|
|
|
| TCA cycle variation VII |
AraCyc |
10 |
0.000 |
1 |
0.006 |
|
|
|
|
|
|
|
|
|
|
|
| TCA cycle variation VIII |
AraCyc |
10 |
0.000 |
1 |
0.003 |
|
|
|
|
|
|
|
|
|
|
|
| C-compound and carbohydrate glyoxylate cycle |
FunCat |
10 |
0.000 |
1 |
0.000 |
|
|
|
|
|
|
|
|
|
|
|
| glyoxylate cycle |
FunCat |
10 |
0.000 |
1 |
0.000 |
|
|
|
|
|
|
|
|
|
|
|
| tricarboxylic-acid pathway (citrate cycle, Krebs cycle, TCA cycle) |
FunCat |
10 |
0.000 |
1 |
0.003 |
|
|
|
|
|
|
|
|
|
|
|
| Citrate cycle (TCA cycle) |
KEGG |
10 |
0.000 |
1 |
0.000 |
|
|
|
|
|
|
|
|
|
|
|
| Glyoxylate and dicarboxylate metabolism |
KEGG |
10 |
0.000 |
1 |
0.000 |
|
|
|
|
|
|
|
|
|
|
|
| Reductive carboxylate cycle (CO2 fixation) |
KEGG |
10 |
0.000 |
1 |
0.000 |
|
|
|
|
|
|
|
|
|
|
|
|
|
|
|
|
|
|
|
|
|
|
|
|
|
|
|
|
|
|
|
|
|
|
|
|
|
|
|
|
|
|
|
|
|
|
|
|
|
|
|
|
|
|
|
|
|
|
|
|
|
|
| Pathways co-expressed in the Mutant data set (with more than 10 annotation points) |
|
CYP71B7 (At1g13110) |
|
|
|
|
|
|
|
|
| max. difference between log2-ratios: |
9.0 |
|
|
|
|
|
|
|
|
|
|
|
|
| max. difference between log2-ratios excluding lowest and highest 5%: |
1.9 |
|
|
|
|
|
|
|
|
|
|
|
|
| Pathway |
Source |
Scores of Genes |
p[Score] |
No. of Genes |
p[genes] |
Link to mutants heatmap |
|
|
|
|
|
|
|
| C-compound and carbohydrate metabolism |
FunCat |
189 |
0.000 |
35 |
0.020 |
|
|
|
|
| Intermediary Carbon Metabolism |
BioPath |
160 |
0.000 |
28 |
0.002 |
|
|
|
| Photosystems |
BioPath |
150 |
0.000 |
19 |
0.007 |
|
|
|
| biogenesis of chloroplast |
FunCat |
116 |
0.000 |
15 |
0.000 |
|
|
|
| Plastidial Isoprenoids (Chlorophylls, Carotenoids, Tocopherols, Plastoquinone, Phylloquinone) |
BioPath |
113 |
0.000 |
15 |
0.013 |
|
|
|
| glycolysis and gluconeogenesis |
FunCat |
108 |
0.000 |
18 |
0.017 |
|
|
|
| Carbon fixation |
KEGG |
101 |
0.000 |
17 |
0.000 |
|
|
|
| transport |
FunCat |
99 |
0.000 |
16 |
0.000 |
|
|
|
| photosynthesis |
FunCat |
94 |
0.000 |
14 |
0.000 |
|
|
|
| Isoprenoid Biosynthesis in the Cytosol and in Mitochondria |
BioPath |
82 |
0.001 |
9 |
0.130 |
|
|
|
| Chlorophyll a/b binding proteins |
BioPath |
72 |
0.000 |
9 |
0.000 |
|
|
|
| Glycolysis / Gluconeogenesis |
KEGG |
72 |
0.000 |
13 |
0.007 |
|
|
|
| Glutathione metabolism |
BioPath |
66 |
0.029 |
9 |
0.198 |
|
|
|
| Biosynthesis of steroids |
KEGG |
65 |
0.000 |
7 |
0.046 |
|
|
|
|
|
|
|
|
|
|
|
| triterpene, sterol, and brassinosteroid metabolism |
LitPath |
63 |
0.031 |
8 |
0.374 |
|
|
|
|
|
|
|
|
|
|
|
| Calvin cycle |
AraCyc |
62 |
0.000 |
11 |
0.000 |
|
|
|
|
|
|
|
|
|
|
|
| Gluconeogenesis from lipids in seeds |
BioPath |
61 |
0.037 |
11 |
0.054 |
|
|
|
|
|
|
|
|
|
|
|
| transport facilitation |
FunCat |
61 |
0.000 |
10 |
0.000 |
|
|
|
|
|
|
|
|
|
|
|
| acetate fermentation |
AraCyc |
60 |
0.000 |
12 |
0.031 |
|
|
|
|
|
|
|
|
|
|
|
| Inositol phosphate metabolism |
KEGG |
59 |
0.001 |
11 |
0.145 |
|
|
|
|
|
|
|
|
|
|
|
| additional photosystem II components |
BioPath |
58 |
0.000 |
7 |
0.050 |
|
|
|
|
|
|
|
|
|
|
|
| fructose degradation (anaerobic) |
AraCyc |
56 |
0.000 |
10 |
0.079 |
|
|
|
|
|
|
|
|
|
|
|
| glycolysis IV |
AraCyc |
56 |
0.000 |
10 |
0.087 |
|
|
|
|
|
|
|
|
|
|
|
| sorbitol fermentation |
AraCyc |
56 |
0.000 |
10 |
0.103 |
|
|
|
|
|
|
|
|
|
|
|
| Sulfur metabolism |
KEGG |
54 |
0.000 |
7 |
0.000 |
|
|
|
|
|
|
|
|
|
|
|
| Ascorbate and aldarate metabolism |
KEGG |
51 |
0.000 |
6 |
0.005 |
|
|
|
|
|
|
|
|
|
|
|
| sterol biosynthesis |
BioPath |
50 |
0.000 |
5 |
0.052 |
|
|
|
|
|
|
|
|
|
|
|
| sterol biosynthesis |
TAIR-GO |
50 |
0.000 |
5 |
0.011 |
|
|
|
|
|
|
|
|
|
|
|
| Pentose phosphate pathway |
KEGG |
50 |
0.000 |
11 |
0.000 |
|
|
|
|
|
|
|
|
|
|
|
| Citrate cycle (TCA cycle) |
KEGG |
48 |
0.000 |
8 |
0.008 |
|
|
|
|
|
|
|
|
|
|
|
| Selenoamino acid metabolism |
KEGG |
48 |
0.000 |
6 |
0.014 |
|
|
|
|
|
|
|
|
|
|
|
| Synthesis of membrane lipids in endomembrane system |
AcylLipid |
47 |
0.000 |
6 |
0.043 |
|
|
|
|
|
|
|
|
|
|
|
| cysteine biosynthesis I |
AraCyc |
46 |
0.000 |
8 |
0.023 |
|
|
|
|
|
|
|
|
|
|
|
| Cysteine metabolism |
KEGG |
46 |
0.000 |
7 |
0.002 |
|
|
|
|
|
|
|
|
|
|
|
| photorespiration |
AraCyc |
45 |
0.000 |
8 |
0.009 |
|
|
|
|
|
|
|
|
|
|
|
| gluconeogenesis |
AraCyc |
44 |
0.001 |
6 |
0.220 |
|
|
|
|
|
|
|
|
|
|
|
| glycerol degradation II |
AraCyc |
44 |
0.000 |
8 |
0.053 |
|
|
|
|
|
|
|
|
|
|
|
| sulfate assimilation III |
AraCyc |
44 |
0.001 |
6 |
0.063 |
|
|
|
|
|
|
|
|
|
|
|
| Glutamate metabolism |
KEGG |
44 |
0.003 |
5 |
0.175 |
|
|
|
|
|
|
|
|
|
|
|
| Shikimate pathway |
LitPath |
44 |
0.040 |
5 |
0.317 |
|
|
|
|
|
|
|
|
|
|
|
| development |
TAIR-GO |
43 |
0.002 |
5 |
0.148 |
|
|
|
|
|
|
|
|
|
|
|
| chlorophyll binding |
TAIR-GO |
42 |
0.000 |
5 |
0.001 |
|
|
|
|
|
|
|
|
|
|
|
| TCA cycle -- aerobic respiration |
AraCyc |
42 |
0.002 |
8 |
0.067 |
|
|
|
|
|
|
|
|
|
|
|
| aerobic respiration |
FunCat |
42 |
0.000 |
6 |
0.000 |
|
|
|
|
|
|
|
|
|
|
|
| respiration |
FunCat |
42 |
0.000 |
6 |
0.000 |
|
|
|
|
|
|
|
|
|
|
|
| Carotenoid and abscisic acid metabolism |
LitPath |
42 |
0.000 |
5 |
0.027 |
|
|
|
|
|
|
|
|
|
|
|
| Methionin/SAM/ethylene metabolism from cysteine and aspartate |
BioPath |
40 |
0.001 |
4 |
0.212 |
|
|
|
|
|
|
|
|
|
|
|
| TCA cycle variation VIII |
AraCyc |
40 |
0.022 |
7 |
0.164 |
|
|
|
|
|
|
|
|
|
|
|
| brassinosteroid biosynthesis |
LitPath |
40 |
0.000 |
4 |
0.085 |
|
|
|
|
|
|
|
|
|
|
|
| sterol and brassinosteroid biosynthesis |
LitPath |
40 |
0.000 |
4 |
0.022 |
|
|
|
|
|
|
|
|
|
|
|
|
|
|
|
|
|
|
|
|
|
|
|
|
|
|
|
|