|
|
|
|
|
|
|
|
|
|
|
|
|
|
|
|
|
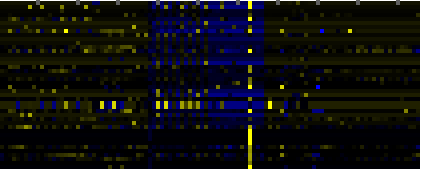
| Pathways co-expressed in the Hormone etc. data set (with more than 6 annotation points) |
|
CYP720A1 (At1g73340) |
|
|
|
|
|
|
|
|
| max. difference between log2-ratios: |
4.1 |
|
|
|
|
|
|
|
|
|
|
|
|
| max. difference between log2-ratios excluding lowest and highest 5%: |
1.2 |
|
|
|
|
|
|
|
|
|
|
|
|
| Pathway |
Source |
Scores of Genes |
p[Score] |
No. of Genes |
p[genes] |
Link to hormones etc. heatmap |
|
|
|
|
|
|
|
| Leaf Glycerolipid Biosynthesis |
BioPath |
28 |
0.000 |
4 |
0.010 |
|
|
|
|
|
|
| Leaf Glycerolipid Biosynthesis in Plastid |
BioPath |
28 |
0.000 |
4 |
0.000 |
|
|
|
|
|
| Synthesis of membrane lipids in plastids |
AcylLipid |
20 |
0.000 |
2 |
0.003 |
|
|
|
|
|
| Phenylpropanoid Metabolism |
BioPath |
13 |
0.009 |
3 |
0.043 |
|
|
|
|
|
| gibberellin biosynthesis |
AraCyc |
13 |
0.000 |
2 |
0.000 |
|
|
|
|
|
| Benzoate degradation via CoA ligation |
KEGG |
11 |
0.000 |
2 |
0.045 |
|
|
|
|
|
| Inositol phosphate metabolism |
KEGG |
11 |
0.000 |
2 |
0.055 |
|
|
|
|
|
| Nicotinate and nicotinamide metabolism |
KEGG |
11 |
0.000 |
2 |
0.036 |
|
|
|
|
|
| Glucosyltransferases for benzoic acids |
BioPath |
10 |
0.000 |
1 |
0.004 |
|
|
|
|
|
| cellular response to phosphate starvation |
TAIR-GO |
10 |
0.000 |
1 |
0.002 |
|
|
|
|
|
| galactolipid biosynthesis |
TAIR-GO |
10 |
0.000 |
1 |
0.001 |
|
|
|
|
|
| lipid biosynthesis |
TAIR-GO |
10 |
0.000 |
1 |
0.001 |
|
|
|
|
|
|
|
|
|
|
|
| lipid metabolism |
TAIR-GO |
10 |
0.000 |
1 |
0.000 |
|
|
|
|
|
|
|
|
|
|
|
| phospholipid metabolism |
TAIR-GO |
10 |
0.000 |
1 |
0.000 |
|
|
|
|
|
|
|
|
|
|
|
| glycosylglyceride biosynthesis |
AraCyc |
10 |
0.000 |
1 |
0.001 |
|
|
|
|
|
|
|
|
|
|
|
| phospholipid biosynthesis II |
AraCyc |
10 |
0.000 |
1 |
0.011 |
|
|
|
|
|
|
|
|
|
|
|
| triacylglycerol biosynthesis |
AraCyc |
10 |
0.000 |
1 |
0.001 |
|
|
|
|
|
|
|
|
|
|
|
| C-compound and carbohydrate utilization |
FunCat |
10 |
0.000 |
1 |
0.000 |
|
|
|
|
|
|
|
|
|
|
|
| lipid, fatty acid and isoprenoid metabolism |
FunCat |
10 |
0.000 |
1 |
0.009 |
|
|
|
|
|
|
|
|
|
|
|
| calcium ion transport |
TAIR-GO |
9 |
0.000 |
1 |
0.000 |
|
|
|
|
|
|
|
|
|
|
|
| cytokinin catabolism |
TAIR-GO |
9 |
0.000 |
1 |
0.001 |
|
|
|
|
|
|
|
|
|
|
|
| gibberellic acid biosynthesis |
TAIR-GO |
9 |
0.000 |
1 |
0.004 |
|
|
|
|
|
|
|
|
|
|
|
| metal ion transport |
TAIR-GO |
9 |
0.000 |
1 |
0.000 |
|
|
|
|
|
|
|
|
|
|
|
| N-terminal protein myristoylation |
TAIR-GO |
9 |
0.000 |
1 |
0.004 |
|
|
|
|
|
|
|
|
|
|
|
| cytokinins degradation |
AraCyc |
9 |
0.000 |
1 |
0.000 |
|
|
|
|
|
|
|
|
|
|
|
| intracellular signalling |
FunCat |
9 |
0.000 |
1 |
0.015 |
|
|
|
|
|
|
|
|
|
|
|
| Membrane Transport |
KEGG |
9 |
0.000 |
1 |
0.016 |
|
|
|
|
|
|
|
|
|
|
|
| Other ion-coupled transporters |
KEGG |
9 |
0.000 |
1 |
0.005 |
|
|
|
|
|
|
|
|
|
|
|
| Ion channels |
KEGG |
8 |
0.000 |
4 |
0.000 |
|
|
|
|
|
|
|
|
|
|
|
| Ligand-Receptor Interaction |
KEGG |
8 |
0.000 |
4 |
0.000 |
|
|
|
|
|
|
|
|
|
|
|
| Synthesis of fatty acids in plastids |
AcylLipid |
8 |
0.009 |
2 |
0.027 |
|
|
|
|
|
|
|
|
|
|
|
|
|
|
|
|
|
|
|
|
|
|
|
|
|
|
|
|
|
|
|
|
|
|
|
|
|
|
|
|
|
|
|
|
|
|
|
|
|
|
|
|
|
|
|
|
|
|
|
|
|
|
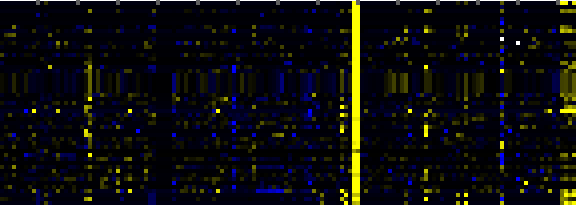
| Pathways co-expressed in the Mutant data set (with more than 10 annotation points) |
|
CYP720A1 (At1g73340) |
|
|
|
|
|
|
|
|
| max. difference between log2-ratios: |
6.5 |
|
|
|
|
|
|
|
|
|
|
|
|
| max. difference between log2-ratios excluding lowest and highest 5%: |
0.7 |
|
|
|
|
|
|
|
|
|
|
|
|
| Pathway |
Source |
Scores of Genes |
p[Score] |
No. of Genes |
p[genes] |
Link to mutants heatmap |
|
|
|
|
|
|
|
| Phenylpropanoid Metabolism |
BioPath |
88 |
0.000 |
13 |
0.000 |
|
|
|
|
| Aromatic amino acid (Phe, Tyr, Trp) metabolism |
BioPath |
62 |
0.000 |
9 |
0.000 |
|
|
|
| Shikimate pathway |
LitPath |
62 |
0.000 |
9 |
0.000 |
|
|
|
| tryptophan biosynthesis |
TAIR-GO |
58 |
0.000 |
8 |
0.000 |
|
|
|
| Trp biosyntesis |
LitPath |
58 |
0.000 |
8 |
0.000 |
|
|
|
| tryptophan biosynthesis |
AraCyc |
48 |
0.000 |
7 |
0.000 |
|
|
|
| Biosynthesis of Amino Acids and Derivatives |
BioPath |
46 |
0.000 |
7 |
0.051 |
|
|
|
| Phenylpropanoid pathway |
LitPath |
46 |
0.000 |
8 |
0.020 |
|
|
|
| response to pathogenic bacteria |
TAIR-GO |
38 |
0.000 |
6 |
0.000 |
|
|
|
| Methionin/SAM/ethylene metabolism from cysteine and aspartate |
BioPath |
32 |
0.000 |
4 |
0.001 |
|
|
|
| lignin biosynthesis |
AraCyc |
30 |
0.000 |
5 |
0.000 |
|
|
|
| Phenylalanine, tyrosine and tryptophan biosynthesis |
KEGG |
28 |
0.000 |
4 |
0.006 |
|
|
|
| core phenylpropanoid metabolism |
BioPath |
26 |
0.000 |
4 |
0.005 |
|
|
|
| biosynthesis of proto- and siroheme |
AraCyc |
24 |
0.000 |
3 |
0.007 |
|
|
|
|
|
|
|
|
|
|
|
| biogenesis of chloroplast |
FunCat |
24 |
0.000 |
3 |
0.041 |
|
|
|
|
|
|
|
|
|
|
|
| secondary metabolism |
FunCat |
22 |
0.000 |
4 |
0.009 |
|
|
|
|
|
|
|
|
|
|
|
| Propanoate metabolism |
KEGG |
22 |
0.000 |
3 |
0.008 |
|
|
|
|
|
|
|
|
|
|
|
| Benzoate degradation via CoA ligation |
KEGG |
21 |
0.000 |
7 |
0.002 |
|
|
|
|
|
|
|
|
|
|
|
| Inositol phosphate metabolism |
KEGG |
21 |
0.000 |
7 |
0.004 |
|
|
|
|
|
|
|
|
|
|
|
| Nicotinate and nicotinamide metabolism |
KEGG |
21 |
0.000 |
7 |
0.001 |
|
|
|
|
|
|
|
|
|
|
|
| Chlorophyll biosynthesis and breakdown |
BioPath |
20 |
0.000 |
2 |
0.047 |
|
|
|
|
|
|
|
|
|
|
|
| amino acid metabolism |
FunCat |
20 |
0.013 |
3 |
0.179 |
|
|
|
|
|
|
|
|
|
|
|
| Porphyrin and chlorophyll metabolism |
KEGG |
20 |
0.000 |
2 |
0.035 |
|
|
|
|
|
|
|
|
|
|
|
| Lipid signaling |
AcylLipid |
20 |
0.005 |
7 |
0.073 |
|
|
|
|
|
|
|
|
|
|
|
| gibberellic acid catabolism |
TAIR-GO |
19 |
0.000 |
2 |
0.000 |
|
|
|
|
|
|
|
|
|
|
|
| C-compound and carbohydrate utilization |
FunCat |
19 |
0.000 |
5 |
0.000 |
|
|
|
|
|
|
|
|
|
|
|
| Nucleotide sugars metabolism |
KEGG |
18 |
0.000 |
5 |
0.000 |
|
|
|
|
|
|
|
|
|
|
|
| defense response |
TAIR-GO |
17 |
0.000 |
3 |
0.001 |
|
|
|
|
|
|
|
|
|
|
|
| ethylene biosynthesis |
TAIR-GO |
16 |
0.000 |
2 |
0.001 |
|
|
|
|
|
|
|
|
|
|
|
| response to wounding |
TAIR-GO |
16 |
0.000 |
3 |
0.002 |
|
|
|
|
|
|
|
|
|
|
|
| metabolism of the cysteine - aromatic group |
FunCat |
16 |
0.000 |
2 |
0.001 |
|
|
|
|
|
|
|
|
|
|
|
| Stilbene, coumarine and lignin biosynthesis |
KEGG |
15 |
0.012 |
4 |
0.127 |
|
|
|
|
|
|
|
|
|
|
|
| toxin catabolism |
TAIR-GO |
14 |
0.000 |
7 |
0.000 |
|
|
|
|
|
|
|
|
|
|
|
| chlorophyll biosynthesis |
AraCyc |
14 |
0.001 |
2 |
0.075 |
|
|
|
|
|
|
|
|
|
|
|
| Phenylalanine metabolism |
KEGG |
14 |
0.006 |
4 |
0.084 |
|
|
|
|
|
|
|
|
|
|
|
| Glycan Biosynthesis and Metabolism |
KEGG |
13 |
0.019 |
5 |
0.007 |
|
|
|
|
|
|
|
|
|
|
|
| cellulose biosynthesis |
BioPath |
12 |
0.016 |
2 |
0.100 |
|
|
|
|
|
|
|
|
|
|
|
| colanic acid building blocks biosynthesis |
AraCyc |
12 |
0.002 |
2 |
0.090 |
|
|
|
|
|
|
|
|
|
|
|
| flavonoid biosynthesis |
AraCyc |
12 |
0.000 |
2 |
0.014 |
|
|
|
|
|
|
|
|
|
|
|
| Alanine and aspartate metabolism |
KEGG |
12 |
0.000 |
2 |
0.050 |
|
|
|
|
|
|
|
|
|
|
|
| beta-Alanine metabolism |
KEGG |
12 |
0.000 |
2 |
0.016 |
|
|
|
|
|
|
|
|
|
|
|
| Butanoate metabolism |
KEGG |
12 |
0.000 |
2 |
0.029 |
|
|
|
|
|
|
|
|
|
|
|
| Fructose and mannose metabolism |
KEGG |
12 |
0.013 |
2 |
0.126 |
|
|
|
|
|
|
|
|
|
|
|
| Glutamate metabolism |
KEGG |
12 |
0.024 |
2 |
0.108 |
|
|
|
|
|
|
|
|
|
|
|
| Taurine and hypotaurine metabolism |
KEGG |
12 |
0.000 |
2 |
0.000 |
|
|
|
|
|
|
|
|
|
|
|
|
|
|
|
|
|
|
|
|
|
|
|
|
|
|
|
|