|
|
|
|
|
|
|
|
|
|
|
|
|
|
|
|
|
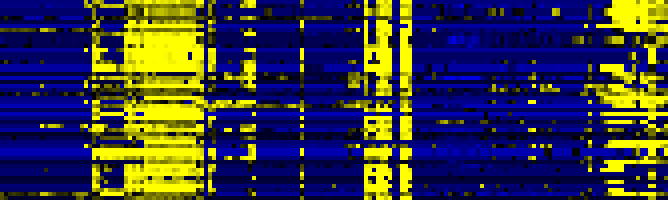
| Pathways co-expressed in the Organ and Tissue data set (with more than 10 annotation points) |
|
CYP72A14 / CYP72A11 / CYP72A12 (At3g14680 / At3g14650 / At3g14660) |
|
|
|
|
|
|
|
|
| max. difference between log2-ratios: |
6.8 |
|
|
|
|
|
|
|
|
|
|
|
|
| max. difference between log2-ratios excluding lowest and highest 5%: |
5.9 |
|
|
|
|
|
|
|
|
|
|
|
|
| Pathway |
Source |
Scores of Genes |
p[Score] |
No. of Genes |
p[genes] |
Link to organ heatmap |
|
|
|
|
|
|
|
| Stilbene, coumarine and lignin biosynthesis |
KEGG |
33 |
0.000 |
10 |
0.000 |
|
|
|
| Phenylpropanoid Metabolism |
BioPath |
26 |
0.000 |
4 |
0.004 |
|
|
| glycolysis and gluconeogenesis |
FunCat |
20 |
0.000 |
3 |
0.008 |
|
|
| monoterpenoid biosynthesis |
TAIR-GO |
19 |
0.000 |
2 |
0.000 |
|
|
| mono-/sesqui-/di-terpene biosynthesis |
LitPath |
19 |
0.000 |
2 |
0.022 |
|
|
| monoterpene biosynthesis |
LitPath |
19 |
0.000 |
2 |
0.000 |
|
|
| terpenoid metabolism |
LitPath |
19 |
0.000 |
2 |
0.024 |
|
|
| C-compound and carbohydrate metabolism |
FunCat |
18 |
0.002 |
4 |
0.033 |
|
|
| Lipid signaling |
AcylLipid |
18 |
0.000 |
3 |
0.069 |
|
|
| Ascorbate and aldarate metabolism |
KEGG |
17 |
0.000 |
2 |
0.004 |
|
|
| Fluorene degradation |
KEGG |
17 |
0.000 |
2 |
0.001 |
|
|
| gamma-Hexachlorocyclohexane degradation |
KEGG |
17 |
0.000 |
2 |
0.001 |
|
|
| detoxification |
FunCat |
16 |
0.000 |
4 |
0.000 |
|
|
|
|
|
|
|
|
|
|
|
| Methane metabolism |
KEGG |
16 |
0.000 |
8 |
0.000 |
|
|
|
|
|
|
|
|
|
|
|
| Phenylalanine metabolism |
KEGG |
16 |
0.000 |
8 |
0.000 |
|
|
|
|
|
|
|
|
|
|
|
| Prostaglandin and leukotriene metabolism |
KEGG |
16 |
0.000 |
8 |
0.000 |
|
|
|
|
|
|
|
|
|
|
|
| Intermediary Carbon Metabolism |
BioPath |
14 |
0.000 |
2 |
0.075 |
|
|
|
|
|
|
|
|
|
|
|
| glyoxylate cycle |
AraCyc |
14 |
0.000 |
2 |
0.000 |
|
|
|
|
|
|
|
|
|
|
|
| TCA cycle variation VII |
AraCyc |
14 |
0.000 |
2 |
0.012 |
|
|
|
|
|
|
|
|
|
|
|
| TCA cycle variation VIII |
AraCyc |
14 |
0.000 |
2 |
0.005 |
|
|
|
|
|
|
|
|
|
|
|
| Glyoxylate and dicarboxylate metabolism |
KEGG |
14 |
0.000 |
2 |
0.005 |
|
|
|
|
|
|
|
|
|
|
|
| Pyruvate metabolism |
KEGG |
14 |
0.000 |
2 |
0.061 |
|
|
|
|
|
|
|
|
|
|
|
|
|
|
|
|
|
|
|
|
|
|
|
|
|
|
|
|
|
|
|
|
|
|
|
|
|
|
|
|
|
|
|
|
|
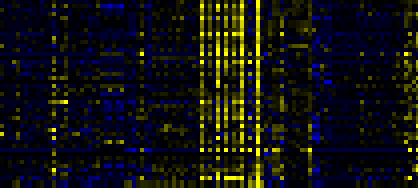
| Pathways co-expressed in the Stress data set ( with more than 6 annotation points) |
|
CYP72A14 / CYP72A11 / CYP72A12 (At3g14680 / At3g14650 / At3g14660) |
|
|
|
|
|
|
|
|
| max. difference between log2-ratios: |
7.1 |
|
|
|
|
|
|
|
|
|
|
|
|
| max. difference between log2-ratios excluding lowest and highest 5%: |
1.2 |
|
|
|
|
|
|
|
|
|
|
|
|
| Pathway |
Source |
Scores of Genes |
p[Score] |
No. of Genes |
p[genes] |
Link to stress heatmap |
|
|
|
|
|
|
|
| Glucosyltransferases for benzoic acids |
BioPath |
10 |
0.000 |
1 |
0.000 |

|
| Phenylpropanoid Metabolism |
BioPath |
10 |
0.000 |
1 |
0.023 |
| cell plate formation (sensu Magnoliophyta) |
TAIR-GO |
10 |
0.000 |
1 |
0.000 |
| leucine catabolism |
TAIR-GO |
10 |
0.000 |
1 |
0.000 |
|
|
|
|
|
|
|
|
|
|
|
| leucine degradation I |
AraCyc |
10 |
0.000 |
1 |
0.000 |
|
|
|
|
|
|
|
|
|
|
|
| leucine degradation II |
AraCyc |
10 |
0.000 |
1 |
0.000 |
|
|
|
|
|
|
|
|
|
|
|
| amino acid metabolism |
FunCat |
10 |
0.000 |
1 |
0.000 |
|
|
|
|
|
|
|
|
|
|
|
| Valine, leucine and isoleucine degradation |
KEGG |
10 |
0.000 |
1 |
0.000 |
|
|
|
|
|
|
|
|
|
|
|
| metabolism of acyl-lipids in mitochondria |
AcylLipid |
10 |
0.000 |
1 |
0.000 |
|
|
|
|
|
|
|
|
|
|
|
|
|
|
|
|
|
|
|
|
|
|
|
|
|
|
|
|
|
|
|
|
|
|
|
|
|
|
|
|
|
|
|
|
|
| Pathways co-expressed in the Hormone etc. data set (with more than 10 annotation points) |
|
CYP72A14 / CYP72A11 / CYP72A12 (At3g14680 / At3g14650 / At3g14660) |
|
|
|
|
|
|
|
|
| max. difference between log2-ratios: |
4.7 |
|
|
|
|
|
|
|
|
|
|
|
|
| max. difference between log2-ratios excluding lowest and highest 5%: |
1.2 |
|
|
|
|
|
|
|
|
|
|
|
|
| Pathway |
Source |
Scores of Genes |
p[Score] |
No. of Genes |
p[genes] |
Link to hormones etc. heatmap |
|
|
|
|
|
|
|
| Phenylpropanoid Metabolism |
BioPath |
43 |
0.000 |
6 |
0.001 |
|
|
|
|
|
|
| Biosynthesis of Amino Acids and Derivatives |
BioPath |
30 |
0.000 |
3 |
0.067 |
|
|
|
|
|
| Glucosyltransferases for benzoic acids |
BioPath |
30 |
0.000 |
3 |
0.000 |
|
|
|
|
|
| Glutathione metabolism |
BioPath |
30 |
0.000 |
3 |
0.004 |
|
|
|
|
|
| sulfate assimilation III |
AraCyc |
22 |
0.000 |
3 |
0.000 |
|
|
|
|
|
| nitrogen and sulfur metabolism |
FunCat |
20 |
0.000 |
2 |
0.000 |
|
|
|
|
|
| Stilbene, coumarine and lignin biosynthesis |
KEGG |
19 |
0.000 |
3 |
0.005 |
|
|
|
|
|
| toxin catabolism |
TAIR-GO |
18 |
0.000 |
5 |
0.000 |
|
|
|
|
|
| C-compound and carbohydrate utilization |
FunCat |
16 |
0.000 |
2 |
0.000 |
|
|
|
|
|
| jasmonic acid biosynthesis |
TAIR-GO |
12 |
0.000 |
2 |
0.001 |
|
|
|
|
|
| cysteine biosynthesis I |
AraCyc |
12 |
0.000 |
2 |
0.004 |
|
|
|
|
|
| jasmonic acid biosynthesis |
AraCyc |
12 |
0.000 |
2 |
0.000 |
|
|
|
|
|
| lignin biosynthesis |
AraCyc |
12 |
0.000 |
2 |
0.005 |
|
|
|
|
|
|
|
|
|
|
|
| phenylalanine degradation I |
AraCyc |
12 |
0.000 |
2 |
0.001 |
|
|
|
|
|
|
|
|
|
|
|
| tyrosine degradation |
AraCyc |
12 |
0.000 |
2 |
0.000 |
|
|
|
|
|
|
|
|
|
|
|
| Phenylalanine metabolism |
KEGG |
12 |
0.000 |
2 |
0.024 |
|
|
|
|
|
|
|
|
|
|
|
| Tyrosine metabolism |
KEGG |
12 |
0.000 |
2 |
0.003 |
|
|
|
|
|
|
|
|
|
|
|
| Phenylpropanoid pathway |
LitPath |
12 |
0.000 |
2 |
0.002 |
|
|
|
|
|
|
|
|
|
|
|
|
|
|
|
|
|
|
|
|
|
|
|
|
|
|
|
|
|
|
|
|
|
|
|
|
|
|
|
|
|
|
|
|
|
|
|
|
|
|
|
|
|
|
|
|
|
|
|
|
|
|
| Pathways co-expressed in the Mutant data set (with more than 6 annotation points) |
|
CYP72A14 / CYP72A11 / CYP72A12 (At3g14680 / At3g14650 / At3g14660) |
|
|
|
|
|
|
|
|
| max. difference between log2-ratios: |
3.6 |
|
|
|
|
|
|
|
|
|
|
|
|
| max. difference between log2-ratios excluding lowest and highest 5%: |
1.6 |
|
|
|
|
|
|
|
|
|
|
|
|
| Pathway |
Source |
Scores of Genes |
p[Score] |
No. of Genes |
p[genes] |
Link to mutants heatmap |
|
|
|
|
|
|
|
| Valine, leucine and isoleucine degradation |
KEGG |
15 |
0.000 |
3 |
0.000 |

|
|
|
|
| metabolism of acyl-lipids in mitochondria |
AcylLipid |
13 |
0.000 |
2 |
0.000 |
|
|
|
| core phenylpropanoid metabolism |
BioPath |
10 |
0.000 |
1 |
0.006 |
|
|
|
| Phenylpropanoid Metabolism |
BioPath |
10 |
0.000 |
1 |
0.071 |
|
|
|
|
|
|
|
|
|
|
|
| Plastidial Isoprenoids (Chlorophylls, Carotenoids, Tocopherols, Plastoquinone, Phylloquinone) |
BioPath |
10 |
0.000 |
1 |
0.018 |
|
|
|
|
|
|
|
|
|
|
|
| Tocopherol biosynthesis |
BioPath |
10 |
0.000 |
1 |
0.000 |
|
|
|
|
|
|
|
|
|
|
|
| carotenoid biosynthesis |
TAIR-GO |
10 |
0.000 |
1 |
0.000 |
|
|
|
|
|
|
|
|
|
|
|
| lignin biosynthesis |
TAIR-GO |
10 |
0.000 |
1 |
0.001 |
|
|
|
|
|
|
|
|
|
|
|
| plastoquinone biosynthesis |
TAIR-GO |
10 |
0.000 |
1 |
0.000 |
|
|
|
|
|
|
|
|
|
|
|
| vitamin E biosynthesis |
TAIR-GO |
10 |
0.000 |
1 |
0.000 |
|
|
|
|
|
|
|
|
|
|
|
| lignin biosynthesis |
AraCyc |
10 |
0.000 |
1 |
0.004 |
|
|
|
|
|
|
|
|
|
|
|
| phenylalanine degradation I |
AraCyc |
10 |
0.000 |
1 |
0.002 |
|
|
|
|
|
|
|
|
|
|
|
| plastoquinone biosynthesis |
AraCyc |
10 |
0.000 |
1 |
0.000 |
|
|
|
|
|
|
|
|
|
|
|
| tyrosine degradation |
AraCyc |
10 |
0.000 |
1 |
0.000 |
|
|
|
|
|
|
|
|
|
|
|
| vitamin E biosynthesis |
AraCyc |
10 |
0.000 |
1 |
0.000 |
|
|
|
|
|
|
|
|
|
|
|
| Phenylalanine metabolism |
KEGG |
10 |
0.000 |
1 |
0.016 |
|
|
|
|
|
|
|
|
|
|
|
| Tyrosine metabolism |
KEGG |
10 |
0.000 |
1 |
0.004 |
|
|
|
|
|
|
|
|
|
|
|
| Phenylpropanoid pathway |
LitPath |
10 |
0.000 |
1 |
0.000 |
|
|
|
|
|
|
|
|
|
|
|
| leucine catabolism |
TAIR-GO |
9 |
0.000 |
1 |
0.000 |
|
|
|
|
|
|
|
|
|
|
|
| leucine degradation I |
AraCyc |
9 |
0.000 |
1 |
0.001 |
|
|
|
|
|
|
|
|
|
|
|
| leucine degradation II |
AraCyc |
9 |
0.000 |
1 |
0.000 |
|
|
|
|
|
|
|
|
|
|
|
|
|
|
|
|
|
|
|
|
|
|
|
|
|
|
|
|