|
|
|
|
|
|
|
|
|
|
|
|
|
|
|
|
|
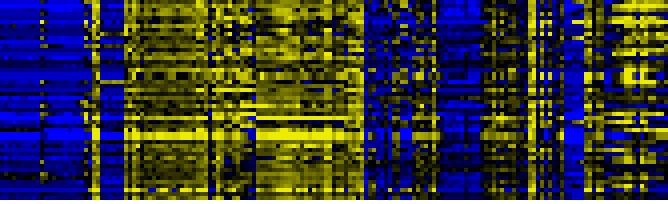
| Pathways co-expressed in the Organ and Tissue data set (with more than 10 annotation points) |
|
CYP72A15 (At3g14690) |
|
|
|
|
|
|
|
|
| max. difference between log2-ratios: |
5.5 |
|
|
|
|
|
|
|
|
|
|
|
|
| max. difference between log2-ratios excluding lowest and highest 5%: |
4.6 |
|
|
|
|
|
|
|
|
|
|
|
|
| Pathway |
Source |
Scores of Genes |
p[Score] |
No. of Genes |
p[genes] |
Link to organ heatmap |
|
|
|
|
|
|
|
| Plastidial Isoprenoids (Chlorophylls, Carotenoids, Tocopherols, Plastoquinone, Phylloquinone) |
BioPath |
54 |
0.000 |
6 |
0.001 |
|
|
|
| Carotenoid and abscisic acid metabolism |
LitPath |
50 |
0.000 |
6 |
0.000 |
|
|
| Carotenoid biosynthesis |
BioPath |
44 |
0.000 |
5 |
0.000 |
|
|
| carotenoid biosynthesis |
AraCyc |
44 |
0.000 |
5 |
0.000 |
|
|
| carotenid biosynthesis |
LitPath |
44 |
0.000 |
5 |
0.000 |
|
|
| C-compound and carbohydrate metabolism |
FunCat |
34 |
0.000 |
10 |
0.001 |
|
|
| Biosynthesis of steroids |
KEGG |
34 |
0.000 |
5 |
0.000 |
|
|
| biogenesis of chloroplast |
FunCat |
22 |
0.000 |
3 |
0.010 |
|
|
| Pathway for nuclear-encoded, thylakoid-localized proteins |
BioPath |
20 |
0.000 |
2 |
0.001 |
|
|
| Folding, Sorting and Degradation |
KEGG |
20 |
0.000 |
2 |
0.061 |
|
|
| Protein export |
KEGG |
20 |
0.000 |
2 |
0.002 |
|
|
| carotene biosynthesis |
TAIR-GO |
18 |
0.000 |
2 |
0.000 |
|
|
| xanthophyll cycle |
AraCyc |
18 |
0.000 |
2 |
0.000 |
|
|
| photorespiration |
AraCyc |
17 |
0.000 |
4 |
0.000 |
|
|
|
|
|
|
|
|
|
|
|
| Biosynthesis of prenyl diphosphates |
BioPath |
14 |
0.002 |
2 |
0.042 |
|
|
|
|
|
|
|
|
|
|
|
| response to water deprivation |
TAIR-GO |
14 |
0.000 |
2 |
0.000 |
|
|
|
|
|
|
|
|
|
|
|
| Carbon fixation |
KEGG |
14 |
0.000 |
3 |
0.002 |
|
|
|
|
|
|
|
|
|
|
|
| polyprenyl diphosphate biosynthesis |
LitPath |
14 |
0.000 |
2 |
0.001 |
|
|
|
|
|
|
|
|
|
|
|
| glycine biosynthesis I |
AraCyc |
13 |
0.000 |
3 |
0.005 |
|
|
|
|
|
|
|
|
|
|
|
| superpathway of serine and glycine biosynthesis II |
AraCyc |
13 |
0.000 |
3 |
0.000 |
|
|
|
|
|
|
|
|
|
|
|
| jasmonic acid biosynthesis |
TAIR-GO |
12 |
0.000 |
2 |
0.005 |
|
|
|
|
|
|
|
|
|
|
|
| response to ethylene stimulus |
TAIR-GO |
12 |
0.000 |
3 |
0.000 |
|
|
|
|
|
|
|
|
|
|
|
| Calvin cycle |
AraCyc |
12 |
0.000 |
2 |
0.022 |
|
|
|
|
|
|
|
|
|
|
|
| jasmonic acid biosynthesis |
AraCyc |
12 |
0.000 |
2 |
0.003 |
|
|
|
|
|
|
|
|
|
|
|
| biosynthesis of derivatives of homoisopentenyl pyrophosphate |
FunCat |
12 |
0.000 |
2 |
0.001 |
|
|
|
|
|
|
|
|
|
|
|
| glycolysis and gluconeogenesis |
FunCat |
12 |
0.042 |
3 |
0.081 |
|
|
|
|
|
|
|
|
|
|
|
| photosynthesis |
FunCat |
12 |
0.000 |
3 |
0.003 |
|
|
|
|
|
|
|
|
|
|
|
| Glyoxylate and dicarboxylate metabolism |
KEGG |
12 |
0.000 |
3 |
0.000 |
|
|
|
|
|
|
|
|
|
|
|
| Pentose phosphate pathway |
KEGG |
12 |
0.000 |
2 |
0.005 |
|
|
|
|
|
|
|
|
|
|
|
|
|
|
|
|
|
|
|
|
|
|
|
|
|
|
|
|
|
|
|
|
|
|
|
|
|
|
|
|
|
|
|
|
|
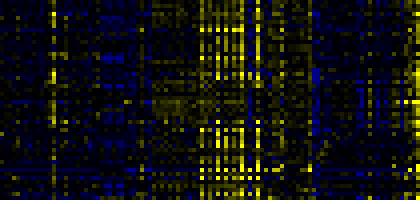
| Pathways co-expressed in the Stress data set ( with more than 6 annotation points) |
|
CYP72A15 (At3g14690) |
|
|
|
|
|
|
|
|
| max. difference between log2-ratios: |
10.0 |
|
|
|
|
|
|
|
|
|
|
|
|
| max. difference between log2-ratios excluding lowest and highest 5%: |
2.0 |
|
|
|
|
|
|
|
|
|
|
|
|
| Pathway |
Source |
Scores of Genes |
p[Score] |
No. of Genes |
p[genes] |
Link to stress heatmap |
|
|
|
|
|
|
|
| Carotenoid biosynthesis |
BioPath |
8 |
0.000 |
1 |
0.000 |

|
| Plastidial Isoprenoids (Chlorophylls, Carotenoids, Tocopherols, Plastoquinone, Phylloquinone) |
BioPath |
8 |
0.000 |
1 |
0.006 |
| abscisic acid biosynthesis |
TAIR-GO |
8 |
0.000 |
1 |
0.000 |
| response to osmotic stress |
TAIR-GO |
8 |
0.000 |
1 |
0.000 |
|
|
|
|
|
|
|
|
|
|
|
| response to water deprivation |
TAIR-GO |
8 |
0.000 |
1 |
0.000 |
|
|
|
|
|
|
|
|
|
|
|
| sugar mediated signaling |
TAIR-GO |
8 |
0.000 |
1 |
0.000 |
|
|
|
|
|
|
|
|
|
|
|
| xanthophyll biosynthesis |
TAIR-GO |
8 |
0.000 |
1 |
0.000 |
|
|
|
|
|
|
|
|
|
|
|
| carotenoid biosynthesis |
AraCyc |
8 |
0.000 |
1 |
0.000 |
|
|
|
|
|
|
|
|
|
|
|
| xanthophyll cycle |
AraCyc |
8 |
0.000 |
1 |
0.000 |
|
|
|
|
|
|
|
|
|
|
|
| carotenid biosynthesis |
LitPath |
8 |
0.000 |
1 |
0.002 |
|
|
|
|
|
|
|
|
|
|
|
| Carotenoid and abscisic acid metabolism |
LitPath |
8 |
0.000 |
1 |
0.009 |
|
|
|
|
|
|
|
|
|
|
|
| triterpene, sterol, and brassinosteroid metabolism |
LitPath |
8 |
0.000 |
2 |
0.008 |
|
|
|
|
|
|
|
|
|
|
|
|
|
|
|
|
|
|
|
|
|
|
|
|
|
|
|
|
|
|
|
|
|
|
|
|
|
|
|
|
|
|
|
|
|
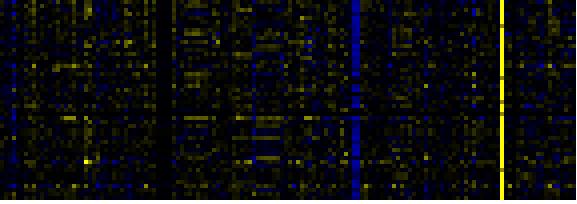
| Pathways co-expressed in the Hormone etc. data set (with more than 10 annotation points) |
|
CYP72A15 (At3g14690) |
|
|
|
|
|
|
|
|
| max. difference between log2-ratios: |
3.5 |
|
|
|
|
|
|
|
|
|
|
|
|
| max. difference between log2-ratios excluding lowest and highest 5%: |
1.8 |
|
|
|
|
|
|
|
|
|
|
|
|
| Pathway |
Source |
Scores of Genes |
p[Score] |
No. of Genes |
p[genes] |
Link to hormones etc. heatmap |
|
|
|
|
|
|
|
| Phenylpropanoid Metabolism |
BioPath |
53 |
0.000 |
7 |
0.011 |
|
|
|
|
|
|
| Glutathione metabolism |
KEGG |
32 |
0.000 |
6 |
0.000 |
|
|
|
|
|
| Glucosyltransferases for benzoic acids |
BioPath |
30 |
0.000 |
3 |
0.000 |
|
|
|
|
|
| Glutathione metabolism |
BioPath |
24 |
0.000 |
3 |
0.035 |
|
|
|
|
|
| toxin catabolism |
TAIR-GO |
24 |
0.000 |
8 |
0.000 |
|
|
|
|
|
| C-compound and carbohydrate metabolism |
FunCat |
22 |
0.004 |
6 |
0.015 |
|
|
|
|
|
| IAA biosynthesis |
AraCyc |
18 |
0.000 |
2 |
0.001 |
|
|
|
|
|
| Tryptophan metabolism |
KEGG |
17 |
0.000 |
3 |
0.001 |
|
|
|
|
|
| additional photosystem II components |
BioPath |
16 |
0.000 |
2 |
0.032 |
|
|
|
|
|
| Early light-inducible proteins |
BioPath |
16 |
0.000 |
2 |
0.000 |
|
|
|
|
|
| alanine biosynthesis II |
AraCyc |
14 |
0.000 |
3 |
0.001 |
|
|
|
|
|
| lignin biosynthesis |
AraCyc |
14 |
0.000 |
3 |
0.004 |
|
|
|
|
|
| phenylalanine biosynthesis II |
AraCyc |
14 |
0.000 |
3 |
0.000 |
|
|
|
|
|
|
|
|
|
|
|
| phenylalanine degradation I |
AraCyc |
14 |
0.000 |
3 |
0.001 |
|
|
|
|
|
|
|
|
|
|
|
| tyrosine degradation |
AraCyc |
14 |
0.000 |
3 |
0.000 |
|
|
|
|
|
|
|
|
|
|
|
| stress response |
FunCat |
14 |
0.000 |
2 |
0.000 |
|
|
|
|
|
|
|
|
|
|
|
| transport |
FunCat |
14 |
0.000 |
2 |
0.000 |
|
|
|
|
|
|
|
|
|
|
|
| Phenylalanine, tyrosine and tryptophan biosynthesis |
KEGG |
14 |
0.000 |
3 |
0.004 |
|
|
|
|
|
|
|
|
|
|
|
| Phenylpropanoid pathway |
LitPath |
14 |
0.000 |
3 |
0.021 |
|
|
|
|
|
|
|
|
|
|
|
| Aromatic amino acid (Phe, Tyr, Trp) metabolism |
BioPath |
12 |
0.016 |
2 |
0.076 |
|
|
|
|
|
|
|
|
|
|
|
| Phenylalanine metabolism |
KEGG |
12 |
0.000 |
2 |
0.139 |
|
|
|
|
|
|
|
|
|
|
|
| Stilbene, coumarine and lignin biosynthesis |
KEGG |
12 |
0.001 |
2 |
0.182 |
|
|
|
|
|
|
|
|
|
|
|
| Tyrosine metabolism |
KEGG |
12 |
0.000 |
2 |
0.021 |
|
|
|
|
|
|
|
|
|
|
|
| ascorbate glutathione cycle |
AraCyc |
11 |
0.000 |
2 |
0.002 |
|
|
|
|
|
|
|
|
|
|
|
| nitrogen and sulfur utilization |
FunCat |
11 |
0.000 |
2 |
0.000 |
|
|
|
|
|
|
|
|
|
|
|
| Cyanoamino acid metabolism |
KEGG |
11 |
0.000 |
2 |
0.006 |
|
|
|
|
|
|
|
|
|
|
|
|
|
|
|
|
|
|
|
|
|
|
|
|
|
|
|
|
|
|
|
|
|
|
|
|
|
|
|
|
|
|
|
|
|
|
|
|
|
|
|
|
|
|
|
|
|
|
|
|
|
|
| Pathways co-expressed in the Mutant data set (with more than 25 annotation points) |
|
CYP72A15 (At3g14690) |
|
|
|
|
|
|
|
|
| max. difference between log2-ratios: |
5.8 |
|
|
|
|
|
|
|
|
|
|
|
|
| max. difference between log2-ratios excluding lowest and highest 5%: |
1.5 |
|
|
|
|
|
|
|
|
|
|
|
|
| Pathway |
Source |
Scores of Genes |
p[Score] |
No. of Genes |
p[genes] |
Link to mutants heatmap |
|
|
|
|
|
|
|
| Plastidial Isoprenoids (Chlorophylls, Carotenoids, Tocopherols, Plastoquinone, Phylloquinone) |
BioPath |
71 |
0.000 |
10 |
0.001 |
|
|
|
|
| Pyruvate metabolism |
KEGG |
64 |
0.000 |
9 |
0.006 |
|
|
|
| Intermediary Carbon Metabolism |
BioPath |
54 |
0.018 |
7 |
0.427 |
|
|
|
| Oxidative phosphorylation |
KEGG |
52 |
0.000 |
13 |
0.000 |
|
|
|
| transport |
FunCat |
48 |
0.000 |
11 |
0.000 |
|
|
|
| Glycerolipid metabolism |
KEGG |
45 |
0.000 |
6 |
0.002 |
|
|
|
| Glycolysis / Gluconeogenesis |
KEGG |
41 |
0.008 |
5 |
0.254 |
|
|
|
| tricarboxylic-acid pathway (citrate cycle, Krebs cycle, TCA cycle) |
FunCat |
40 |
0.011 |
5 |
0.382 |
|
|
|
| photorespiration |
AraCyc |
38 |
0.000 |
6 |
0.001 |
|
|
|
| Glycan Biosynthesis and Metabolism |
KEGG |
33 |
0.004 |
6 |
0.058 |
|
|
|
| ascorbic acid biosynthesis |
BioPath |
32 |
0.000 |
4 |
0.002 |
|
|
|
| Ascorbate and aldarate metabolism |
KEGG |
32 |
0.000 |
4 |
0.011 |
|
|
|
| Bile acid biosynthesis |
KEGG |
31 |
0.000 |
4 |
0.001 |
|
|
|
|
|
|
|
|
|
|
|
| Fatty acid metabolism |
KEGG |
31 |
0.000 |
4 |
0.037 |
|
|
|
|
|
|
|
|
|
|
|
| Glutathione metabolism |
BioPath |
30 |
0.019 |
5 |
0.092 |
|
|
|
|
|
|
|
|
|
|
|
| ATP-dependent proteolysis |
TAIR-GO |
30 |
0.000 |
6 |
0.000 |
|
|
|
|
|
|
|
|
|
|
|
| transport facilitation |
FunCat |
30 |
0.000 |
6 |
0.000 |
|
|
|
|
|
|
|
|
|
|
|
| Carotenoid and abscisic acid metabolism |
LitPath |
30 |
0.000 |
4 |
0.007 |
|
|
|
|
|
|
|
|
|
|
|
| energy |
FunCat |
28 |
0.000 |
6 |
0.000 |
|
|
|
|
|
|
|
|
|
|
|
| plant / fungal specific systemic sensing and response |
FunCat |
28 |
0.000 |
3 |
0.012 |
|
|
|
|
|
|
|
|
|
|
|
| plant hormonal regulation |
FunCat |
28 |
0.000 |
3 |
0.012 |
|
|
|
|
|
|
|
|
|
|
|
| Glutathione metabolism |
KEGG |
28 |
0.003 |
4 |
0.080 |
|
|
|
|
|
|
|
|
|
|
|
| Valine, leucine and isoleucine degradation |
KEGG |
28 |
0.000 |
4 |
0.042 |
|
|
|
|
|
|
|
|
|
|
|
| isoleucine degradation I |
AraCyc |
27 |
0.000 |
4 |
0.004 |
|
|
|
|
|
|
|
|
|
|
|
| isoleucine degradation III |
AraCyc |
27 |
0.000 |
4 |
0.000 |
|
|
|
|
|
|
|
|
|
|
|
| leucine degradation I |
AraCyc |
27 |
0.000 |
4 |
0.004 |
|
|
|
|
|
|
|
|
|
|
|
| leucine degradation II |
AraCyc |
27 |
0.000 |
4 |
0.000 |
|
|
|
|
|
|
|
|
|
|
|
| Chloroplastic protein turnover |
BioPath |
26 |
0.000 |
5 |
0.000 |
|
|
|
|
|
|
|
|
|
|
|
|
|
|
|
|
|
|
|
|
|
|
|
|
|
|
|
|