|
|
|
|
|
|
|
|
|
|
|
|
|
|
|
|
|
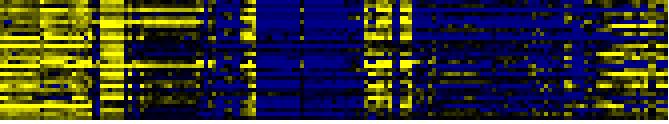
| Pathways co-expressed in the Organ and Tissue data set (with more than 10 annotation points) |
|
CYP72A7 (At3g14610) |
|
|
|
|
|
|
|
|
| max. difference between log2-ratios: |
5.3 |
|
|
|
|
|
|
|
|
|
|
|
|
| max. difference between log2-ratios excluding lowest and highest 5%: |
1.9 |
|
|
|
|
|
|
|
|
|
|
|
|
| Pathway |
Source |
Scores of Genes |
p[Score] |
No. of Genes |
p[genes] |
Link to organ heatmap |
|
|
|
|
|
|
|
| Glutamate metabolism |
KEGG |
31 |
0.000 |
4 |
0.001 |
|
|
|
| C-compound and carbohydrate metabolism |
FunCat |
25 |
0.003 |
5 |
0.054 |
|
|
| Glycolysis / Gluconeogenesis |
KEGG |
21 |
0.000 |
4 |
0.010 |
|
|
| Nitrogen metabolism |
KEGG |
19 |
0.000 |
2 |
0.017 |
|
|
| Intermediary Carbon Metabolism |
BioPath |
18 |
0.000 |
4 |
0.001 |
|
|
| fermentation |
FunCat |
17 |
0.000 |
3 |
0.000 |
|
|
| Tyrosine metabolism |
KEGG |
17 |
0.000 |
3 |
0.005 |
|
|
| amino acid metabolism |
FunCat |
16 |
0.002 |
2 |
0.094 |
|
|
| Calvin cycle |
AraCyc |
15 |
0.000 |
3 |
0.001 |
|
|
|
|
|
|
|
|
|
|
|
| Alanine and aspartate metabolism |
KEGG |
15 |
0.000 |
2 |
0.016 |
|
|
|
|
|
|
|
|
|
|
|
| ammonia assimilation cycle |
AraCyc |
14 |
0.000 |
2 |
0.000 |
|
|
|
|
|
|
|
|
|
|
|
| Methane metabolism |
KEGG |
13 |
0.000 |
3 |
0.050 |
|
|
|
|
|
|
|
|
|
|
|
| Tryptophan metabolism |
KEGG |
13 |
0.000 |
2 |
0.020 |
|
|
|
|
|
|
|
|
|
|
|
| non-oxidative branch of the pentose phosphate pathway |
AraCyc |
11 |
0.000 |
2 |
0.001 |
|
|
|
|
|
|
|
|
|
|
|
| oxidative branch of the pentose phosphate pathway |
AraCyc |
11 |
0.000 |
2 |
0.001 |
|
|
|
|
|
|
|
|
|
|
|
| 1- and 2-Methylnaphthalene degradation |
KEGG |
11 |
0.000 |
2 |
0.001 |
|
|
|
|
|
|
|
|
|
|
|
| Bile acid biosynthesis |
KEGG |
11 |
0.000 |
2 |
0.002 |
|
|
|
|
|
|
|
|
|
|
|
| Fatty acid metabolism |
KEGG |
11 |
0.003 |
2 |
0.020 |
|
|
|
|
|
|
|
|
|
|
|
| Glycerolipid metabolism |
KEGG |
11 |
0.001 |
2 |
0.018 |
|
|
|
|
|
|
|
|
|
|
|
|
|
|
|
|
|
|
|
|
|
|
|
|
|
|
|
|
|
|
|
|
|
|
|
|
|
|
|
|
|
|
|
|
|
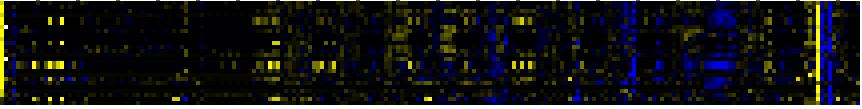
| Pathways co-expressed in the Stress data set ( with more than 9 annotation points) |
|
CYP72A7 (At3g14610) |
|
|
|
|
|
|
|
|
| max. difference between log2-ratios: |
4.5 |
|
|
|
|
|
|
|
|
|
|
|
|
| max. difference between log2-ratios excluding lowest and highest 5%: |
1.0 |
|
|
|
|
|
|
|
|
|
|
|
|
| Pathway |
Source |
Scores of Genes |
p[Score] |
No. of Genes |
p[genes] |
Link to stress heatmap |
|
|
|
|
|
|
|
| Stilbene, coumarine and lignin biosynthesis |
KEGG |
22 |
0.000 |
7 |
0.000 |
|
| Fatty acid elongation and wax and cutin metabolism |
AcylLipid |
14 |
0.000 |
2 |
0.036 |
| detoxification |
FunCat |
12 |
0.000 |
2 |
0.000 |
| Methane metabolism |
KEGG |
12 |
0.000 |
6 |
0.000 |
| Phenylalanine metabolism |
KEGG |
12 |
0.000 |
6 |
0.000 |
| Prostaglandin and leukotriene metabolism |
KEGG |
12 |
0.000 |
6 |
0.000 |
| fatty acid metabolism |
TAIR-GO |
10 |
0.000 |
1 |
0.000 |
| detoxification involving cytochrome P450 |
FunCat |
10 |
0.000 |
1 |
0.001 |
| Ascorbate and aldarate metabolism |
KEGG |
10 |
0.000 |
1 |
0.014 |
|
|
|
|
|
|
|
|
|
|
|
| Fluorene degradation |
KEGG |
10 |
0.000 |
1 |
0.005 |
|
|
|
|
|
|
|
|
|
|
|
| gamma-Hexachlorocyclohexane degradation |
KEGG |
10 |
0.000 |
1 |
0.007 |
|
|
|
|
|
|
|
|
|
|
|
| Miscellaneous acyl lipid metabolism |
AcylLipid |
10 |
0.005 |
5 |
0.002 |
|
|
|
|
|
|
|
|
|
|
|
| fatty acid modulation |
LitPath |
10 |
0.000 |
1 |
0.000 |
|
|
|
|
|
|
|
|
|
|
|
|
|
|
|
|
|
|
|
|
|
|
|
|
|
|
|
|
|
|
|
|
|
|
|
|
|
|
|
|
|
|
|
|
|
|
|
|
|
|
|
|
|
|
|
|
|
|
|
|
|
|
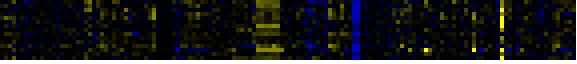
| Pathways co-expressed in the Mutant data set (with more than 9 annotation points) |
|
CYP72A7 (At3g14610) |
|
|
|
|
|
|
|
|
| max. difference between log2-ratios: |
3.6 |
|
|
|
|
|
|
|
|
|
|
|
|
| max. difference between log2-ratios excluding lowest and highest 5%: |
1.8 |
|
|
|
|
|
|
|
|
|
|
|
|
| Pathway |
Source |
Scores of Genes |
p[Score] |
No. of Genes |
p[genes] |
Link to mutants heatmap |
|
|
|
|
|
|
|
| Valine, leucine and isoleucine degradation |
KEGG |
18 |
0.000 |
3 |
0.001 |
|
|
|
|
| Phenylalanine metabolism |
KEGG |
16 |
0.000 |
3 |
0.033 |
|
|
|
| Alkaloid biosynthesis I |
KEGG |
14 |
0.000 |
2 |
0.003 |
|
|
|
| Arginine and proline metabolism |
KEGG |
14 |
0.000 |
2 |
0.021 |
|
|
|
| Tyrosine metabolism |
KEGG |
14 |
0.000 |
2 |
0.018 |
|
|
|
| metabolism of acyl-lipids in mitochondria |
AcylLipid |
14 |
0.000 |
2 |
0.000 |
|
|
|
|
|
|
|
|
|
|
|
| aspartate degradation I |
AraCyc |
12 |
0.000 |
2 |
0.002 |
|
|
|
|
|
|
|
|
|
|
|
| aspartate degradation II |
AraCyc |
12 |
0.000 |
2 |
0.000 |
|
|
|
|
|
|
|
|
|
|
|
| Gluconeogenesis from lipids in seeds |
BioPath |
10 |
0.000 |
1 |
0.002 |
|
|
|
|
|
|
|
|
|
|
|
| leaf senescence |
TAIR-GO |
10 |
0.000 |
1 |
0.000 |
|
|
|
|
|
|
|
|
|
|
|
| leucine catabolism |
TAIR-GO |
10 |
0.000 |
1 |
0.000 |
|
|
|
|
|
|
|
|
|
|
|
| nitrogen compound metabolism |
TAIR-GO |
10 |
0.000 |
1 |
0.000 |
|
|
|
|
|
|
|
|
|
|
|
| phenylpropanoid metabolism |
TAIR-GO |
10 |
0.000 |
1 |
0.000 |
|
|
|
|
|
|
|
|
|
|
|
| asparagine biosynthesis I |
AraCyc |
10 |
0.000 |
1 |
0.002 |
|
|
|
|
|
|
|
|
|
|
|
| asparagine degradation I |
AraCyc |
10 |
0.000 |
1 |
0.009 |
|
|
|
|
|
|
|
|
|
|
|
| aspartate biosynthesis and degradation |
AraCyc |
10 |
0.000 |
1 |
0.001 |
|
|
|
|
|
|
|
|
|
|
|
| glutamine degradation III |
AraCyc |
10 |
0.000 |
1 |
0.004 |
|
|
|
|
|
|
|
|
|
|
|
| leucine degradation I |
AraCyc |
10 |
0.000 |
1 |
0.021 |
|
|
|
|
|
|
|
|
|
|
|
| leucine degradation II |
AraCyc |
10 |
0.000 |
1 |
0.005 |
|
|
|
|
|
|
|
|
|
|
|
| amino acid metabolism |
FunCat |
10 |
0.000 |
1 |
0.027 |
|
|
|
|
|
|
|
|
|
|
|
| biogenesis of chloroplast |
FunCat |
10 |
0.000 |
1 |
0.010 |
|
|
|
|
|
|
|
|
|
|
|
| biosynthesis of phenylpropanoids |
FunCat |
10 |
0.000 |
1 |
0.003 |
|
|
|
|
|
|
|
|
|
|
|
| biosynthesis of secondary products derived from L-phenylalanine and L-tyrosine |
FunCat |
10 |
0.000 |
1 |
0.003 |
|
|
|
|
|
|
|
|
|
|
|
| lipid, fatty acid and isoprenoid degradation |
FunCat |
10 |
0.000 |
1 |
0.002 |
|
|
|
|
|
|
|
|
|
|
|
| metabolism of the aspartate family |
FunCat |
10 |
0.000 |
1 |
0.000 |
|
|
|
|
|
|
|
|
|
|
|
| nitrogen and sulfur biogenesis of chloroplast |
FunCat |
10 |
0.000 |
1 |
0.000 |
|
|
|
|
|
|
|
|
|
|
|
| Alanine and aspartate metabolism |
KEGG |
10 |
0.000 |
1 |
0.070 |
|
|
|
|
|
|
|
|
|
|
|
| Carbon fixation |
KEGG |
10 |
0.010 |
1 |
0.234 |
|
|
|
|
|
|
|
|
|
|
|
| Cysteine metabolism |
KEGG |
10 |
0.000 |
1 |
0.055 |
|
|
|
|
|
|
|
|
|
|
|
| Glutamate metabolism |
KEGG |
10 |
0.002 |
1 |
0.123 |
|
|
|
|
|
|
|
|
|
|
|
| Novobiocin biosynthesis |
KEGG |
10 |
0.000 |
1 |
0.014 |
|
|
|
|
|
|
|
|
|
|
|
| Phenylalanine, tyrosine and tryptophan biosynthesis |
KEGG |
10 |
0.001 |
1 |
0.123 |
|
|
|
|
|
|
|
|
|
|
|
| Phenylpropanoid pathway |
LitPath |
10 |
0.000 |
1 |
0.000 |
|
|
|
|
|
|
|
|
|
|
|
|
|
|
|
|
|
|
|
|
|
|
|
|
|
|
|
|