|
|
|
|
|
|
|
|
|
|
|
|
|
|
|
|
|
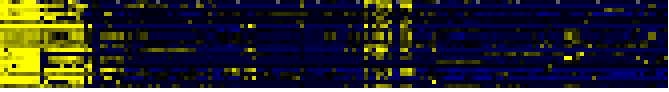
| Pathways co-expressed in the Organ and Tissue data set (with more than 6 annotation points) |
|
CYP735A2 (At1g67110) |
|
|
|
|
|
|
|
|
| max. difference between log2-ratios: |
4.8 |
|
|
|
|
|
|
|
|
|
|
|
|
| max. difference between log2-ratios excluding lowest and highest 5%: |
3.0 |
|
|
|
|
|
|
|
|
|
|
|
|
| Pathway |
Source |
Scores of Genes |
p[Score] |
No. of Genes |
p[genes] |
Link to organ heatmap |
|
|
|
|
|
|
|
| Cell Wall Carbohydrate Metabolism |
BioPath |
28 |
0.000 |
4 |
0.005 |
|
|
|
| C-compound and carbohydrate metabolism |
FunCat |
18 |
0.000 |
3 |
0.032 |
|
|
| Intermediary Carbon Metabolism |
BioPath |
12 |
0.000 |
2 |
0.018 |
|
|
| allantoin degradation |
AraCyc |
12 |
0.000 |
2 |
0.000 |
|
|
| isoleucine biosynthesis I |
AraCyc |
12 |
0.000 |
2 |
0.000 |
|
|
| leucine biosynthesis |
AraCyc |
12 |
0.000 |
2 |
0.000 |
|
|
| valine biosynthesis |
AraCyc |
12 |
0.000 |
2 |
0.000 |
|
|
|
|
|
|
|
|
|
|
|
| fermentation |
FunCat |
12 |
0.000 |
2 |
0.000 |
|
|
|
|
|
|
|
|
|
|
|
| Glycolysis / Gluconeogenesis |
KEGG |
12 |
0.000 |
2 |
0.008 |
|
|
|
|
|
|
|
|
|
|
|
| GDP-carbohydrate biosynthesis |
BioPath |
10 |
0.000 |
1 |
0.001 |
|
|
|
|
|
|
|
|
|
|
|
| de novo' GDP-L-fucose biosynthesis |
TAIR-GO |
10 |
0.000 |
1 |
0.000 |
|
|
|
|
|
|
|
|
|
|
|
| growth |
TAIR-GO |
10 |
0.000 |
1 |
0.004 |
|
|
|
|
|
|
|
|
|
|
|
| L-fucose biosynthesis |
TAIR-GO |
10 |
0.000 |
1 |
0.000 |
|
|
|
|
|
|
|
|
|
|
|
| unidimensional cell growth |
TAIR-GO |
10 |
0.000 |
1 |
0.001 |
|
|
|
|
|
|
|
|
|
|
|
| colanic acid building blocks biosynthesis |
AraCyc |
10 |
0.000 |
1 |
0.026 |
|
|
|
|
|
|
|
|
|
|
|
| GDP-D-rhamnose biosynthesis |
AraCyc |
10 |
0.000 |
1 |
0.001 |
|
|
|
|
|
|
|
|
|
|
|
| biogenesis of cell wall |
FunCat |
10 |
0.000 |
1 |
0.037 |
|
|
|
|
|
|
|
|
|
|
|
| C-compound and carbohydrate utilization |
FunCat |
10 |
0.000 |
1 |
0.000 |
|
|
|
|
|
|
|
|
|
|
|
| Fructose and mannose metabolism |
KEGG |
10 |
0.000 |
1 |
0.025 |
|
|
|
|
|
|
|
|
|
|
|
| ascorbic acid biosynthesis |
BioPath |
8 |
0.000 |
1 |
0.003 |
|
|
|
|
|
|
|
|
|
|
|
| ascorbate glutathione cycle |
AraCyc |
8 |
0.000 |
1 |
0.002 |
|
|
|
|
|
|
|
|
|
|
|
| Ascorbate and aldarate metabolism |
KEGG |
8 |
0.000 |
1 |
0.008 |
|
|
|
|
|
|
|
|
|
|
|
| response to osmotic stress |
TAIR-GO |
7 |
0.000 |
1 |
0.000 |
|
|
|
|
|
|
|
|
|
|
|
| fatty acid biosynthesis -- initial steps |
AraCyc |
7 |
0.000 |
1 |
0.009 |
|
|
|
|
|
|
|
|
|
|
|
|
|
|
|
|
|
|
|
|
|
|
|
|
|
|
|
|
|
|
|
|
|
|
|
|
|
|
|
|
|
|
|
|
|
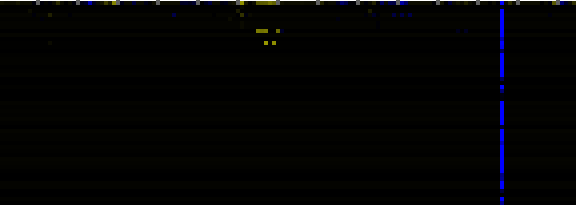
| Pathways co-expressed in the Stress data set ( with more than 6 annotation points) |
|
CYP735A2 (At1g67110) |
|
|
|
|
|
|
|
|
| max. difference between log2-ratios: |
5.9 |
|
|
|
|
|
|
|
|
|
|
|
|
| max. difference between log2-ratios excluding lowest and highest 5%: |
1.5 |
|
|
|
|
|
|
|
|
|
|
|
|
| Pathway |
Source |
Scores of Genes |
p[Score] |
No. of Genes |
p[genes] |
Link to stress heatmap |
|
|
|
|
|
|
|
| Cell Wall Carbohydrate Metabolism |
BioPath |
12 |
0.001 |
2 |
0.068 |

|
| Methane metabolism |
KEGG |
12 |
0.000 |
4 |
0.000 |
| Phenylalanine metabolism |
KEGG |
12 |
0.000 |
4 |
0.000 |
| Prostaglandin and leukotriene metabolism |
KEGG |
12 |
0.000 |
4 |
0.000 |
| Stilbene, coumarine and lignin biosynthesis |
KEGG |
12 |
0.000 |
4 |
0.000 |
| GDP-carbohydrate biosynthesis |
BioPath |
10 |
0.000 |
1 |
0.000 |
|
|
|
|
|
|
|
|
|
|
|
| Glucosyltransferases for benzoic acids |
BioPath |
10 |
0.000 |
1 |
0.001 |
|
|
|
|
|
|
|
|
|
|
|
| Phenylpropanoid Metabolism |
BioPath |
10 |
0.000 |
1 |
0.090 |
|
|
|
|
|
|
|
|
|
|
|
| colanic acid building blocks biosynthesis |
AraCyc |
10 |
0.000 |
1 |
0.014 |
|
|
|
|
|
|
|
|
|
|
|
| dTDP-rhamnose biosynthesis |
AraCyc |
10 |
0.000 |
1 |
0.008 |
|
|
|
|
|
|
|
|
|
|
|
| flavonol biosynthesis |
AraCyc |
10 |
0.000 |
1 |
0.002 |
|
|
|
|
|
|
|
|
|
|
|
| galactose degradation I |
AraCyc |
10 |
0.000 |
1 |
0.000 |
|
|
|
|
|
|
|
|
|
|
|
| glucose conversion |
AraCyc |
10 |
0.000 |
1 |
0.007 |
|
|
|
|
|
|
|
|
|
|
|
| lactose degradation IV |
AraCyc |
10 |
0.000 |
1 |
0.000 |
|
|
|
|
|
|
|
|
|
|
|
| UDP-glucose conversion |
AraCyc |
10 |
0.000 |
1 |
0.007 |
|
|
|
|
|
|
|
|
|
|
|
| Fructose and mannose metabolism |
KEGG |
10 |
0.000 |
1 |
0.019 |
|
|
|
|
|
|
|
|
|
|
|
|
|
|
|
|
|
|
|
|
|
|
|
|
|
|
|
|
|
|
|
|
|
|
|
|
|
|
|
|
|
|
|
|
|
|
|
|
|
|
|
|
|
|
|
|
|
|
|
|
|
|
| Pathways co-expressed in the Mutant data set (with more than 29 annotation points) |
|
CYP735A2 (At1g67110) |
|
|
|
|
|
|
|
|
| max. difference between log2-ratios: |
9.2 |
|
|
|
|
|
|
|
|
|
|
|
|
| max. difference between log2-ratios excluding lowest and highest 5%: |
1.9 |
|
|
|
|
|
|
|
|
|
|
|
|
| Pathway |
Source |
Scores of Genes |
p[Score] |
No. of Genes |
p[genes] |
Link to mutants heatmap |
|
|
|
|
|
|
|
| Cell Wall Carbohydrate Metabolism |
BioPath |
195.5 |
0.000 |
60 |
0.000 |
|
|
|
|
| C-compound and carbohydrate metabolism |
FunCat |
113 |
0.000 |
28 |
0.023 |
|
|
|
| pectin metabolism |
BioPath |
90.5 |
0.000 |
41 |
0.000 |
|
|
|
| Phenylpropanoid Metabolism |
BioPath |
88 |
0.013 |
15 |
0.611 |
|
|
|
| Ribosome |
KEGG |
88 |
0.030 |
17 |
0.518 |
|
|
|
| Isoprenoid Biosynthesis in the Cytosol and in Mitochondria |
BioPath |
66 |
0.000 |
11 |
0.016 |
|
|
|
| triterpene, sterol, and brassinosteroid metabolism |
LitPath |
56 |
0.021 |
11 |
0.141 |
|
|
|
| Biosynthesis of prenyl diphosphates |
BioPath |
52 |
0.000 |
9 |
0.008 |
|
|
|
| Nucleotide Metabolism |
KEGG |
51 |
0.000 |
10 |
0.016 |
|
|
|
| Purine metabolism |
KEGG |
47 |
0.000 |
9 |
0.008 |
|
|
|
| Lipid signaling |
AcylLipid |
43 |
0.014 |
9 |
0.330 |
|
|
|
| Aromatic amino acid (Phe, Tyr, Trp) metabolism |
BioPath |
42 |
0.000 |
5 |
0.445 |
|
|
|
| cellulose biosynthesis |
BioPath |
42 |
0.000 |
8 |
0.026 |
|
|
|
| Starch and sucrose metabolism |
KEGG |
39 |
0.000 |
10 |
0.015 |
|
|
|
|
|
|
|
|
|
|
|
| mono-/sesqui-/di-terpene biosynthesis |
LitPath |
38 |
0.000 |
8 |
0.012 |
|
|
|
|
|
|
|
|
|
|
|
| terpenoid metabolism |
LitPath |
38 |
0.000 |
8 |
0.015 |
|
|
|
|
|
|
|
|
|
|
|
| lactose degradation IV |
AraCyc |
37 |
0.000 |
8 |
0.000 |
|
|
|
|
|
|
|
|
|
|
|
| biogenesis of cell wall |
FunCat |
36 |
0.000 |
12 |
0.001 |
|
|
|
|
|
|
|
|
|
|
|
| nucleotide metabolism |
FunCat |
36 |
0.000 |
8 |
0.000 |
|
|
|
|
|
|
|
|
|
|
|
| Biosynthesis of steroids |
KEGG |
36 |
0.000 |
6 |
0.040 |
|
|
|
|
|
|
|
|
|
|
|
| Phenylalanine, tyrosine and tryptophan biosynthesis |
KEGG |
36 |
0.000 |
4 |
0.182 |
|
|
|
|
|
|
|
|
|
|
|
| transport |
FunCat |
34 |
0.000 |
10 |
0.000 |
|
|
|
|
|
|
|
|
|
|
|
| aromatic amino acid family biosynthesis |
TAIR-GO |
30 |
0.000 |
3 |
0.002 |
|
|
|
|
|
|
|
|
|
|
|
| trans-zeatin biosynthesis |
AraCyc |
30 |
0.000 |
6 |
0.000 |
|
|
|
|
|
|
|
|
|
|
|
| transport facilitation |
FunCat |
30 |
0.000 |
9 |
0.000 |
|
|
|
|
|
|
|
|
|
|
|
| Translation factors |
KEGG |
30 |
0.001 |
9 |
0.078 |
|
|
|
|
|
|
|
|
|
|
|
|
|
|
|
|
|
|
|
|
|
|
|
|
|
|
|
|