| _________________________________________ |
|
|
|
|
|
|
|
|
|
|
|
|
|
|
|
|
| Pathways co-expressed in all 4 data sets (with more than 6 annotation points each) |
|
Find below a list of pathways that are co-expressed with the bait. First a list of pathways is given that are co-expressed in all data sets. Lists for each individual dataset are shown underneath. Depending on the number of co-expressed pathways only the top scoring pathways are given; all data can be saved as text using the link above. |

|
|
|
|
|
|
|
|
| Pathway |
Source |
Sum of scores |
Sum of genes |
|
|
|
|
|
|
|
|
| jasmonic acid biosynthesis |
TAIR-GO |
257 |
35 |
|
|
|
|
|
|
|
|
| jasmonic acid biosynthesis |
AraCyc |
257 |
35 |
|
|
|
|
|
|
|
|
| tryptophan biosynthesis |
TAIR-GO |
238 |
41 |
|
|
|
|
|
|
|
|
| Glucosinolate Metabolism |
LitPath |
200 |
20 |
|
To the right of each table a thumbnail of the actual co-expression heatmap is given. Klick on the link to see the heatmap containing all co-expressed genes. |
|
|
|
|
|
|
|
|
|
| Lipid signaling |
AcylLipid |
185 |
27 |
|
|
|
|
|
|
|
|
|
|
| response to wounding |
TAIR-GO |
170 |
21 |
|
|
|
|
|
|
|
|
|
|
| Glutathione metabolism |
BioPath |
153 |
18 |
|
For more information on how these pathway maps were generated please read the methods page |
|
|
|
|
|
|
|
|
|
| lipoxygenase pathway |
AraCyc |
137 |
19 |
|
|
|
|
|
|
|
|
|
|
| sulfate assimilation III |
AraCyc |
117 |
13 |
|
|
|
|
|
|
|
|
|
|
|
|
|
| Selenoamino acid metabolism |
KEGG |
114 |
12 |
|
|
|
|
|
|
|
|
|
|
|
|
|
| Sulfur metabolism |
KEGG |
114 |
12 |
|
|
|
|
|
|
|
|
|
|
|
|
|
| Purine metabolism |
KEGG |
96 |
12 |
|
|
|
|
|
|
|
|
|
|
|
|
|
| response to jasmonic acid stimulus |
TAIR-GO |
94 |
11 |
|
|
|
|
|
|
|
|
|
|
|
|
|
| lipid, fatty acid and isoprenoid metabolism |
FunCat |
85 |
11 |
|
|
|
|
|
|
|
|
|
|
|
|
|
| IAA biosynthesis |
AraCyc |
78 |
8 |
|
|
|
|
|
|
|
|
|
|
|
|
|
| IAA biosynthesis I |
AraCyc |
78 |
8 |
|
|
|
|
|
|
|
|
|
|
|
|
|
| chlorophyll catabolism |
TAIR-GO |
70 |
7 |
|
|
|
|
|
|
|
|
|
|
|
|
|
| chlorophyll catabolism |
LitPath |
70 |
7 |
|
|
|
|
|
|
|
|
|
|
|
|
|
| oxylipin pathway |
LitPath |
60 |
6 |
|
|
|
|
|
|
|
|
|
|
|
|
|
| chloroplast envelope |
TAIR-GO |
40 |
4 |
|
|
|
|
|
|
|
|
|
|
|
|
|
| galactolipid biosynthesis |
TAIR-GO |
40 |
4 |
|
|
|
|
|
|
|
|
|
|
|
|
|
| glycolipid biosynthesis |
TAIR-GO |
40 |
4 |
|
|
|
|
|
|
|
|
|
|
|
|
|
| lipid biosynthesis |
TAIR-GO |
40 |
4 |
|
|
|
|
|
|
|
|
|
|
|
|
|
| response to stress |
TAIR-GO |
40 |
4 |
|
|
|
|
|
|
|
|
|
|
|
|
|
| glycosylglyceride biosynthesis |
AraCyc |
40 |
4 |
|
|
|
|
|
|
|
|
|
|
|
|
|
|
|
|
|
|
|
|
|
|
|
|
|
|
|
|
|
|
|
|
|
|
|
|
|
|
|
|
|
|
|
|
|
|
|
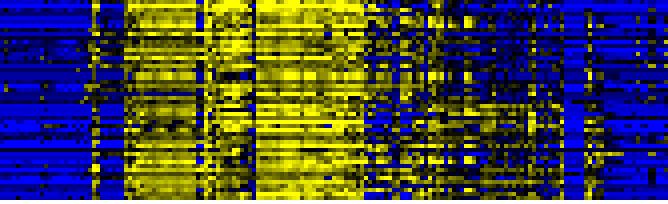
| Pathways co-expressed in the Organ and Tissue data set (with more than 30 annotation points) |
|
CYP74A, AOS (At5g42650) |
|
|
|
|
|
|
|
|
| max. difference between log2-ratios: |
7.2 |
|
|
|
|
|
|
|
|
|
|
|
|
| max. difference between log2-ratios excluding lowest and highest 5%: |
5.7 |
|
|
|
|
|
|
|
|
|
|
|
|
| Pathway |
Source |
Scores of Genes |
p[Score] |
No. of Genes |
p[genes] |
Link to organ heatmap |
|
|
|
|
|
|
|
| Biosynthesis of Amino Acids and Derivatives |
BioPath |
132 |
0.000 |
17 |
0.028 |
|
|
|
| Photosystems |
BioPath |
131 |
0.000 |
22 |
0.000 |
|
|
| Glucosinolate Metabolism |
LitPath |
130 |
0.000 |
13 |
0.000 |
|
|
| Glutathione metabolism |
BioPath |
84 |
0.000 |
11 |
0.002 |
|
|
| Photosystem I |
BioPath |
73 |
0.000 |
13 |
0.000 |
|
|
| sulfate assimilation III |
AraCyc |
69 |
0.000 |
8 |
0.000 |
|
|
| amino acid metabolism |
FunCat |
61 |
0.000 |
8 |
0.007 |
|
|
| glucosinolate biosynthesis |
TAIR-GO |
60 |
0.000 |
6 |
0.000 |
|
|
| Photosynthesis |
KEGG |
57 |
0.000 |
11 |
0.000 |
|
|
| biogenesis of chloroplast |
FunCat |
56 |
0.000 |
10 |
0.000 |
|
|
| Selenoamino acid metabolism |
KEGG |
54 |
0.000 |
6 |
0.000 |
|
|
| Sulfur metabolism |
KEGG |
54 |
0.000 |
6 |
0.000 |
|
|
| photosynthesis |
FunCat |
47 |
0.000 |
8 |
0.000 |
|
|
| Lipid signaling |
AcylLipid |
47 |
0.000 |
8 |
0.038 |
|
|
|
|
|
|
|
|
|
|
|
| cysteine biosynthesis I |
AraCyc |
44 |
0.000 |
8 |
0.000 |
|
|
|
|
|
|
|
|
|
|
|
| glycolysis and gluconeogenesis |
FunCat |
42 |
0.000 |
7 |
0.042 |
|
|
|
|
|
|
|
|
|
|
|
| Carbon fixation |
KEGG |
41 |
0.000 |
6 |
0.008 |
|
|
|
|
|
|
|
|
|
|
|
| glucosinolate biosynthesis from homomethionine |
AraCyc |
40 |
0.000 |
4 |
0.000 |
|
|
|
|
|
|
|
|
|
|
|
| additional photosystem II components |
BioPath |
36 |
0.000 |
6 |
0.014 |
|
|
|
|
|
|
|
|
|
|
|
| response to wounding |
TAIR-GO |
36 |
0.000 |
4 |
0.007 |
|
|
|
|
|
|
|
|
|
|
|
| jasmonic acid biosynthesis |
TAIR-GO |
33 |
0.000 |
4 |
0.004 |
|
|
|
|
|
|
|
|
|
|
|
| jasmonic acid biosynthesis |
AraCyc |
33 |
0.000 |
4 |
0.003 |
|
|
|
|
|
|
|
|
|
|
|
| Ascorbate and aldarate metabolism |
KEGG |
33 |
0.000 |
4 |
0.002 |
|
|
|
|
|
|
|
|
|
|
|
| Flavonoid and anthocyanin metabolism |
BioPath |
32 |
0.000 |
5 |
0.163 |
|
|
|
|
|
|
|
|
|
|
|
| photosystem I reaction center |
BioPath |
32 |
0.000 |
7 |
0.000 |
|
|
|
|
|
|
|
|
|
|
|
| Purine metabolism |
KEGG |
32 |
0.000 |
4 |
0.065 |
|
|
|
|
|
|
|
|
|
|
|
| photosystem I |
TAIR-GO |
31 |
0.000 |
4 |
0.000 |
|
|
|
|
|
|
|
|
|
|
|
| Stilbene, coumarine and lignin biosynthesis |
KEGG |
31 |
0.000 |
4 |
0.288 |
|
|
|
|
|
|
|
|
|
|
|
|
|
|
|
|
|
|
|
|
|
|
|
|
|
|
|
|
|
|
|
|
|
|
|
|
|
|
|
|
|
|
|
|
|
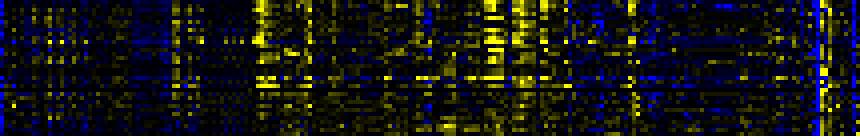
| Pathways co-expressed in the Stress data set ( with more than 10 annotation points) |
|
CYP74A, AOS (At5g42650) |
|
|
|
|
|
|
|
|
| max. difference between log2-ratios: |
11.3 |
|
|
|
|
|
|
|
|
|
|
|
|
| max. difference between log2-ratios excluding lowest and highest 5%: |
2.7 |
|
|
|
|
|
|
|
|
|
|
|
|
| Pathway |
Source |
Scores of Genes |
p[Score] |
No. of Genes |
p[genes] |
Link to stress heatmap |
|
|
|
|
|
|
|
| Lipid signaling |
AcylLipid |
49 |
0.000 |
6 |
0.000 |
|
| jasmonic acid biosynthesis |
TAIR-GO |
39 |
0.000 |
5 |
0.000 |
| jasmonic acid biosynthesis |
AraCyc |
39 |
0.000 |
5 |
0.000 |
| lipoxygenase pathway |
AraCyc |
39 |
0.000 |
5 |
0.000 |
| response to wounding |
TAIR-GO |
33 |
0.000 |
4 |
0.000 |
| Biosynthesis of Amino Acids and Derivatives |
BioPath |
28 |
0.000 |
4 |
0.036 |
| lipid, fatty acid and isoprenoid metabolism |
FunCat |
27 |
0.000 |
3 |
0.000 |
| Photosystem I |
BioPath |
24 |
0.000 |
4 |
0.000 |
| Photosystems |
BioPath |
24 |
0.000 |
4 |
0.006 |
| Purine metabolism |
KEGG |
22 |
0.000 |
3 |
0.001 |
|
|
|
|
|
|
|
|
|
|
|
| Glutathione metabolism |
BioPath |
20 |
0.000 |
2 |
0.041 |
|
|
|
|
|
|
|
|
|
|
|
| Photosystem II |
BioPath |
20 |
0.000 |
3 |
0.001 |
|
|
|
|
|
|
|
|
|
|
|
| Selenoamino acid metabolism |
KEGG |
20 |
0.000 |
2 |
0.001 |
|
|
|
|
|
|
|
|
|
|
|
| Sulfur metabolism |
KEGG |
20 |
0.000 |
2 |
0.000 |
|
|
|
|
|
|
|
|
|
|
|
| oxylipin pathway |
LitPath |
20 |
0.000 |
2 |
0.000 |
|
|
|
|
|
|
|
|
|
|
|
| indoleacetic acid biosynthesis |
TAIR-GO |
18 |
0.000 |
2 |
0.000 |
|
|
|
|
|
|
|
|
|
|
|
| IAA biosynthesis |
AraCyc |
18 |
0.000 |
2 |
0.001 |
|
|
|
|
|
|
|
|
|
|
|
| IAA biosynthesis I |
AraCyc |
18 |
0.000 |
2 |
0.000 |
|
|
|
|
|
|
|
|
|
|
|
| plant / fungal specific systemic sensing and response |
FunCat |
18 |
0.000 |
2 |
0.000 |
|
|
|
|
|
|
|
|
|
|
|
| plant hormonal regulation |
FunCat |
18 |
0.000 |
2 |
0.000 |
|
|
|
|
|
|
|
|
|
|
|
| response to jasmonic acid stimulus |
TAIR-GO |
17 |
0.000 |
2 |
0.000 |
|
|
|
|
|
|
|
|
|
|
|
| Nitrogen metabolism |
KEGG |
15 |
0.000 |
2 |
0.001 |
|
|
|
|
|
|
|
|
|
|
|
| Photosystem II reaction center |
BioPath |
12 |
0.000 |
2 |
0.000 |
|
|
|
|
|
|
|
|
|
|
|
| Photosynthesis |
KEGG |
12 |
0.000 |
2 |
0.001 |
|
|
|
|
|
|
|
|
|
|
|
|
|
|
|
|
|
|
|
|
|
|
|
|
|
|
|
|
|
|
|
|
|
|
|
|
|
|
|
|
|
|
|
|
|
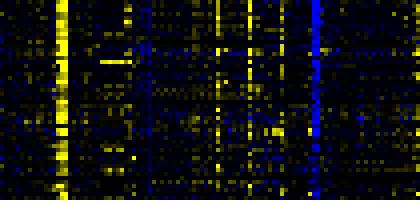
| Pathways co-expressed in the Hormone etc. data set (with more than 20 annotation points) |
|
CYP74A, AOS (At5g42650) |
|
|
|
|
|
|
|
|
| max. difference between log2-ratios: |
8.6 |
|
|
|
|
|
|
|
|
|
|
|
|
| max. difference between log2-ratios excluding lowest and highest 5%: |
1.8 |
|
|
|
|
|
|
|
|
|
|
|
|
| Pathway |
Source |
Scores of Genes |
p[Score] |
No. of Genes |
p[genes] |
Link to hormones etc. heatmap |
|
|
|
|
|
|
|
| Phenylpropanoid Metabolism |
BioPath |
102 |
0.000 |
16 |
0.000 |
|
|
|
|
|
|
| Aromatic amino acid (Phe, Tyr, Trp) metabolism |
BioPath |
86 |
0.000 |
12 |
0.000 |
|
|
|
|
|
| Shikimate pathway |
LitPath |
86 |
0.000 |
12 |
0.000 |
|
|
|
|
|
| tryptophan biosynthesis |
AraCyc |
72 |
0.000 |
11 |
0.000 |
|
|
|
|
|
| tryptophan biosynthesis |
TAIR-GO |
68 |
0.000 |
9 |
0.000 |
|
|
|
|
|
| Trp biosyntesis |
LitPath |
68 |
0.000 |
9 |
0.000 |
|
|
|
|
|
| Lipid signaling |
AcylLipid |
63 |
0.000 |
9 |
0.000 |
|
|
|
|
|
| response to wounding |
TAIR-GO |
62 |
0.000 |
8 |
0.000 |
|
|
|
|
|
| Phenylalanine, tyrosine and tryptophan biosynthesis |
KEGG |
58 |
0.000 |
7 |
0.000 |
|
|
|
|
|
| jasmonic acid biosynthesis |
TAIR-GO |
49 |
0.000 |
7 |
0.000 |
|
|
|
|
|
| jasmonic acid biosynthesis |
AraCyc |
49 |
0.000 |
7 |
0.000 |
|
|
|
|
|
| lipoxygenase pathway |
AraCyc |
49 |
0.000 |
7 |
0.000 |
|
|
|
|
|
| Biosynthesis of Amino Acids and Derivatives |
BioPath |
48 |
0.000 |
6 |
0.109 |
|
|
|
|
|
| response to pathogenic bacteria |
TAIR-GO |
48 |
0.000 |
7 |
0.000 |
|
|
|
|
|
|
|
|
|
|
|
| Glutathione metabolism |
BioPath |
40 |
0.000 |
4 |
0.025 |
|
|
|
|
|
|
|
|
|
|
|
| response to jasmonic acid stimulus |
TAIR-GO |
32 |
0.000 |
4 |
0.000 |
|
|
|
|
|
|
|
|
|
|
|
| Purine metabolism |
KEGG |
32 |
0.000 |
4 |
0.001 |
|
|
|
|
|
|
|
|
|
|
|
| Selenoamino acid metabolism |
KEGG |
30 |
0.000 |
3 |
0.001 |
|
|
|
|
|
|
|
|
|
|
|
| Sulfur metabolism |
KEGG |
30 |
0.000 |
3 |
0.000 |
|
|
|
|
|
|
|
|
|
|
|
| sulfate assimilation III |
AraCyc |
29 |
0.000 |
3 |
0.007 |
|
|
|
|
|
|
|
|
|
|
|
| lipid, fatty acid and isoprenoid metabolism |
FunCat |
29 |
0.000 |
4 |
0.000 |
|
|
|
|
|
|
|
|
|
|
|
| alanine biosynthesis II |
AraCyc |
24 |
0.000 |
4 |
0.000 |
|
|
|
|
|
|
|
|
|
|
|
| phenylalanine biosynthesis II |
AraCyc |
24 |
0.000 |
4 |
0.000 |
|
|
|
|
|
|
|
|
|
|
|
| amino acid metabolism |
FunCat |
21 |
0.000 |
4 |
0.005 |
|
|
|
|
|
|
|
|
|
|
|
|
|
|
|
|
|
|
|
|
|
|
|
|
|
|
|
|
|
|
|
|
|
|
|
|
|
|
|
|
|
|
|
|
|
|
|
|
|
|
|
|
|
|
|
|
|
|
|
|
|
|
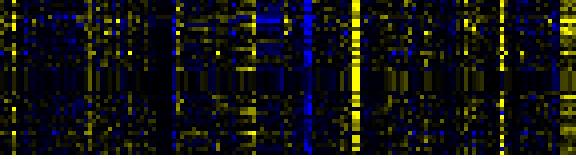
| Pathways co-expressed in the Mutant data set (with more than 10 annotation points) |
|
CYP74A, AOS (At5g42650) |
|
|
|
|
|
|
|
|
| max. difference between log2-ratios: |
8.0 |
|
|
|
|
|
|
|
|
|
|
|
|
| max. difference between log2-ratios excluding lowest and highest 5%: |
2.4 |
|
|
|
|
|
|
|
|
|
|
|
|
| Pathway |
Source |
Scores of Genes |
p[Score] |
No. of Genes |
p[genes] |
Link to mutants heatmap |
|
|
|
|
|
|
|
| Phenylpropanoid Metabolism |
BioPath |
78 |
0.000 |
10 |
0.000 |
|
|
|
|
| tryptophan biosynthesis |
AraCyc |
70 |
0.000 |
10 |
0.000 |
|
|
|
| Aromatic amino acid (Phe, Tyr, Trp) metabolism |
BioPath |
68 |
0.000 |
9 |
0.000 |
|
|
|
| tryptophan biosynthesis |
TAIR-GO |
68 |
0.000 |
9 |
0.000 |
|
|
|
| Shikimate pathway |
LitPath |
68 |
0.000 |
9 |
0.000 |
|
|
|
| Trp biosyntesis |
LitPath |
68 |
0.000 |
9 |
0.000 |
|
|
|
| response to pathogenic bacteria |
TAIR-GO |
48 |
0.000 |
7 |
0.000 |
|
|
|
| Phenylalanine, tyrosine and tryptophan biosynthesis |
KEGG |
42 |
0.000 |
5 |
0.000 |
|
|
|
| Glucosinolate Metabolism |
LitPath |
40 |
0.000 |
4 |
0.000 |
|
|
|
| response to wounding |
TAIR-GO |
39 |
0.000 |
5 |
0.000 |
|
|
|
| jasmonic acid biosynthesis |
AraCyc |
26 |
0.000 |
4 |
0.000 |
|
|
|
|
|
|
|
|
|
|
|
| lipoxygenase pathway |
AraCyc |
26 |
0.000 |
4 |
0.000 |
|
|
|
|
|
|
|
|
|
|
|
| Lipid signaling |
AcylLipid |
26 |
0.000 |
4 |
0.026 |
|
|
|
|
|
|
|
|
|
|
|
| jasmonic acid biosynthesis |
TAIR-GO |
22 |
0.000 |
3 |
0.001 |
|
|
|
|
|
|
|
|
|
|
|
| tryptophan catabolism |
TAIR-GO |
20 |
0.000 |
2 |
0.000 |
|
|
|
|
|
|
|
|
|
|
|
| glucosinolate biosynthesis from tryptophan |
AraCyc |
20 |
0.000 |
2 |
0.000 |
|
|
|
|
|
|
|
|
|
|
|
| IAA biosynthesis |
AraCyc |
20 |
0.000 |
2 |
0.000 |
|
|
|
|
|
|
|
|
|
|
|
| IAA biosynthesis I |
AraCyc |
20 |
0.000 |
2 |
0.000 |
|
|
|
|
|
|
|
|
|
|
|
| response to jasmonic acid stimulus |
TAIR-GO |
19 |
0.000 |
2 |
0.000 |
|
|
|
|
|
|
|
|
|
|
|
| nucleotide metabolism |
FunCat |
16 |
0.000 |
2 |
0.000 |
|
|
|
|
|
|
|
|
|
|
|
| amino acid metabolism |
FunCat |
15 |
0.000 |
2 |
0.010 |
|
|
|
|
|
|
|
|
|
|
|
| Benzoate degradation via CoA ligation |
KEGG |
11 |
0.000 |
2 |
0.010 |
|
|
|
|
|
|
|
|
|
|
|
| Inositol phosphate metabolism |
KEGG |
11 |
0.000 |
2 |
0.013 |
|
|
|
|
|
|
|
|
|
|
|
| Nicotinate and nicotinamide metabolism |
KEGG |
11 |
0.000 |
2 |
0.008 |
|
|
|
|
|
|
|
|
|
|
|
|
|
|
|
|
|
|
|
|
|
|
|
|
|
|
|
|