
| Co-Expression Analysis of: | CYPedia Home | Institut de Biologie Moléculaire des Plantes (Home) | |||||||||||||
| CYP76C5 and/or CYP76C6 (At1g33730; At1g33720) | save all data as Tab Delimited Table | ||||||||||||||
| (both genes recognized by probeset used) | |||||||||||||||
| _________________________________________ | |||||||||||||||
| Pathways co-expressed in all 4 data sets (with more than 6 annotation points each) | Find below a list of pathways that are co-expressed with the bait. First a list of pathways is given that are co-expressed in all data sets. Lists for each individual dataset are shown underneath. Depending on the number of co-expressed pathways only the top scoring pathways are given; all data can be saved as text using the link above. |
|
|||||||||||||
| there are co-expressed pathways only in the organ data set | |||||||||||||||
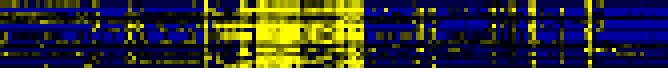
| To the right of each table a thumbnail of the actual co-expression heatmap is given. Klick on the link to see the heatmap containing all co-expressed genes. | |||||||||||||||
| For more information on how these pathway maps were generated please read the methods page | |||||||||||||||
| Pathways co-expressed in the Organ and Tissue data set (with more than 6 annotation points) | CYP76C5 and/or CYP76C6 (At1g33730; At1g33720) | ||||||||||||||
| max. difference between log2-ratios: | 4.8 | ||||||||||||||
| max. difference between log2-ratios excluding lowest and highest 5%: | 3.0 | ||||||||||||||
| Pathway | Source | Scores of Genes | p[Score] | No. of Genes | p[genes] | Link to organ heatmap | |||||||||
| systemic acquired resistance | TAIR-GO | 14 | 0.000 | 2 | 0.000 |
|
|||||||||
| Aromatic amino acid (Phe, Tyr, Trp) metabolism | BioPath | 10 | 0.000 | 1 | 0.008 | ||||||||||
| Phenylpropanoid Metabolism | BioPath | 10 | 0.001 | 1 | 0.071 | ||||||||||
| Phylloquinone biosynthesis | BioPath | 10 | 0.000 | 1 | 0.000 | ||||||||||
| Plastidial Isoprenoids (Chlorophylls, Carotenoids, Tocopherols, Plastoquinone, Phylloquinone) | BioPath | 10 | 0.000 | 1 | 0.018 | ||||||||||
| salycilic acid biosynthesis | BioPath | 10 | 0.000 | 1 | 0.000 | ||||||||||
| salicylic acid biosynthesis | TAIR-GO | 10 | 0.000 | 1 | 0.000 | ||||||||||
| menaquinone biosynthesis | AraCyc | 10 | 0.000 | 1 | 0.000 | ||||||||||
| salicylic acid biosynthesis | AraCyc | 10 | 0.000 | 1 | 0.000 | ||||||||||
| defense related proteins | FunCat | 10 | 0.000 | 2 | 0.000 | ||||||||||
| disease, virulence and defense | FunCat | 10 | 0.000 | 2 | 0.000 | ||||||||||
| Biosynthesis of Polyketides and Nonribosomal Peptides | KEGG | 10 | 0.000 | 1 | 0.000 | ||||||||||
| Ion channels | KEGG | 10 | 0.000 | 5 | 0.000 | ||||||||||
| Ligand-Receptor Interaction | KEGG | 10 | 0.000 | 5 | 0.000 | ||||||||||
| Ubiquinone biosynthesis | KEGG | 10 | 0.000 | 1 | 0.001 | ||||||||||
| phylloquinone biosynthesis | LitPath | 10 | 0.000 | 1 | 0.003 | ||||||||||
| phylloquinone biosynthesis, salicylic acid biosynthesis | LitPath | 10 | 0.000 | 1 | 0.000 | ||||||||||
| plastochinone and phylloquinone biosynthesis | LitPath | 10 | 0.000 | 1 | 0.001 | ||||||||||
| Pathways co-expressed in the Stress data set ( with more than 10 annotation points) | CYP76C5 and/or CYP76C6 (At1g33730; At1g33720) | ||||||||||||||
| max. difference between log2-ratios: | 4.1 | ||||||||||||||
| max. difference between log2-ratios excluding lowest and highest 5%: | 2.0 | ||||||||||||||
| Link to stress heatmap | |||||||||||||||
| there are no co-expressed pathways with r-value greater than 0.5 in this data set | |||||||||||||||
| Pathways co-expressed in the Hormone etc. data set (with more than 10 annotation points) | CYP76C5 and/or CYP76C6 (At1g33730; At1g33720) | ||||||||||||||
| max. difference between log2-ratios: | 3.1 | ||||||||||||||
| max. difference between log2-ratios excluding lowest and highest 5%: | 1.9 | ||||||||||||||
| Link to hormones etc. heatmap | |||||||||||||||
| there are no co-expressed pathways with more than six annotation points in this data set | |||||||||||||||
| Pathways co-expressed in the Mutant data set (with more than 10 annotation points) | CYP76C5 and/or CYP76C6 (At1g33730; At1g33720) | ||||||||||||||
| max. difference between log2-ratios: | 5.3 | ||||||||||||||
| max. difference between log2-ratios excluding lowest and highest 5%: | 3.0 | ||||||||||||||
| Link to mutants heatmap | |||||||||||||||
| there are no co-expressed pathways with more than six annotation points in this data set | |||||||||||||||
| page created by Juergen Ehlting | 03/07/06 | ||||||||||||||