|
|
|
|
|
|
|
|
|
|
|
|
|
|
|
|
|
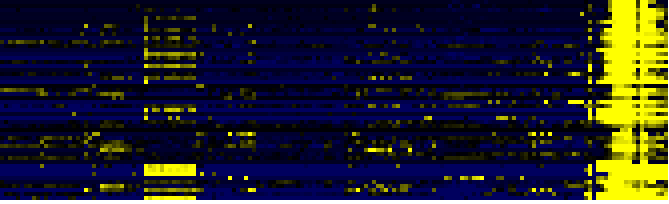
| Pathways co-expressed in the Organ and Tissue data set (with more than 10 annotation points) |
|
CYP76C7 (At3g61040) |
|
|
|
|
|
|
|
|
| max. difference between log2-ratios: |
7,8 |
|
|
|
|
|
|
|
|
|
|
|
|
| max. difference between log2-ratios excluding lowest and highest 5%: |
2,4 |
|
|
|
|
|
|
|
|
|
|
|
|
| Pathway |
Source |
Scores of Genes |
p[Score] |
No. of Genes |
p[genes] |
Link to organ heatmap |
|
|
|
|
|
|
|
| Synthesis and storage of oil |
AcylLipid |
38 |
0,000 |
10 |
0,000 |
|
|
|
| Miscellaneous acyl lipid metabolism |
AcylLipid |
29 |
0,002 |
7 |
0,446 |
|
|
| glycolysis and gluconeogenesis |
FunCat |
28 |
0,000 |
6 |
0,008 |
|
|
| Biosynthesis of Amino Acids and Derivatives |
BioPath |
26 |
0,000 |
4 |
0,032 |
|
|
| C-compound and carbohydrate metabolism |
FunCat |
26 |
0,025 |
9 |
0,033 |
|
|
| amino acid metabolism |
FunCat |
20 |
0,001 |
2 |
0,337 |
|
|
| Phenylpropanoid pathway |
LitPath |
20 |
0,000 |
5 |
0,001 |
|
|
| acyl-CoA binding |
TAIR-GO |
19 |
0,000 |
2 |
0,000 |
|
|
| lipid transport |
TAIR-GO |
19 |
0,000 |
2 |
0,000 |
|
|
| Pyruvate metabolism |
KEGG |
18 |
0,000 |
3 |
0,011 |
|
|
| Intermediary Carbon Metabolism |
BioPath |
16 |
0,000 |
3 |
0,089 |
|
|
| Phenylpropanoid Metabolism |
BioPath |
15 |
0,007 |
3 |
0,114 |
|
|
| core phenylpropanoid metabolism |
BioPath |
14 |
0,000 |
2 |
0,012 |
|
|
| lignin biosynthesis |
AraCyc |
12 |
0,000 |
2 |
0,035 |
|
|
|
|
|
|
|
|
|
|
|
| TCA cycle variation VII |
AraCyc |
12 |
0,001 |
2 |
0,108 |
|
|
|
|
|
|
|
|
|
|
|
|
|
|
|
|
|
|
|
|
|
|
|
|
|
|
|
|
|
|
|
|
|
|
|
|
|
|
|
|
|
|
|
|
|
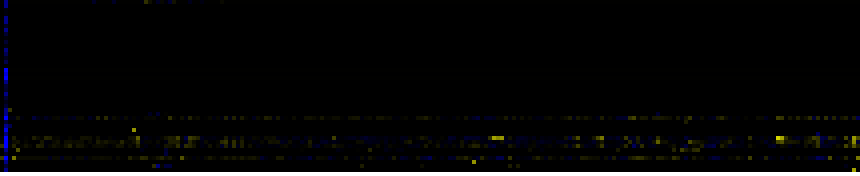
| Pathways co-expressed in the Stress data set ( with more than 10 annotation points) |
|
CYP76C7 (At3g61040) |
|
|
|
|
|
|
|
|
| max. difference between log2-ratios: |
2,1 |
|
|
|
|
|
|
|
|
|
|
|
|
| max. difference between log2-ratios excluding lowest and highest 5%: |
0,0 |
|
|
|
|
|
|
|
|
|
|
|
|
| Pathway |
Source |
Scores of Genes |
p[Score] |
No. of Genes |
p[genes] |
Link to stress heatmap |
|
|
|
|
|
|
|
| Cell Wall Carbohydrate Metabolism |
BioPath |
30 |
0,000 |
9 |
0,003 |
|
| C-compound and carbohydrate metabolism |
FunCat |
24 |
0,001 |
6 |
0,032 |
| nucleotide metabolism |
FunCat |
16 |
0,000 |
4 |
0,000 |
| UDP-carbohydrate metabolism |
BioPath |
14 |
0,000 |
2 |
0,002 |
| (deoxy)ribose phosphate degradation |
AraCyc |
14 |
0,000 |
3 |
0,000 |
| pyrimidine nucleotide metabolism |
FunCat |
14 |
0,000 |
3 |
0,000 |
| Nucleotide Metabolism |
KEGG |
14 |
0,000 |
3 |
0,005 |
| Pyrimidine metabolism |
KEGG |
14 |
0,000 |
3 |
0,000 |
| Streptomycin biosynthesis |
KEGG |
14 |
0,000 |
2 |
0,000 |
| Phenylpropanoid Metabolism |
BioPath |
13 |
0,006 |
4 |
0,047 |
| pectin metabolism |
BioPath |
12 |
0,000 |
5 |
0,006 |
| secondary metabolism |
FunCat |
11 |
0,000 |
2 |
0,033 |
|
|
|
|
|
|
|
|
|
|
|
|
|
|
|
|
|
|
|
|
|
|
|
|
|
|
|
|
|
|
|
|
|
|
|
|
|
|
|
|
|
|
|
|
|
|
|
|
|
|
|
|
|
|
|
|
|
|
|
|
|
|
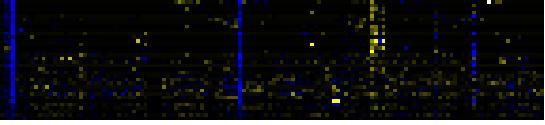
| Pathways co-expressed in the Mutant data set (with more than 6 annotation points) |
|
CYP76C7 (At3g61040) |
|
|
|
|
|
|
|
|
| max. difference between log2-ratios: |
6,5 |
|
|
|
|
|
|
|
|
|
|
|
|
| max. difference between log2-ratios excluding lowest and highest 5%: |
0,9 |
|
|
|
|
|
|
|
|
|
|
|
|
| Pathway |
Source |
Scores of Genes |
p[Score] |
No. of Genes |
p[genes] |
Link to mutants heatmap |
|
|
|
|
|
|
|
| Synthesis and storage of oil |
AcylLipid |
16 |
0,000 |
5 |
0,000 |
|
|
|
|
|
| Transcription |
KEGG |
13 |
0,000 |
2 |
0,002 |
|
|
|
|
| secondary metabolism |
FunCat |
12 |
0,000 |
2 |
0,009 |
|
|
|
|
| gibberellic acid biosynthesis |
TAIR-GO |
10 |
0,000 |
1 |
0,001 |
|
|
|
|
| gibberellin biosynthesis |
AraCyc |
10 |
0,000 |
1 |
0,002 |
|
|
|
|
| plant / fungal specific systemic sensing and response |
FunCat |
10 |
0,000 |
1 |
0,008 |
|
|
|
|
| plant hormonal regulation |
FunCat |
10 |
0,000 |
1 |
0,008 |
|
|
|
|
| Diterpenoid biosynthesis |
KEGG |
10 |
0,000 |
1 |
0,001 |
|
|
|
|
| Gibberellin metabolism |
LitPath |
10 |
0,000 |
1 |
0,003 |
|
|
|
|
|
|
|
|
|
|
|
| giberelin biosynthesis |
LitPath |
10 |
0,000 |
1 |
0,002 |
|
|
|
|
|
|
|
|
|
|
|
| DNA-directed RNA polymerase II, core complex |
TAIR-GO |
9 |
0,000 |
1 |
0,000 |
|
|
|
|
|
|
|
|
|
|
|
| transcription from RNA polymerase II promoter |
TAIR-GO |
9 |
0,000 |
1 |
0,000 |
|
|
|
|
|
|
|
|
|
|
|
| RNA polymerase |
KEGG |
9 |
0,000 |
1 |
0,007 |
|
|
|
|
|
|
|
|
|
|
|
| Carbon fixation |
KEGG |
8 |
0,000 |
2 |
0,001 |
|
|
|
|
|
|
|
|
|
|
|
| transport |
FunCat |
7 |
0,000 |
1 |
0,000 |
|
|
|
|
|
|
|
|
|
|
|
| transport ATPases |
FunCat |
7 |
0,000 |
1 |
0,023 |
|
|
|
|
|
|
|
|
|
|
|
| transport facilitation |
FunCat |
7 |
0,000 |
1 |
0,000 |
|
|
|
|
|
|
|
|
|
|
|
| Oxidative phosphorylation |
KEGG |
7 |
0,000 |
1 |
0,024 |
|
|
|
|
|
|
|
|
|
|
|
|
|
|
|
|
|
|
|
|
|
|
|
|
|
|
|
|