

| Co-Expression Analysis of: | CYPedia Home | Institut de Biologie Moléculaire des Plantes (Home) | ||||||||||||||
| CYP78A5 (At1g13710) | save all data as Tab Delimited Table | |||||||||||||||
| _________________________________________ | ||||||||||||||||
| Pathways co-expressed in the 3 applicable data sets (with more than 6 annotation points each) | Find below a list of pathways that are co-expressed with the bait. First a list of pathways is given that are co-expressed in all data sets. Lists for each individual dataset are shown underneath. Depending on the number of co-expressed pathways only the top scoring pathways are given; all data can be saved as text using the link above. |
|
||||||||||||||
| there are no co-expressed pathways in all three data sets | ||||||||||||||||
| To the right of each table a thumbnail of the actual co-expression heatmap is given. Klick on the link to see the heatmap containing all co-expressed genes. | ||||||||||||||||
| For more information on how these pathway maps were generated please read the methods page | ||||||||||||||||
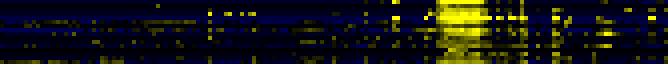
| Pathways co-expressed in the Organ and Tissue data set (with more than 6 annotation points) | CYP78A5 (At1g13710) | |||||||||||||||
| max. difference between log2-ratios: | 6.0 | |||||||||||||||
| max. difference between log2-ratios excluding lowest and highest 5%: | 4.6 | |||||||||||||||
| Pathway | Source | Scores of Genes | p[Score] | No. of Genes | p[genes] | Link to organ heatmap | ||||||||||
| secondary metabolism | FunCat | 13 | 0.000 | 3 | 0.000 |
|
||||||||||
| Cell Wall Carbohydrate Metabolism | BioPath | 12 | 0.000 | 2 | 0.016 | |||||||||||
| cellulose biosynthesis | BioPath | 12 | 0.000 | 2 | 0.000 | |||||||||||
| hemicellulose biosynthesis | BioPath | 8 | 0.000 | 1 | 0.000 | |||||||||||
| cellulose biosynthesis | AraCyc | 8 | 0.000 | 2 | 0.000 | |||||||||||
| auxin biosynthesis | TAIR-GO | 7 | 0.000 | 1 | 0.000 | |||||||||||
| auxin metabolism | TAIR-GO | 7 | 0.000 | 1 | 0.000 | |||||||||||
| regulation of transcription | TAIR-GO | 7 | 0.000 | 1 | 0.000 | |||||||||||
| regulation of transcription, DNA-dependent | TAIR-GO | 7 | 0.000 | 1 | 0.000 | |||||||||||
| IAA biosynthesis | AraCyc | 7 | 0.000 | 1 | 0.000 | |||||||||||
| IAA biosynthesis I | AraCyc | 7 | 0.000 | 1 | 0.000 | |||||||||||
| Pathways co-expressed in the Stress data set ( with more than 6 annotation points) | CYP78A5 (At1g13710) | |||||||||||||||
| max. difference between log2-ratios: | 2.9 | |||||||||||||||
| max. difference between log2-ratios excluding lowest and highest 5%: | 0.6 | |||||||||||||||
| Link to stress heatmap | ||||||||||||||||
| there are no co-expressed genes with | ||||||||||||||||
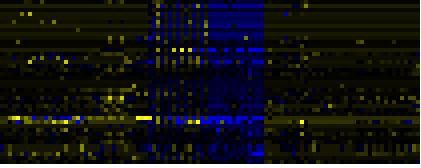
| Pathways co-expressed in the Hormone etc. data set (with more than 6 annotation points) | CYP78A5 (At1g13710) | |||||||||||||||
| max. difference between log2-ratios: | 1.4 | |||||||||||||||
| max. difference between log2-ratios excluding lowest and highest 5%: | 1.1 | |||||||||||||||
| Pathway | Source | Scores of Genes | p[Score] | No. of Genes | p[genes] | Link to hormones etc. heatmap | ||||||||||
| Biosynthesis of steroids | KEGG | 15 | 0.000 | 3 | 0.000 |
|
||||||||||
| glycolysis and gluconeogenesis | FunCat | 14 | 0.000 | 2 | 0.007 | |||||||||||
| Phenylpropanoid Metabolism | BioPath | 12 | 0.000 | 2 | 0.047 | |||||||||||
| TCA cycle variation VII | AraCyc | 11 | 0.000 | 2 | 0.007 | |||||||||||
| TCA cycle variation VIII | AraCyc | 11 | 0.000 | 2 | 0.003 | |||||||||||
| triterpene, sterol, and brassinosteroid metabolism | LitPath | 11 | 0.000 | 2 | 0.050 | |||||||||||
| Glucosyltransferases for benzoic acids | BioPath | 10 | 0.000 | 1 | 0.002 | |||||||||||
| Intermediary Carbon Metabolism | BioPath | 10 | 0.000 | 1 | 0.177 | |||||||||||
| lipoic acid metabolism | TAIR-GO | 10 | 0.000 | 1 | 0.000 | |||||||||||
| glyoxylate cycle | AraCyc | 10 | 0.000 | 1 | 0.007 | |||||||||||
| C-compound and carbohydrate utilization | FunCat | 10 | 0.000 | 1 | 0.000 | |||||||||||
| glyoxylate cycle | FunCat | 10 | 0.000 | 1 | 0.000 | |||||||||||
| Glyoxylate and dicarboxylate metabolism | KEGG | 10 | 0.000 | 1 | 0.011 | |||||||||||
| Pyruvate metabolism | KEGG | 10 | 0.000 | 1 | 0.066 | |||||||||||
| metabolism of acyl-lipids in mitochondria | AcylLipid | 10 | 0.000 | 1 | 0.029 | |||||||||||
| Biosynthesis of prenyl diphosphates | BioPath | 8 | 0.000 | 2 | 0.001 | |||||||||||
| Plastidial Isoprenoids (Chlorophylls, Carotenoids, Tocopherols, Plastoquinone, Phylloquinone) | BioPath | 8 | 0.001 | 2 | 0.007 | |||||||||||
| Terpenoid biosynthesis | KEGG | 8 | 0.000 | 2 | 0.000 | |||||||||||
| Transcription | KEGG | 8 | 0.000 | 2 | 0.010 | |||||||||||
| prenyl diphosphate (GPP,FPP, GGPP) biosynthesis | LitPath | 8 | 0.000 | 2 | 0.001 | |||||||||||
| pentacyclic triterpenoid biosynthesis | TAIR-GO | 7 | 0.000 | 1 | 0.000 | |||||||||||
| isoprenoid biosynthesis | FunCat | 7 | 0.000 | 1 | 0.019 | |||||||||||
| lipid, fatty acid and isoprenoid biosynthesis | FunCat | 7 | 0.000 | 1 | 0.014 | |||||||||||
| triterpene biosynthesis | LitPath | 7 | 0.000 | 1 | 0.007 | |||||||||||
| Pathways co-expressed in the Mutant data set (with more than 10 annotation points) | CYP78A5 (At1g13710) | |||||||||||||||
| max. difference between log2-ratios: | 4.1 | |||||||||||||||
| max. difference between log2-ratios excluding lowest and highest 5%: | 0.9 | |||||||||||||||
| Pathway | Source | Scores of Genes | p[Score] | No. of Genes | p[genes] | Link to mutants heatmap | ||||||||||
| Miscellaneous acyl lipid metabolism | AcylLipid | 8 | 0.000 | 4 | 0.006 |
|
||||||||||
| page created by Juergen Ehlting | 04/24/06 | |||||||||||||||