| _________________________________________ |
|
|
|
|
|
|
|
|
|
|
|
|
|
|
|
|
| Pathways co-expressed in all 4 data sets (with more than 6 annotation points each) |
|
Find below a list of pathways that are co-expressed with the bait. First a list of pathways is given that are co-expressed in all data sets. Lists for each individual dataset are shown underneath. Depending on the number of co-expressed pathways only the top scoring pathways are given; all data can be saved as text using the link above. |
|
|
|
|
|
|
|
| Pathway |
Source |
Sum of scores |
Sum of genes |
|
|
|
|
|
|
|
| Glucosinolate Metabolism |
LitPath |
360 |
36 |
|
|
|
|
|
|
|
| Biosynthesis of Amino Acids and Derivatives |
BioPath |
310 |
47 |
|
|
|
|
|
|
|
| glucosinolate biosynthesis |
TAIR-GO |
200 |
20 |
|
|
|
|
|
|
|
| Branched-chain amino acids from aspartate |
BioPath |
188 |
30 |
|
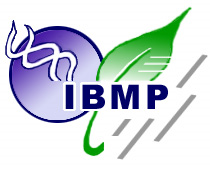
To the right of each table a thumbnail of the actual co-expression heatmap is given. Klick on the link to see the heatmap containing all co-expressed genes. |
|
|
|
|
|
|
|
|
| leucine biosynthesis |
AraCyc |
174 |
27 |
|
|
|
|
|
|
|
|
|
| glucosinolate biosynthesis from homomethionine |
AraCyc |
150 |
15 |
|
|
|
|
|
|
|
|
|
| leucine biosynthesis |
TAIR-GO |
144 |
22 |
|
For more information on how these pathway maps were generated please read the methods page |
|
|
|
|
|
|
|
|
| Valine, leucine and isoleucine biosynthesis |
KEGG |
140 |
20 |
|
|
|
|
|
|
|
|
|
| amino acid metabolism |
FunCat |
101 |
13 |
|
|
|
|
|
|
|
|
|
|
|
|
|
| Flavonoid and anthocyanin metabolism |
BioPath |
90 |
9 |
|
|
|
|
|
|
|
|
|
|
|
|
|
| sulfate assimilation III |
AraCyc |
81 |
9 |
|
|
|
|
|
|
|
|
|
|
|
|
|
| Selenoamino acid metabolism |
KEGG |
80 |
8 |
|
|
|
|
|
|
|
|
|
|
|
|
|
| Sulfur metabolism |
KEGG |
80 |
8 |
|
|
|
|
|
|
|
|
|
|
|
|
|
| Pyruvate metabolism |
KEGG |
80 |
8 |
|
|
|
|
|
|
|
|
|
|
|
|
|
| TCA cycle -- aerobic respiration |
AraCyc |
64 |
12 |
|
|
|
|
|
|
|
|
|
|
|
|
|
| glucosinolate biosynthesis from phenylalanine |
AraCyc |
60 |
6 |
|
|
|
|
|
|
|
|
|
|
|
|
|
| TCA cycle variation IV |
AraCyc |
60 |
10 |
|
|
|
|
|
|
|
|
|
|
|
|
|
| Stilbene, coumarine and lignin biosynthesis |
KEGG |
56 |
7 |
|
|
|
|
|
|
|
|
|
|
|
|
|
| Ascorbate and aldarate metabolism |
KEGG |
44 |
5 |
|
|
|
|
|
|
|
|
|
|
|
|
|
| response to UV |
TAIR-GO |
40 |
4 |
|
|
|
|
|
|
|
|
|
|
|
|
|
| homomethionine biosynthesis |
AraCyc |
40 |
4 |
|
|
|
|
|
|
|
|
|
|
|
|
|
| Fluorene degradation |
KEGG |
40 |
4 |
|
|
|
|
|
|
|
|
|
|
|
|
|
| gamma-Hexachlorocyclohexane degradation |
KEGG |
40 |
4 |
|
|
|
|
|
|
|
|
|
|
|
|
|
|
|
|
|
|
|
|
|
|
|
|
|
|
|
|
|
|
|
|
|
|
|
|
|
|
|
|
|
|
|
|
|
|
|
| Pathways co-expressed in the Organ and Tissue data set (with more than 18 annotation points) |
|
CYP79F1 and / or CYP79F2 (At1g16400 / At1g16410) |
|
|
|
|
|
|
|
|
| max. difference between log2-ratios: |
6.6 |
|
|
|
|
|
|
|
|
|
|
|
|
| max. difference between log2-ratios excluding lowest and highest 5%: |
5.1 |
|
|
|
|
|
|
|
|
|
|
|
|
| Pathway |
Source |
Scores of Genes |
p[Score] |
No. of Genes |
p[genes] |
Link to organ heatmap |
|
|
|
|
|
|
|
| Glucosinolate Metabolism |
LitPath |
130 |
0.000 |
13 |
0.000 |
|
|
|
| Biosynthesis of Amino Acids and Derivatives |
BioPath |
126 |
0.000 |
17 |
0.000 |
|
|
| Glutathione metabolism |
BioPath |
60 |
0.000 |
8 |
0.000 |
|
|
| glucosinolate biosynthesis |
TAIR-GO |
60 |
0.000 |
6 |
0.000 |
|
|
| Selenoamino acid metabolism |
KEGG |
50 |
0.000 |
5 |
0.000 |
|
|
| Sulfur metabolism |
KEGG |
50 |
0.000 |
5 |
0.000 |
|
|
| Branched-chain amino acids from aspartate |
BioPath |
46 |
0.000 |
7 |
0.000 |
|
|
| sulfate assimilation III |
AraCyc |
46 |
0.000 |
5 |
0.000 |
|
|
| amino acid metabolism |
FunCat |
44 |
0.000 |
5 |
0.001 |
|
|
| Phenylpropanoid Metabolism |
BioPath |
40 |
0.002 |
4 |
0.322 |
|
|
| glucosinolate biosynthesis from homomethionine |
AraCyc |
40 |
0.000 |
4 |
0.000 |
|
|
| leucine biosynthesis |
AraCyc |
40 |
0.000 |
6 |
0.000 |
|
|
| Valine, leucine and isoleucine biosynthesis |
KEGG |
36 |
0.000 |
5 |
0.000 |
|
|
| Flavonoid and anthocyanin metabolism |
BioPath |
30 |
0.000 |
3 |
0.031 |
|
|
|
|
|
|
|
|
|
|
|
| glucosinolate biosynthesis from phenylalanine |
AraCyc |
30 |
0.000 |
3 |
0.000 |
|
|
|
|
|
|
|
|
|
|
|
| Purine metabolism |
KEGG |
30 |
0.000 |
3 |
0.029 |
|
|
|
|
|
|
|
|
|
|
|
| dissimilatory sulfate reduction |
AraCyc |
26 |
0.000 |
3 |
0.000 |
|
|
|
|
|
|
|
|
|
|
|
| Cysteine metabolism |
KEGG |
26 |
0.000 |
3 |
0.002 |
|
|
|
|
|
|
|
|
|
|
|
| Stilbene, coumarine and lignin biosynthesis |
KEGG |
22 |
0.000 |
3 |
0.127 |
|
|
|
|
|
|
|
|
|
|
|
| Transcriptional regulators (chloroplast) |
BioPath |
20 |
0.000 |
2 |
0.000 |
|
|
|
|
|
|
|
|
|
|
|
| indoleacetic acid biosynthesis |
TAIR-GO |
20 |
0.000 |
2 |
0.000 |
|
|
|
|
|
|
|
|
|
|
|
| positive regulation of transcription |
TAIR-GO |
20 |
0.000 |
2 |
0.000 |
|
|
|
|
|
|
|
|
|
|
|
| regulation of transcription |
TAIR-GO |
20 |
0.000 |
2 |
0.000 |
|
|
|
|
|
|
|
|
|
|
|
| sulfate assimilation |
TAIR-GO |
20 |
0.000 |
2 |
0.001 |
|
|
|
|
|
|
|
|
|
|
|
| glucosinolate biosynthesis from tryptophan |
AraCyc |
20 |
0.000 |
2 |
0.000 |
|
|
|
|
|
|
|
|
|
|
|
| nitrogen and sulfur metabolism |
FunCat |
20 |
0.000 |
2 |
0.001 |
|
|
|
|
|
|
|
|
|
|
|
| nitrogen and sulfur utilization |
FunCat |
20 |
0.000 |
2 |
0.000 |
|
|
|
|
|
|
|
|
|
|
|
| Pyruvate metabolism |
KEGG |
20 |
0.005 |
2 |
0.165 |
|
|
|
|
|
|
|
|
|
|
|
| Lipid signaling |
AcylLipid |
20 |
0.000 |
4 |
0.047 |
|
|
|
|
|
|
|
|
|
|
|
|
|
|
|
|
|
|
|
|
|
|
|
|
|
|
|
|
|
|
|
|
|
|
|
|
|
|
|
|
|
|
|
|
|
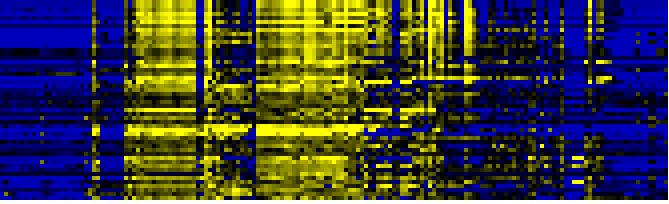
| Pathways co-expressed in the Stress data set ( with more than 15 annotation points) |
|
CYP79F1 and / or CYP79F2 (At1g16400 / At1g16410) |
|
|
|
|
|
|
|
|
| max. difference between log2-ratios: |
6.9 |
|
|
|
|
|
|
|
|
|
|
|
|
| max. difference between log2-ratios excluding lowest and highest 5%: |
3.4 |
|
|
|
|
|
|
|
|
|
|
|
|
| Pathway |
Source |
Scores of Genes |
p[Score] |
No. of Genes |
p[genes] |
Link to stress heatmap |
|
|
|
|
|
|
|
| Biosynthesis of Amino Acids and Derivatives |
BioPath |
82 |
0.000 |
13 |
0.000 |
|
| Glucosinolate Metabolism |
LitPath |
80 |
0.000 |
8 |
0.000 |
| Branched-chain amino acids from aspartate |
BioPath |
64 |
0.000 |
10 |
0.000 |
| glucosinolate biosynthesis |
TAIR-GO |
50 |
0.000 |
5 |
0.000 |
| leucine biosynthesis |
AraCyc |
42 |
0.000 |
7 |
0.000 |
| Valine, leucine and isoleucine biosynthesis |
KEGG |
42 |
0.000 |
6 |
0.000 |
| glucosinolate biosynthesis from homomethionine |
AraCyc |
40 |
0.000 |
4 |
0.000 |
| Pyruvate metabolism |
KEGG |
30 |
0.000 |
3 |
0.023 |
| TCA cycle -- aerobic respiration |
AraCyc |
26 |
0.000 |
5 |
0.001 |
| TCA cycle variation VII |
AraCyc |
26 |
0.000 |
5 |
0.008 |
| TCA cycle variation VIII |
AraCyc |
26 |
0.000 |
5 |
0.001 |
| TCA cycle variation IV |
AraCyc |
24 |
0.000 |
4 |
0.005 |
|
|
|
|
|
|
|
|
|
|
|
| Carbon fixation |
KEGG |
22 |
0.000 |
3 |
0.016 |
|
|
|
|
|
|
|
|
|
|
|
| Flavonoid and anthocyanin metabolism |
BioPath |
20 |
0.000 |
2 |
0.080 |
|
|
|
|
|
|
|
|
|
|
|
| amino acid metabolism |
FunCat |
20 |
0.000 |
3 |
0.010 |
|
|
|
|
|
|
|
|
|
|
|
| Glycine, serine and threonine metabolism |
KEGG |
20 |
0.000 |
3 |
0.002 |
|
|
|
|
|
|
|
|
|
|
|
| C-compound and carbohydrate metabolism |
FunCat |
18 |
0.011 |
3 |
0.172 |
|
|
|
|
|
|
|
|
|
|
|
| Alanine and aspartate metabolism |
KEGG |
17 |
0.000 |
3 |
0.001 |
|
|
|
|
|
|
|
|
|
|
|
| aspartate degradation I |
AraCyc |
16 |
0.000 |
2 |
0.027 |
|
|
|
|
|
|
|
|
|
|
|
| aspartate degradation II |
AraCyc |
16 |
0.000 |
2 |
0.007 |
|
|
|
|
|
|
|
|
|
|
|
| sulfate assimilation III |
AraCyc |
16 |
0.001 |
2 |
0.051 |
|
|
|
|
|
|
|
|
|
|
|
| secondary metabolism |
FunCat |
16 |
0.000 |
2 |
0.013 |
|
|
|
|
|
|
|
|
|
|
|
| Cysteine metabolism |
KEGG |
16 |
0.000 |
2 |
0.007 |
|
|
|
|
|
|
|
|
|
|
|
|
|
|
|
|
|
|
|
|
|
|
|
|
|
|
|
|
|
|
|
|
|
|
|
|
|
|
|
|
|
|
|
|
|
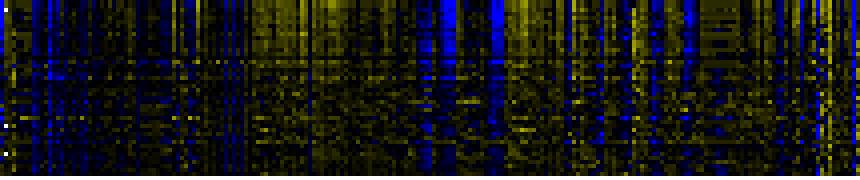
| Pathways co-expressed in the Hormone etc. data set (with more than 10 annotation points) |
|
CYP79F1 and / or CYP79F2 (At1g16400 / At1g16410) |
|
|
|
|
|
|
|
|
| max. difference between log2-ratios: |
6.3 |
|
|
|
|
|
|
|
|
|
|
|
|
| max. difference between log2-ratios excluding lowest and highest 5%: |
3.2 |
|
|
|
|
|
|
|
|
|
|
|
|
| Pathway |
Source |
Scores of Genes |
p[Score] |
No. of Genes |
p[genes] |
Link to hormones etc. heatmap |
|
|
|
|
|
|
|
| Glucosinolate Metabolism |
LitPath |
70 |
0.000 |
7 |
0.000 |
|
|
|
|
|
|
| glucosinolate biosynthesis |
TAIR-GO |
50 |
0.000 |
5 |
0.000 |
|
|
|
|
|
| Biosynthesis of Amino Acids and Derivatives |
BioPath |
48 |
0.000 |
8 |
0.000 |
|
|
|
|
|
| glucosinolate biosynthesis from homomethionine |
AraCyc |
40 |
0.000 |
4 |
0.000 |
|
|
|
|
|
| Branched-chain amino acids from aspartate |
BioPath |
36 |
0.000 |
6 |
0.000 |
|
|
|
|
|
| leucine biosynthesis |
AraCyc |
30 |
0.000 |
5 |
0.000 |
|
|
|
|
|
| Valine, leucine and isoleucine biosynthesis |
KEGG |
26 |
0.000 |
4 |
0.000 |
|
|
|
|
|
| Flavonoid and anthocyanin metabolism |
BioPath |
20 |
0.000 |
2 |
0.019 |
|
|
|
|
|
| Phenylpropanoid Metabolism |
BioPath |
20 |
0.008 |
2 |
0.272 |
|
|
|
|
|
|
|
|
|
|
|
| development |
TAIR-GO |
19 |
0.000 |
2 |
0.023 |
|
|
|
|
|
|
|
|
|
|
|
| response to jasmonic acid stimulus |
TAIR-GO |
16 |
0.000 |
2 |
0.000 |
|
|
|
|
|
|
|
|
|
|
|
| response to wounding |
TAIR-GO |
16 |
0.000 |
2 |
0.006 |
|
|
|
|
|
|
|
|
|
|
|
| Ascorbate and aldarate metabolism |
KEGG |
14 |
0.000 |
2 |
0.001 |
|
|
|
|
|
|
|
|
|
|
|
| isoleucine degradation I |
AraCyc |
13 |
0.000 |
2 |
0.004 |
|
|
|
|
|
|
|
|
|
|
|
| isoleucine degradation III |
AraCyc |
13 |
0.000 |
2 |
0.000 |
|
|
|
|
|
|
|
|
|
|
|
| leucine degradation I |
AraCyc |
13 |
0.000 |
2 |
0.004 |
|
|
|
|
|
|
|
|
|
|
|
| leucine degradation II |
AraCyc |
13 |
0.000 |
2 |
0.000 |
|
|
|
|
|
|
|
|
|
|
|
| valine degradation I |
AraCyc |
13 |
0.000 |
2 |
0.011 |
|
|
|
|
|
|
|
|
|
|
|
| valine degradation II |
AraCyc |
13 |
0.000 |
2 |
0.001 |
|
|
|
|
|
|
|
|
|
|
|
| amino acid metabolism |
FunCat |
13 |
0.000 |
2 |
0.002 |
|
|
|
|
|
|
|
|
|
|
|
| Glutathione metabolism |
BioPath |
12 |
0.002 |
2 |
0.035 |
|
|
|
|
|
|
|
|
|
|
|
| TCA cycle -- aerobic respiration |
AraCyc |
12 |
0.000 |
2 |
0.026 |
|
|
|
|
|
|
|
|
|
|
|
| TCA cycle variation IV |
AraCyc |
12 |
0.000 |
2 |
0.023 |
|
|
|
|
|
|
|
|
|
|
|
| TCA cycle variation VII |
AraCyc |
12 |
0.015 |
2 |
0.071 |
|
|
|
|
|
|
|
|
|
|
|
| TCA cycle variation VIII |
AraCyc |
12 |
0.001 |
2 |
0.029 |
|
|
|
|
|
|
|
|
|
|
|
|
|
|
|
|
|
|
|
|
|
|
|
|
|
|
|
|
|
|
|
|
|
|
|
|
|
|
|
|
|
|
|
|
|
|
|
|
|
|
|
|
|
|
|
|
|
|
|
|
|
|
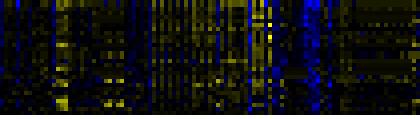
| Pathways co-expressed in the Mutant data set (with more than 10 annotation points) |
|
CYP79F1 and / or CYP79F2 (At1g16400 / At1g16410) |
|
|
|
|
|
|
|
|
| max. difference between log2-ratios: |
5.4 |
|
|
|
|
|
|
|
|
|
|
|
|
| max. difference between log2-ratios excluding lowest and highest 5%: |
2.7 |
|
|
|
|
|
|
|
|
|
|
|
|
| Pathway |
Source |
Scores of Genes |
p[Score] |
No. of Genes |
p[genes] |
Link to mutants heatmap |
|
|
|
|
|
|
|
| Glucosinolate Metabolism |
LitPath |
80 |
0.000 |
8 |
0.000 |
|
|
|
|
| Biosynthesis of Amino Acids and Derivatives |
BioPath |
54 |
0.000 |
9 |
0.000 |
|
|
|
| Branched-chain amino acids from aspartate |
BioPath |
42 |
0.000 |
7 |
0.000 |
|
|
|
| leucine biosynthesis |
AraCyc |
42 |
0.000 |
7 |
0.000 |
|
|
|
| glucosinolate biosynthesis |
TAIR-GO |
40 |
0.000 |
4 |
0.000 |
|
|
|
| Valine, leucine and isoleucine biosynthesis |
KEGG |
36 |
0.000 |
5 |
0.000 |
|
|
|
|
|
|
|
|
|
|
|
| glucosinolate biosynthesis from homomethionine |
AraCyc |
30 |
0.000 |
3 |
0.000 |
|
|
|
|
|
|
|
|
|
|
|
| amino acid metabolism |
FunCat |
24 |
0.000 |
3 |
0.000 |
|
|
|
|
|
|
|
|
|
|
|
| Flavonoid and anthocyanin metabolism |
BioPath |
20 |
0.000 |
2 |
0.010 |
|
|
|
|
|
|
|
|
|
|
|
| Phenylpropanoid Metabolism |
BioPath |
20 |
0.000 |
2 |
0.167 |
|
|
|
|
|
|
|
|
|
|
|
| Pyruvate metabolism |
KEGG |
20 |
0.000 |
2 |
0.020 |
|
|
|
|
|
|
|
|
|
|
|
| histidine biosynthesis |
AraCyc |
16 |
0.000 |
2 |
0.001 |
|
|
|
|
|
|
|
|
|
|
|
| histidine biosynthesis I |
AraCyc |
16 |
0.000 |
2 |
0.001 |
|
|
|
|
|
|
|
|
|
|
|
| Alkaloid biosynthesis I |
KEGG |
16 |
0.000 |
2 |
0.001 |
|
|
|
|
|
|
|
|
|
|
|
| Cysteine metabolism |
KEGG |
16 |
0.000 |
2 |
0.001 |
|
|
|
|
|
|
|
|
|
|
|
| Novobiocin biosynthesis |
KEGG |
16 |
0.000 |
2 |
0.000 |
|
|
|
|
|
|
|
|
|
|
|
| Phenylalanine metabolism |
KEGG |
16 |
0.000 |
2 |
0.034 |
|
|
|
|
|
|
|
|
|
|
|
| Phenylalanine, tyrosine and tryptophan biosynthesis |
KEGG |
16 |
0.000 |
2 |
0.005 |
|
|
|
|
|
|
|
|
|
|
|
| Tyrosine metabolism |
KEGG |
16 |
0.000 |
2 |
0.004 |
|
|
|
|
|
|
|
|
|
|
|
| TCA cycle -- aerobic respiration |
AraCyc |
14 |
0.000 |
3 |
0.003 |
|
|
|
|
|
|
|
|
|
|
|
| TCA cycle variation VII |
AraCyc |
14 |
0.001 |
3 |
0.011 |
|
|
|
|
|
|
|
|
|
|
|
| TCA cycle variation VIII |
AraCyc |
14 |
0.000 |
3 |
0.003 |
|
|
|
|
|
|
|
|
|
|
|
| Glutathione metabolism |
BioPath |
12 |
0.000 |
2 |
0.018 |
|
|
|
|
|
|
|
|
|
|
|
| TCA cycle variation IV |
AraCyc |
12 |
0.000 |
2 |
0.018 |
|
|
|
|
|
|
|
|
|
|
|
|
|
|
|
|
|
|
|
|
|
|
|
|
|
|
|
|