| _________________________________________ |
|
|
|
|
|
|
|
|
|
|
|
|
|
|
|
| Pathways co-expressed in the 3 data sets with co-expressed pathways (with more than 6 annotation points each) |
|
Find below a list of pathways that are co-expressed with the bait. First a list of pathways is given that are co-expressed in all data sets. Lists for each individual dataset are shown underneath. Depending on the number of co-expressed pathways only the top scoring pathways are given; all data can be saved as text using the link above. |
|
|
|
|
|
|
| Pathway |
Source |
Sum of scores |
Sum of genes |
|
|
|
|
|
|
|
| Plastidial Isoprenoids (Chlorophylls, Carotenoids, Tocopherols, Plastoquinone, Phylloquinone) |
BioPath |
291 |
36 |
|
|
|
|
|
|
|
| chlorophyll biosynthesis |
TAIR-GO |
264 |
31 |
|
|
|
|
|
|
|
| chlorophyll biosynthesis |
TAIR-GO |
264 |
31 |
|
|
|
|
|
|
|
|
|
| chlorophyll biosynthesis |
TAIR-GO |
264 |
31 |
|
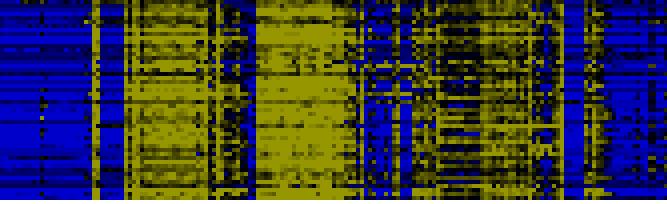
To the right of each table a thumbnail of the actual co-expression heatmap is given. Klick on the link to see the heatmap containing all co-expressed genes. |
|
|
|
|
|
|
|
|
| photosynthesis |
FunCat |
247 |
36 |
|
|
|
|
|
|
|
|
|
| photosynthesis |
FunCat |
247 |
36 |
|
|
|
|
|
|
|
|
|
| Carbon fixation |
KEGG |
143 |
20 |
|
For more information on how these pathway maps were generated please read the methods page |
|
|
|
|
|
|
|
|
| photorespiration |
AraCyc |
128 |
24 |
|
|
|
|
|
|
|
|
|
| photorespiration |
AraCyc |
128 |
24 |
|
|
|
|
|
|
|
|
|
|
|
|
|
| chlorophyll and phytochromobilin metabolism |
LitPath |
120 |
14 |
|
|
|
|
|
|
|
|
|
|
|
|
|
| Biosynthesis of steroids |
KEGG |
111 |
12 |
|
|
|
|
|
|
|
|
|
|
|
|
|
| Glycolysis / Gluconeogenesis |
KEGG |
108 |
15 |
|
|
|
|
|
|
|
|
|
|
|
|
|
| Calvin cycle |
AraCyc |
96 |
15 |
|
|
|
|
|
|
|
|
|
|
|
|
|
| Pentose phosphate pathway |
KEGG |
90 |
12 |
|
|
|
|
|
|
|
|
|
|
|
|
|
| carotenoid biosynthesis |
AraCyc |
64 |
7 |
|
|
|
|
|
|
|
|
|
|
|
|
|
| carotenoid biosynthesis |
AraCyc |
64 |
7 |
|
|
|
|
|
|
|
|
|
|
|
|
|
| Ascorbate and aldarate metabolism |
KEGG |
63 |
9 |
|
|
|
|
|
|
|
|
|
|
|
|
|
| Carotenoid and abscisic acid metabolism |
LitPath |
62 |
7 |
|
|
|
|
|
|
|
|
|
|
|
|
|
| Transcription (chloroplast) |
BioPath |
56 |
7 |
|
|
|
|
|
|
|
|
|
|
|
|
|
| transcription initiation |
TAIR-GO |
56 |
7 |
|
|
|
|
|
|
|
|
|
|
|
|
|
| Carotenoid biosynthesis |
BioPath |
56 |
6 |
|
|
|
|
|
|
|
|
|
|
|
|
|
| carotenid biosynthesis |
LitPath |
56 |
6 |
|
|
|
|
|
|
|
|
|
|
|
|
|
| Synthesis of membrane lipids in plastids |
AcylLipid |
52 |
6 |
|
|
|
|
|
|
|
|
|
|
|
|
|
| energy |
FunCat |
50 |
6 |
|
|
|
|
|
|
|
|
|
|
|
|
|
| IPP (isopentenyl diphosphate) and DMAPP (dimethylallyl diphosphat) biosynthesis |
LitPath |
47 |
5 |
|
|
|
|
|
|
|
|
|
|
|
|
|
| carotene biosynthesis |
TAIR-GO |
40 |
4 |
|
|
|
|
|
|
|
|
|
|
|
|
|
| MEP (methylerythritol P) pathway, plastids |
LitPath |
37 |
4 |
|
|
|
|
|
|
|
|
|
|
|
|
|
| oxidative branch of the pentose phosphate pathway |
AraCyc |
36 |
6 |
|
|
|
|
|
|
|
|
|
|
|
|
|
| metabolism of energy reserves (e.g. glycogen, trehalose) |
FunCat |
36 |
4 |
|
|
|
|
|
|
|
|
|
|
|
|
|
| isopentenyl diphosphate biosynthesis -- mevalonate-independent |
AraCyc |
30 |
3 |
|
|
|
|
|
|
|
|
|
|
|
|
|
| pyridoxal 5'-phosphate biosynthesis |
AraCyc |
30 |
3 |
|
|
|
|
|
|
|
|
|
|
|
|
|
| thiamine biosynthesis |
AraCyc |
30 |
3 |
|
|
|
|
|
|
|
|
|
|
|
|
|
| lipid, fatty acid and isoprenoid metabolism of energy reserves (e.g. glycogen, trehalose) |
FunCat |
30 |
3 |
|
|
|
|
|
|
|
|
|
|
|
|
|
|
|
|
|
|
|
|
|
|
|
|
|
|
|
|
|
|
|
|
|
|
|
|
|
|
|
|
|
|
|
|
|
|
|
| Pathways co-expressed in the Organ and Tissue data set (with more than 19 annotation points) |
|
CYP81D40 (At4g37330) |
|
|
|
|
|
|
|
|
| max. difference between log2-ratios: |
3.9 |
|
|
|
|
|
|
|
|
|
|
|
|
| max. difference between log2-ratios excluding lowest and highest 5%: |
3.0 |
|
|
|
|
|
|
|
|
|
|
|
|
| Pathway |
Source |
Scores of Genes |
p[Score] |
No. of Genes |
p[genes] |
Link to organ heatmap |
|
|
|
|
|
|
|
| Photosystems |
BioPath |
109 |
0.000 |
19 |
0.000 |
|
|
|
| Plastidial Isoprenoids (Chlorophylls, Carotenoids, Tocopherols, Plastoquinone, Phylloquinone) |
BioPath |
73 |
0.000 |
10 |
0.001 |
|
|
| Photosynthesis |
KEGG |
51 |
0.000 |
9 |
0.000 |
|
|
| biogenesis of chloroplast |
FunCat |
44 |
0.000 |
8 |
0.000 |
|
|
| Photosystem I |
BioPath |
41 |
0.000 |
7 |
0.004 |
|
|
| photosynthesis |
FunCat |
41 |
0.000 |
6 |
0.000 |
|
|
| additional photosystem II components |
BioPath |
40 |
0.000 |
8 |
0.000 |
|
|
| Carbon fixation |
KEGG |
35 |
0.000 |
4 |
0.005 |
|
|
| Transcription (chloroplast) |
BioPath |
34 |
0.000 |
4 |
0.000 |
|
|
| transcription initiation |
TAIR-GO |
34 |
0.000 |
4 |
0.000 |
|
|
| Chlorophyll a/b binding proteins |
BioPath |
32 |
0.000 |
4 |
0.001 |
|
|
| photosystem I |
TAIR-GO |
31 |
0.000 |
4 |
0.000 |
|
|
| Pentose phosphate pathway |
KEGG |
30 |
0.000 |
3 |
0.005 |
|
|
| Glutamate metabolism |
KEGG |
28 |
0.000 |
3 |
0.006 |
|
|
|
|
|
|
|
|
|
|
|
| light harvesting complex |
BioPath |
26 |
0.000 |
3 |
0.000 |
|
|
|
|
|
|
|
|
|
|
|
| chlorophyll biosynthesis |
TAIR-GO |
25 |
0.000 |
3 |
0.001 |
|
|
|
|
|
|
|
|
|
|
|
| Biosynthesis of prenyl diphosphates |
BioPath |
24 |
0.022 |
3 |
0.144 |
|
|
|
|
|
|
|
|
|
|
|
| photosystem II |
TAIR-GO |
23 |
0.000 |
3 |
0.000 |
|
|
|
|
|
|
|
|
|
|
|
| Photosystem II |
BioPath |
21 |
0.018 |
3 |
0.104 |
|
|
|
|
|
|
|
|
|
|
|
| photosystem I reaction center |
BioPath |
20 |
0.000 |
4 |
0.000 |
|
|
|
|
|
|
|
|
|
|
|
| pentose-phosphate shunt |
TAIR-GO |
20 |
0.000 |
2 |
0.007 |
|
|
|
|
|
|
|
|
|
|
|
| Calvin cycle |
AraCyc |
20 |
0.000 |
2 |
0.154 |
|
|
|
|
|
|
|
|
|
|
|
| pentose-phosphate pathway |
FunCat |
20 |
0.000 |
2 |
0.010 |
|
|
|
|
|
|
|
|
|
|
|
| Biosynthesis of steroids |
KEGG |
20 |
0.000 |
2 |
0.045 |
|
|
|
|
|
|
|
|
|
|
|
| Fructose and mannose metabolism |
KEGG |
20 |
0.000 |
2 |
0.045 |
|
|
|
|
|
|
|
|
|
|
|
| Glycolysis / Gluconeogenesis |
KEGG |
20 |
0.001 |
2 |
0.150 |
|
|
|
|
|
|
|
|
|
|
|
|
|
|
|
|
|
|
|
|
|
|
|
|
|
|
|
|
|
|
|
|
|
|
|
|
|
|
|
|
|
|
|
|
|
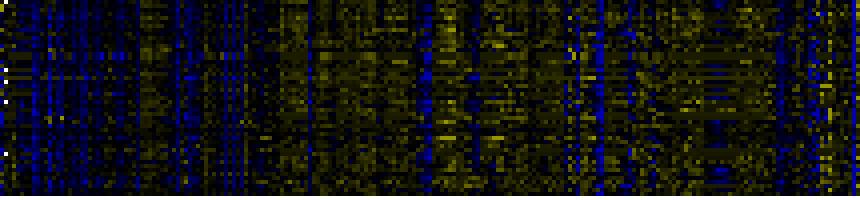
| Pathways co-expressed in the Stress data set ( with more than 10 annotation points) |
|
CYP81D40 (At4g37330) |
|
|
|
|
|
|
|
|
| max. difference between log2-ratios: |
3.2 |
|
|
|
|
|
|
|
|
|
|
|
|
| max. difference between log2-ratios excluding lowest and highest 5%: |
1.5 |
|
|
|
|
|
|
|
|
|
|
|
|
| Pathway |
Source |
Scores of Genes |
p[Score] |
No. of Genes |
p[genes] |
Link to stress heatmap |
|
|
|
|
|
|
|
| C-compound and carbohydrate metabolism |
FunCat |
60 |
0.000 |
10 |
0.001 |
|
| Intermediary Carbon Metabolism |
BioPath |
42 |
0.000 |
5 |
0.020 |
| Plastidial Isoprenoids (Chlorophylls, Carotenoids, Tocopherols, Plastoquinone, Phylloquinone) |
BioPath |
34 |
0.000 |
4 |
0.005 |
| Glycolysis / Gluconeogenesis |
KEGG |
30 |
0.000 |
4 |
0.003 |
| pentose-phosphate pathway |
FunCat |
26 |
0.000 |
3 |
0.000 |
| Pentose phosphate pathway |
KEGG |
26 |
0.000 |
3 |
0.002 |
| glycolysis and gluconeogenesis |
FunCat |
24 |
0.000 |
4 |
0.030 |
| Biosynthesis of steroids |
KEGG |
24 |
0.000 |
3 |
0.003 |
| Leaf Glycerolipid Biosynthesis in Plastid |
BioPath |
22 |
0.000 |
3 |
0.007 |
| Synthesis of membrane lipids in plastids |
AcylLipid |
22 |
0.000 |
3 |
0.000 |
| pentose-phosphate shunt |
TAIR-GO |
20 |
0.000 |
2 |
0.001 |
| Fructose and mannose metabolism |
KEGG |
20 |
0.000 |
3 |
0.003 |
| metabolism of acyl-lipids in mitochondria |
AcylLipid |
20 |
0.000 |
2 |
0.007 |
|
|
|
|
|
|
|
|
|
|
|
| lipid, fatty acid and isoprenoid metabolism |
FunCat |
19 |
0.000 |
2 |
0.023 |
|
|
|
|
|
|
|
|
|
|
|
| Gluconeogenesis from lipids in seeds |
BioPath |
18 |
0.000 |
3 |
0.014 |
|
|
|
|
|
|
|
|
|
|
|
| acetate fermentation |
AraCyc |
18 |
0.000 |
3 |
0.009 |
|
|
|
|
|
|
|
|
|
|
|
| fructose degradation (anaerobic) |
AraCyc |
18 |
0.000 |
3 |
0.007 |
|
|
|
|
|
|
|
|
|
|
|
| glycolysis I |
AraCyc |
18 |
0.001 |
3 |
0.066 |
|
|
|
|
|
|
|
|
|
|
|
| glycolysis IV |
AraCyc |
18 |
0.000 |
3 |
0.007 |
|
|
|
|
|
|
|
|
|
|
|
| mannitol degradation |
AraCyc |
18 |
0.000 |
3 |
0.000 |
|
|
|
|
|
|
|
|
|
|
|
| sorbitol degradation |
AraCyc |
18 |
0.000 |
3 |
0.000 |
|
|
|
|
|
|
|
|
|
|
|
| sorbitol fermentation |
AraCyc |
18 |
0.000 |
3 |
0.008 |
|
|
|
|
|
|
|
|
|
|
|
| Calvin cycle |
AraCyc |
16 |
0.000 |
2 |
0.010 |
|
|
|
|
|
|
|
|
|
|
|
| energy |
FunCat |
16 |
0.000 |
2 |
0.000 |
|
|
|
|
|
|
|
|
|
|
|
| metabolism of energy reserves (e.g. glycogen, trehalose) |
FunCat |
16 |
0.000 |
2 |
0.000 |
|
|
|
|
|
|
|
|
|
|
|
| photosynthesis |
FunCat |
16 |
0.000 |
2 |
0.028 |
|
|
|
|
|
|
|
|
|
|
|
| Carbon fixation |
KEGG |
16 |
0.000 |
2 |
0.052 |
|
|
|
|
|
|
|
|
|
|
|
| Glycerolipid metabolism |
KEGG |
16 |
0.000 |
3 |
0.001 |
|
|
|
|
|
|
|
|
|
|
|
| triterpene, sterol, and brassinosteroid metabolism |
LitPath |
16 |
0.002 |
3 |
0.041 |
|
|
|
|
|
|
|
|
|
|
|
|
|
|
|
|
|
|
|
|
|
|
|
|
|
|
|
|
|
|
|
|
|
|
|
|
|
|
|
|
|
|
|
|
|
|
|
|
|
|
|
|
|
|
|
|
|
|
|
|
|
|
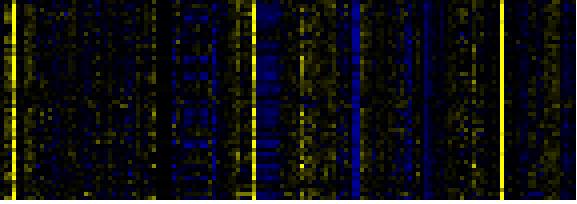
| Pathways co-expressed in the Mutant data set (with more than 50 annotation points) |
|
CYP81D40 (At4g37330) |
|
|
|
|
|
|
|
|
| max. difference between log2-ratios: |
3.3 |
|
|
|
|
|
|
|
|
|
|
|
|
| max. difference between log2-ratios excluding lowest and highest 5%: |
1.2 |
|
|
|
|
|
|
|
|
|
|
|
|
| Pathway |
Source |
Scores of Genes |
p[Score] |
No. of Genes |
p[genes] |
Link to mutants heatmap |
|
|
|
|
|
|
|
| Photosystems |
BioPath |
341 |
0.000 |
49 |
0.000 |
|
|
|
|
| Plastidial Isoprenoids (Chlorophylls, Carotenoids, Tocopherols, Plastoquinone, Phylloquinone) |
BioPath |
184 |
0.000 |
22 |
0.000 |
|
|
|
| C-compound and carbohydrate metabolism |
FunCat |
175 |
0.000 |
27 |
0.044 |
|
|
|
| biogenesis of chloroplast |
FunCat |
167 |
0.000 |
25 |
0.000 |
|
|
|
| photosynthesis |
FunCat |
150 |
0.000 |
22 |
0.000 |
|
|
|
| additional photosystem II components |
BioPath |
136 |
0.000 |
18 |
0.000 |
|
|
|
| Photosynthesis |
KEGG |
131 |
0.000 |
22 |
0.000 |
|
|
|
| Photosystem I |
BioPath |
121 |
0.000 |
20 |
0.000 |
|
|
|
| Chlorophyll biosynthesis and breakdown |
BioPath |
103 |
0.000 |
12 |
0.000 |
|
|
|
| Chlorophyll a/b binding proteins |
BioPath |
102 |
0.000 |
13 |
0.000 |
|
|
|
| glycolysis and gluconeogenesis |
FunCat |
101 |
0.000 |
15 |
0.016 |
|
|
|
| chlorophyll and phytochromobilin metabolism |
LitPath |
97 |
0.000 |
11 |
0.000 |
|
|
|
| Carbon fixation |
KEGG |
92 |
0.000 |
14 |
0.000 |
|
|
|
|
|
|
|
|
|
|
|
| chlorophyll biosynthesis |
AraCyc |
90 |
0.000 |
11 |
0.001 |
|
|
|
|
|
|
|
|
|
|
|
| Porphyrin and chlorophyll metabolism |
KEGG |
83 |
0.000 |
10 |
0.000 |
|
|
|
|
|
|
|
|
|
|
|
| transport |
FunCat |
81 |
0.000 |
13 |
0.000 |
|
|
|
|
|
|
|
|
|
|
|
| chlorophyll biosynthesis |
TAIR-GO |
75 |
0.000 |
8 |
0.000 |
|
|
|
|
|
|
|
|
|
|
|
| Photosystem II |
BioPath |
67 |
0.000 |
9 |
0.021 |
|
|
|
|
|
|
|
|
|
|
|
| Biosynthesis of steroids |
KEGG |
67 |
0.000 |
7 |
0.013 |
|
|
|
|
|
|
|
|
|
|
|
| photorespiration |
AraCyc |
62 |
0.000 |
12 |
0.000 |
|
|
|
|
|
|
|
|
|
|
|
| Calvin cycle |
AraCyc |
60 |
0.000 |
11 |
0.000 |
|
|
|
|
|
|
|
|
|
|
|
| Glycolysis / Gluconeogenesis |
KEGG |
58 |
0.000 |
9 |
0.039 |
|
|
|
|
|
|
|
|
|
|
|
| photosystem I |
TAIR-GO |
57 |
0.000 |
7 |
0.000 |
|
|
|
|
|
|
|
|
|
|
|
| Nitrogen metabolism |
KEGG |
56 |
0.000 |
8 |
0.000 |
|
|
|
|
|
|
|
|
|
|
|
| acetate fermentation |
AraCyc |
52 |
0.000 |
10 |
0.033 |
|
|
|
|
|
|
|
|
|
|
|
| triterpene, sterol, and brassinosteroid metabolism |
LitPath |
52 |
0.035 |
6 |
0.344 |
|
|
|
|
|
|
|
|
|
|
|
| transport facilitation |
FunCat |
51 |
0.000 |
7 |
0.000 |
|
|
|
|
|
|
|
|
|
|
|
|
|
|
|
|
|
|
|
|
|
|
|
|
|
|
|
|