|
|
|
|
|
|
|
|
|
|
|
|
|
|
|
|
|
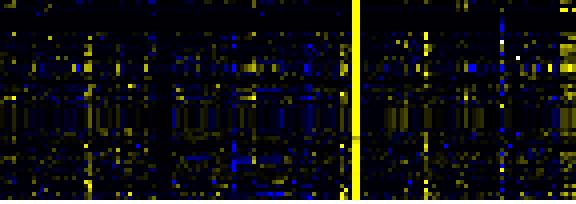
| Pathways co-expressed in the Hormone etc. data set (with more than 6 annotation points) |
|
CYP81F3 (At4g37400) |
|
|
|
|
|
|
|
|
| max. difference between log2-ratios: |
2.6 |
|
|
|
|
|
|
|
|
|
|
|
|
| max. difference between log2-ratios excluding lowest and highest 5%: |
1.7 |
|
|
|
|
|
|
|
|
|
|
|
|
| Pathway |
Source |
Scores of Genes |
p[Score] |
No. of Genes |
p[genes] |
Link to hormones etc. heatmap |
|
|
|
|
|
|
|
| tryptophan catabolism |
TAIR-GO |
10 |
0.000 |
1 |
0.000 |

|
|
|
|
|
|
| glucosinolate biosynthesis from tryptophan |
AraCyc |
10 |
0.000 |
1 |
0.000 |
|
|
|
|
|
| IAA biosynthesis |
AraCyc |
10 |
0.000 |
1 |
0.000 |
|
|
|
|
|
|
|
|
|
|
|
| IAA biosynthesis I |
AraCyc |
10 |
0.000 |
1 |
0.000 |
|
|
|
|
|
|
|
|
|
|
|
| Ascorbate and aldarate metabolism |
KEGG |
10 |
0.000 |
1 |
0.000 |
|
|
|
|
|
|
|
|
|
|
|
| Fluorene degradation |
KEGG |
10 |
0.000 |
1 |
0.000 |
|
|
|
|
|
|
|
|
|
|
|
| gamma-Hexachlorocyclohexane degradation |
KEGG |
10 |
0.000 |
1 |
0.000 |
|
|
|
|
|
|
|
|
|
|
|
| Stilbene, coumarine and lignin biosynthesis |
KEGG |
10 |
0.000 |
1 |
0.004 |
|
|
|
|
|
|
|
|
|
|
|
| Glucosinolate Metabolism |
LitPath |
10 |
0.000 |
1 |
0.000 |
|
|
|
|
|
|
|
|
|
|
|
|
|
|
|
|
|
|
|
|
|
|
|
|
|
|
|
|
|
|
|
|
|
|
|
|
|
|
|
|
|
|
|
|
|
|
|
|
|
|
|
|
|
|
|
|
|
|
|
|
|
|
| Pathways co-expressed in the Mutant data set (with more than 20 annotation points) |
|
CYP81F3 (At4g37400) |
|
|
|
|
|
|
|
|
| max. difference between log2-ratios: |
5.5 |
|
|
|
|
|
|
|
|
|
|
|
|
| max. difference between log2-ratios excluding lowest and highest 5%: |
1.7 |
|
|
|
|
|
|
|
|
|
|
|
|
| Pathway |
Source |
Scores of Genes |
p[Score] |
No. of Genes |
p[genes] |
Link to mutants heatmap |
|
|
|
|
|
|
|
| Phenylpropanoid Metabolism |
BioPath |
74 |
0.000 |
11 |
0.000 |
|
|
|
|
| Aromatic amino acid (Phe, Tyr, Trp) metabolism |
BioPath |
48 |
0.000 |
7 |
0.000 |
|
|
|
| Shikimate pathway |
LitPath |
48 |
0.000 |
7 |
0.000 |
|
|
|
| tryptophan biosynthesis |
AraCyc |
46 |
0.000 |
7 |
0.000 |
|
|
|
| Phenylpropanoid pathway |
LitPath |
46 |
0.000 |
8 |
0.005 |
|
|
|
| tryptophan biosynthesis |
TAIR-GO |
44 |
0.000 |
6 |
0.000 |
|
|
|
| Trp biosyntesis |
LitPath |
44 |
0.000 |
6 |
0.000 |
|
|
|
| Biosynthesis of Amino Acids and Derivatives |
BioPath |
38 |
0.000 |
5 |
0.126 |
|
|
|
| response to pathogenic bacteria |
TAIR-GO |
34 |
0.000 |
5 |
0.000 |
|
|
|
| lignin biosynthesis |
AraCyc |
30 |
0.000 |
5 |
0.000 |
|
|
|
| core phenylpropanoid metabolism |
BioPath |
26 |
0.000 |
4 |
0.002 |
|
|
|
| Methionin/SAM/ethylene metabolism from cysteine and aspartate |
BioPath |
26 |
0.000 |
3 |
0.003 |
|
|
|
| Lipid signaling |
AcylLipid |
26 |
0.000 |
7 |
0.053 |
|
|
|
|
|
|
|
|
|
|
|
| Benzoate degradation via CoA ligation |
KEGG |
24 |
0.000 |
5 |
0.014 |
|
|
|
|
|
|
|
|
|
|
|
| Inositol phosphate metabolism |
KEGG |
24 |
0.000 |
5 |
0.020 |
|
|
|
|
|
|
|
|
|
|
|
| Nicotinate and nicotinamide metabolism |
KEGG |
24 |
0.000 |
5 |
0.009 |
|
|
|
|
|
|
|
|
|
|
|
| Stilbene, coumarine and lignin biosynthesis |
KEGG |
23 |
0.000 |
4 |
0.069 |
|
|
|
|
|
|
|
|
|
|
|
| Phenylalanine, tyrosine and tryptophan biosynthesis |
KEGG |
22 |
0.000 |
3 |
0.015 |
|
|
|
|
|
|
|
|
|
|
|
| Propanoate metabolism |
KEGG |
22 |
0.000 |
3 |
0.004 |
|
|
|
|
|
|
|
|
|
|
|
|
|
|
|
|
|
|
|
|
|
|
|
|
|
|
|
|