|
|
|
|
|
|
|
|
|
|
|
|
|
|
|
|
|
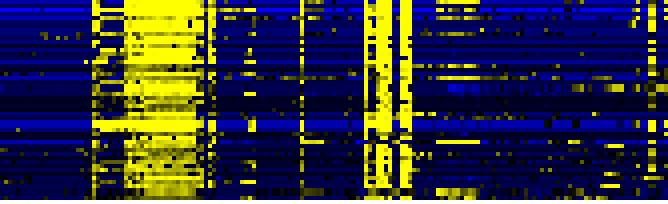
| Pathways co-expressed in the Organ and Tissue data set (with more than 10 annotation points) |
|
CYP81F4 (At4g37410) |
|
|
|
|
|
|
|
|
| max. difference between log2-ratios: |
8.3 |
|
|
|
|
|
|
|
|
|
|
|
|
| max. difference between log2-ratios excluding lowest and highest 5%: |
7.2 |
|
|
|
|
|
|
|
|
|
|
|
|
| Pathway |
Source |
Scores of Genes |
p[Score] |
No. of Genes |
p[genes] |
Link to organ heatmap |
|
|
|
|
|
|
|
| Stilbene, coumarine and lignin biosynthesis |
KEGG |
26 |
0.000 |
9 |
0.000 |
|
|
|
| Miscellaneous acyl lipid metabolism |
AcylLipid |
20 |
0.000 |
7 |
0.002 |
|
|
| monoterpenoid biosynthesis |
TAIR-GO |
19 |
0.000 |
2 |
0.000 |
|
|
| mono-/sesqui-/di-terpene biosynthesis |
LitPath |
19 |
0.000 |
2 |
0.051 |
|
|
| monoterpene biosynthesis |
LitPath |
19 |
0.000 |
2 |
0.000 |
|
|
| terpenoid metabolism |
LitPath |
19 |
0.000 |
2 |
0.055 |
|
|
| Phenylpropanoid Metabolism |
BioPath |
18 |
0.000 |
4 |
0.001 |
|
|
| triterpene, sterol, and brassinosteroid metabolism |
LitPath |
17 |
0.015 |
4 |
0.031 |
|
|
| detoxification |
FunCat |
16 |
0.000 |
5 |
0.000 |
|
|
| Methane metabolism |
KEGG |
16 |
0.000 |
8 |
0.000 |
|
|
| Phenylalanine metabolism |
KEGG |
16 |
0.000 |
8 |
0.000 |
|
|
| Prostaglandin and leukotriene metabolism |
KEGG |
16 |
0.000 |
8 |
0.000 |
|
|
| isoprenoid biosynthesis |
FunCat |
14 |
0.000 |
3 |
0.001 |
|
|
| lipid, fatty acid and isoprenoid biosynthesis |
FunCat |
14 |
0.000 |
3 |
0.000 |
|
|
|
|
|
|
|
|
|
|
|
| Biosynthesis of steroids |
KEGG |
13 |
0.000 |
2 |
0.010 |
|
|
|
|
|
|
|
|
|
|
|
| triterpene biosynthesis |
LitPath |
13 |
0.000 |
2 |
0.002 |
|
|
|
|
|
|
|
|
|
|
|
| detoxification involving cytochrome P450 |
FunCat |
12 |
0.000 |
3 |
0.000 |
|
|
|
|
|
|
|
|
|
|
|
| secondary metabolism |
FunCat |
11 |
0.000 |
4 |
0.000 |
|
|
|
|
|
|
|
|
|
|
|
|
|
|
|
|
|
|
|
|
|
|
|
|
|
|
|
|
|
|
|
|
|
|
|
|
|
|
|
|
|
|
|
|
|
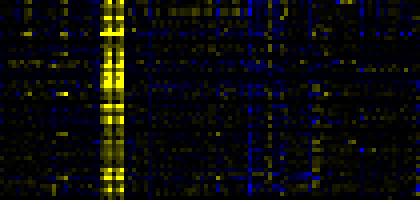
| Pathways co-expressed in the Hormone etc. data set (with more than 20 annotation points) |
|
CYP81F4 (At4g37410) |
|
|
|
|
|
|
|
|
| max. difference between log2-ratios: |
5.9 |
|
|
|
|
|
|
|
|
|
|
|
|
| max. difference between log2-ratios excluding lowest and highest 5%: |
2.4 |
|
|
|
|
|
|
|
|
|
|
|
|
| Pathway |
Source |
Scores of Genes |
p[Score] |
No. of Genes |
p[genes] |
Link to hormones etc. heatmap |
|
|
|
|
|
|
|
| Intermediary Carbon Metabolism |
BioPath |
56 |
0.000 |
10 |
0.007 |
|
|
|
|
|
|
| Biosynthesis of Amino Acids and Derivatives |
BioPath |
50 |
0.000 |
8 |
0.059 |
|
|
|
|
|
| C-compound and carbohydrate metabolism |
FunCat |
46.5 |
0.027 |
11 |
0.047 |
|
|
|
|
|
| amino acid metabolism |
FunCat |
36 |
0.000 |
5 |
0.057 |
|
|
|
|
|
| tricarboxylic-acid pathway (citrate cycle, Krebs cycle, TCA cycle) |
FunCat |
30 |
0.000 |
6 |
0.018 |
|
|
|
|
|
| Glucosinolate Metabolism |
LitPath |
30 |
0.000 |
3 |
0.001 |
|
|
|
|
|
| glycolysis and gluconeogenesis |
FunCat |
28.5 |
0.003 |
6 |
0.037 |
|
|
|
|
|
| Plastidial Isoprenoids (Chlorophylls, Carotenoids, Tocopherols, Plastoquinone, Phylloquinone) |
BioPath |
28 |
0.006 |
4 |
0.103 |
|
|
|
|
|
| formaldehyde assimilation I (serine pathway) |
AraCyc |
28 |
0.000 |
4 |
0.017 |
|
|
|
|
|
| serine-isocitrate lyase pathway |
AraCyc |
28 |
0.000 |
4 |
0.056 |
|
|
|
|
|
| TCA cycle -- aerobic respiration |
AraCyc |
28 |
0.000 |
5 |
0.021 |
|
|
|
|
|
| TCA cycle variation IV |
AraCyc |
28 |
0.000 |
5 |
0.017 |
|
|
|
|
|
| TCA cycle variation VII |
AraCyc |
28 |
0.016 |
5 |
0.106 |
|
|
|
|
|
|
|
|
|
|
|
| TCA cycle variation VIII |
AraCyc |
28 |
0.000 |
5 |
0.025 |
|
|
|
|
|
|
|
|
|
|
|
| Citrate cycle (TCA cycle) |
KEGG |
28 |
0.000 |
5 |
0.001 |
|
|
|
|
|
|
|
|
|
|
|
| Gluconeogenesis from lipids in seeds |
BioPath |
26 |
0.000 |
6 |
0.004 |
|
|
|
|
|
|
|
|
|
|
|
| gluconeogenesis |
AraCyc |
26 |
0.000 |
4 |
0.056 |
|
|
|
|
|
|
|
|
|
|
|
| phenylalanine degradation I |
AraCyc |
26 |
0.000 |
3 |
0.035 |
|
|
|
|
|
|
|
|
|
|
|
| acetate fermentation |
AraCyc |
25 |
0.006 |
4 |
0.209 |
|
|
|
|
|
|
|
|
|
|
|
| fructose degradation (anaerobic) |
AraCyc |
25 |
0.003 |
4 |
0.168 |
|
|
|
|
|
|
|
|
|
|
|
| glycolysis IV |
AraCyc |
25 |
0.003 |
4 |
0.176 |
|
|
|
|
|
|
|
|
|
|
|
| sorbitol fermentation |
AraCyc |
25 |
0.007 |
4 |
0.192 |
|
|
|
|
|
|
|
|
|
|
|
| acetyl-CoA assimilation |
AraCyc |
24 |
0.000 |
4 |
0.015 |
|
|
|
|
|
|
|
|
|
|
|
| mixed acid fermentation |
AraCyc |
24 |
0.000 |
4 |
0.022 |
|
|
|
|
|
|
|
|
|
|
|
| Methionine metabolism |
KEGG |
22 |
0.000 |
4 |
0.000 |
|
|
|
|
|
|
|
|
|
|
|
|
|
|
|
|
|
|
|
|
|
|
|
|
|
|
|
|
|
|
|
|
|
|
|
|
|
|
|
|
|
|
|
|
|
|
|
|
|
|
|
|
|
|
|
|
|
|
|
|
|
|
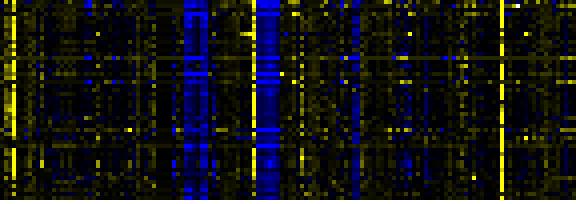
| Pathways co-expressed in the Mutant data set (with more than 40 annotation points) |
|
CYP81F4 (At4g37410) |
|
|
|
|
|
|
|
|
| max. difference between log2-ratios: |
7.1 |
|
|
|
|
|
|
|
|
|
|
|
|
| max. difference between log2-ratios excluding lowest and highest 5%: |
4.0 |
|
|
|
|
|
|
|
|
|
|
|
|
| Pathway |
Source |
Scores of Genes |
p[Score] |
No. of Genes |
p[genes] |
Link to mutants heatmap |
|
|
|
|
|
|
|
| Photosystems |
BioPath |
316 |
0.000 |
44 |
0.000 |
|
|
|
|
| additional photosystem II components |
BioPath |
140 |
0.000 |
17 |
0.000 |
|
|
|
| Chlorophyll a/b binding proteins |
BioPath |
120 |
0.000 |
15 |
0.000 |
|
|
|
| C-compound and carbohydrate metabolism |
FunCat |
119 |
0.000 |
16 |
0.073 |
|
|
|
| Photosystem I |
BioPath |
116 |
0.000 |
19 |
0.000 |
|
|
|
| glycolysis and gluconeogenesis |
FunCat |
109 |
0.000 |
14 |
0.000 |
|
|
|
| Intermediary Carbon Metabolism |
BioPath |
108 |
0.000 |
15 |
0.198 |
|
|
|
| Photosynthesis |
KEGG |
106 |
0.000 |
16 |
0.000 |
|
|
|
| biogenesis of chloroplast |
FunCat |
85 |
0.000 |
13 |
0.000 |
|
|
|
| photosynthesis |
FunCat |
85 |
0.000 |
11 |
0.000 |
|
|
|
| Carbon fixation |
KEGG |
73 |
0.000 |
10 |
0.000 |
|
|
|
| Photosystem II |
BioPath |
68 |
0.000 |
9 |
0.001 |
|
|
|
| transport |
FunCat |
66 |
0.000 |
9 |
0.000 |
|
|
|
|
|
|
|
|
|
|
|
| chlorophyll binding |
TAIR-GO |
58 |
0.000 |
7 |
0.000 |
|
|
|
|
|
|
|
|
|
|
|
| photosystem I |
TAIR-GO |
58 |
0.000 |
7 |
0.000 |
|
|
|
|
|
|
|
|
|
|
|
| acetate fermentation |
AraCyc |
58 |
0.000 |
9 |
0.001 |
|
|
|
|
|
|
|
|
|
|
|
| fructose degradation (anaerobic) |
AraCyc |
58 |
0.000 |
9 |
0.001 |
|
|
|
|
|
|
|
|
|
|
|
| glycolysis I |
AraCyc |
58 |
0.000 |
9 |
0.077 |
|
|
|
|
|
|
|
|
|
|
|
| glycolysis IV |
AraCyc |
58 |
0.000 |
9 |
0.001 |
|
|
|
|
|
|
|
|
|
|
|
| sorbitol fermentation |
AraCyc |
58 |
0.000 |
9 |
0.001 |
|
|
|
|
|
|
|
|
|
|
|
| Gluconeogenesis from lipids in seeds |
BioPath |
54 |
0.002 |
8 |
0.095 |
|
|
|
|
|
|
|
|
|
|
|
| gluconeogenesis |
AraCyc |
54 |
0.000 |
8 |
0.000 |
|
|
|
|
|
|
|
|
|
|
|
| Glycolysis / Gluconeogenesis |
KEGG |
54 |
0.000 |
8 |
0.002 |
|
|
|
|
|
|
|
|
|
|
|
| photosystem II |
TAIR-GO |
50 |
0.000 |
6 |
0.000 |
|
|
|
|
|
|
|
|
|
|
|
| glycerol degradation II |
AraCyc |
48 |
0.000 |
7 |
0.001 |
|
|
|
|
|
|
|
|
|
|
|
| respiration |
FunCat |
44 |
0.000 |
6 |
0.000 |
|
|
|
|
|
|
|
|
|
|
|
| photosynthesis |
TAIR-GO |
42 |
0.000 |
6 |
0.000 |
|
|
|
|
|
|
|
|
|
|
|
| Calvin cycle |
AraCyc |
42 |
0.000 |
6 |
0.002 |
|
|
|
|
|
|
|
|
|
|
|
| glyceraldehyde 3-phosphate degradation |
AraCyc |
42 |
0.000 |
6 |
0.000 |
|
|
|
|
|
|
|
|
|
|
|
|
|
|
|
|
|
|
|
|
|
|
|
|
|
|
|
|