| _________________________________________ |
|
|
|
|
|
|
|
|

|
|
|
|
|
|
|
| Pathways co-expressed in the 2 data sets with co-expressed pathways (with more than 6 annotation points each) |
|
Find below a list of pathways that are co-expressed with the bait. First a list of pathways is given that are co-expressed in all data sets. Lists for each individual dataset are shown underneath. Depending on the number of co-expressed pathways only the top scoring pathways are given; all data can be saved as text using the link above. |
|
|
|
|
|
|
| Pathway |
Source |
Sum of scores |
Sum of genes |
|
|
|
|
|
|
|
| mono-/sesqui-/di-terpene biosynthesis |
LitPath |
72 |
9 |
|
|
|
|
|
|
|
| terpenoid metabolism |
LitPath |
72 |
9 |
|
|
|
|
|
|
|
|
|
| jasmonic acid biosynthesis |
AraCyc |
50 |
5 |
|
|
|
|
|
|
|
|
|
| jasmonic acid biosynthesis |
AraCyc |
50 |
5 |
|
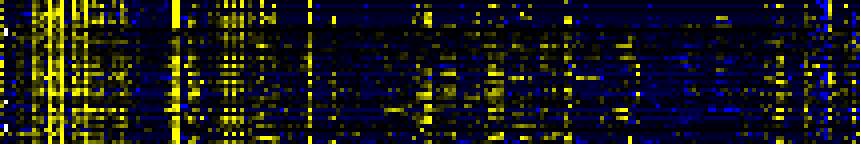
To the right of each table a thumbnail of the actual co-expression heatmap is given. Klick on the link to see the heatmap containing all co-expressed genes. |
|
|
|
|
|
|
|
|
| monoterpene biosynthesis |
AraCyc |
50 |
5 |
|
|
|
|
|
|
|
|
|
| monoterpene biosynthesis |
AraCyc |
50 |
5 |
|
|
|
|
|
|
|
|
|
| Phenylpropanoid Metabolism |
BioPath |
36 |
6 |
|
For more information on how these pathway maps were generated please read the methods page |
|
|
|
|
|
|
|
|
| core phenylpropanoid metabolism |
BioPath |
34 |
5 |
|
|
|
|
|
|
|
|
|
| Phenylpropanoid pathway |
LitPath |
34 |
5 |
|
|
|
|
|
|
|
|
|
|
|
|
|
| response to wounding |
TAIR-GO |
30 |
3 |
|
|
|
|
|
|
|
|
|
|
|
|
|
| biogenesis of cell wall |
FunCat |
28 |
9 |
|
|
|
|
|
|
|
|
|
|
|
|
|
| fatty acid metabolism |
TAIR-GO |
23 |
3 |
|
|
|
|
|
|
|
|
|
|
|
|
|
| jasmonic acid mediated signaling pathway |
TAIR-GO |
20 |
2 |
|
|
|
|
|
|
|
|
|
|
|
|
|
| jasmonic acid metabolism |
TAIR-GO |
20 |
2 |
|
|
|
|
|
|
|
|
|
|
|
|
|
| monoterpenoid biosynthesis |
TAIR-GO |
20 |
2 |
|
|
|
|
|
|
|
|
|
|
|
|
|
| N-terminal protein myristoylation |
TAIR-GO |
19 |
2 |
|
|
|
|
|
|
|
|
|
|
|
|
|
|
|
|
|
|
|
|
|
|
|
|
|
|
|
|
|
|
|
|
|
|
|
|
|
|
|
|
|
|
|
|
|
|
|
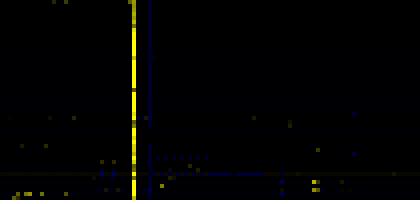
| Pathways co-expressed in the Stress data set ( with more than 10 annotation points) |
|
CYP82G1 (At3g25180) |
|
|
|
|
|
|
|
|
| max. difference between log2-ratios: |
10.0 |
|
|
|
|
|
|
|
|
|
|
|
|
| max. difference between log2-ratios excluding lowest and highest 5%: |
2.7 |
|
|
|
|
|
|
|
|
|
|
|
|
| Pathway |
Source |
Scores of Genes |
p[Score] |
No. of Genes |
p[genes] |
Link to stress heatmap |
|
|
|
|
|
|
|
| amino acid metabolism |
FunCat |
24 |
0.000 |
3 |
0.011 |
|
| Gluconeogenesis from lipids in seeds |
BioPath |
20 |
0.000 |
2 |
0.010 |
| response to wounding |
TAIR-GO |
20 |
0.000 |
2 |
0.001 |
| jasmonic acid biosynthesis |
AraCyc |
20 |
0.000 |
2 |
0.001 |
| Lipid signaling |
AcylLipid |
20 |
0.000 |
2 |
0.168 |
| Nicotinate and nicotinamide metabolism |
KEGG |
18 |
0.000 |
2 |
0.042 |
| mono-/sesqui-/di-terpene biosynthesis |
LitPath |
18 |
0.000 |
3 |
0.001 |
| terpenoid metabolism |
LitPath |
18 |
0.000 |
3 |
0.001 |
| Phenylpropanoid Metabolism |
BioPath |
14 |
0.002 |
3 |
0.026 |
| biosynthesis of derivatives of homoisopentenyl pyrophosphate |
FunCat |
14 |
0.000 |
2 |
0.000 |
|
|
|
|
|
|
|
|
|
|
|
| Carbon fixation |
KEGG |
14 |
0.000 |
2 |
0.023 |
|
|
|
|
|
|
|
|
|
|
|
| core phenylpropanoid metabolism |
BioPath |
12 |
0.000 |
2 |
0.003 |
|
|
|
|
|
|
|
|
|
|
|
| biogenesis of cell wall |
FunCat |
12 |
0.000 |
2 |
0.017 |
|
|
|
|
|
|
|
|
|
|
|
| Phenylalanine metabolism |
KEGG |
12 |
0.000 |
2 |
0.049 |
|
|
|
|
|
|
|
|
|
|
|
| Phenylpropanoid pathway |
LitPath |
12 |
0.007 |
2 |
0.126 |
|
|
|
|
|
|
|
|
|
|
|
|
|
|
|
|
|
|
|
|
|
|
|
|
|
|
|
|
|
|
|
|
|
|
|
|
|
|
|
|
|
|
|
|
|
| Pathways co-expressed in the Hormone etc. data set (with more than 10 annotation points) |
|
CYP82G1 (At3g25180) |
|
|
|
|
|
|
|
|
| max. difference between log2-ratios: |
2.3 |
|
|
|
|
|
|
|
|
|
|
|
|
| max. difference between log2-ratios excluding lowest and highest 5%: |
0.0 |
|
|
|
|
|
|
|
|
|
|
|
|
| Pathway |
Source |
Scores of Genes |
p[Score] |
No. of Genes |
p[genes] |
Link to hormones etc. heatmap |
|
|
|
|
|
|
|
| Cell Wall Carbohydrate Metabolism |
BioPath |
97 |
0.000 |
25 |
0.000 |
|
|
|
|
|
|
| pectin metabolism |
BioPath |
75 |
0.000 |
21 |
0.000 |
|
|
|
|
|
| mono-/sesqui-/di-terpene biosynthesis |
LitPath |
54 |
0.000 |
6 |
0.000 |
|
|
|
|
|
| terpenoid metabolism |
LitPath |
54 |
0.000 |
6 |
0.000 |
|
|
|
|
|
| Miscellaneous acyl lipid metabolism |
AcylLipid |
46 |
0.000 |
17 |
0.000 |
|
|
|
|
|
| Starch and sucrose metabolism |
KEGG |
42 |
0.000 |
6 |
0.000 |
|
|
|
|
|
| core phenylpropanoid metabolism |
BioPath |
22 |
0.000 |
3 |
0.014 |
|
|
|
|
|
| Phenylpropanoid Metabolism |
BioPath |
22 |
0.026 |
3 |
0.497 |
|
|
|
|
|
| Phenylpropanoid pathway |
LitPath |
22 |
0.043 |
3 |
0.247 |
|
|
|
|
|
| sexual reproduction |
TAIR-GO |
20 |
0.000 |
5 |
0.000 |
|
|
|
|
|
| monoterpene biosynthesis |
LitPath |
20 |
0.000 |
2 |
0.000 |
|
|
|
|
|
| Fatty acid elongation and wax and cutin metabolism |
AcylLipid |
19 |
0.001 |
5 |
0.056 |
|
|
|
|
|
| sucrose metabolism |
BioPath |
16 |
0.000 |
2 |
0.007 |
|
|
|
|
|
|
|
|
|
|
|
| biogenesis of cell wall |
FunCat |
16 |
0.000 |
7 |
0.000 |
|
|
|
|
|
|
|
|
|
|
|
| Galactose metabolism |
KEGG |
16 |
0.000 |
2 |
0.003 |
|
|
|
|
|
|
|
|
|
|
|
| C-compound and carbohydrate utilization |
FunCat |
14 |
0.000 |
2 |
0.000 |
|
|
|
|
|
|
|
|
|
|
|
| fatty acid metabolism |
TAIR-GO |
13 |
0.000 |
2 |
0.002 |
|
|
|
|
|
|
|
|
|
|
|
| Oxidative phosphorylation |
KEGG |
12 |
0.000 |
3 |
0.006 |
|
|
|
|
|
|
|
|
|
|
|
|
|
|
|
|
|
|
|
|
|
|
|
|
|
|
|
|