| _________________________________________ |
|
|
|
|
|
|
|
|

|
|
|
|
|
|
|
| Pathways co-expressed in all 4 data sets (with more than 6 annotation points each) |
|
Find below a list of pathways that are co-expressed with the bait. First a list of pathways is given that are co-expressed in all data sets. Lists for each individual dataset are shown underneath. Depending on the number of co-expressed pathways only the top scoring pathways are given; all data can be saved as text using the link above. |
|
|
|
|
|
|
| Pathway |
Source |
Sum of scores |
Sum of genes |
|
|
|
|
|
|
|
| Glucosinolate Metabolism |
LitPath |
330 |
33 |
|
|
|
|
|
|
|
| Branched-chain amino acids from aspartate |
BioPath |
216 |
34 |
|
|
|
|
|
|
|
|
|
| leucine biosynthesis |
AraCyc |
196 |
30 |
|
|
|
|
|
|
|
|
|
| glucosinolate biosynthesis |
TAIR-GO |
170 |
17 |
|
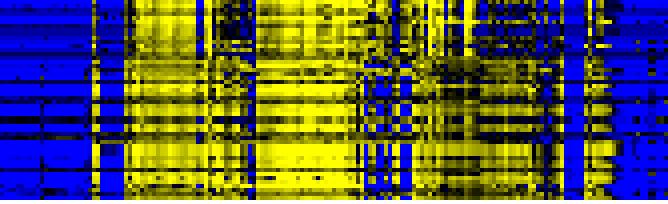
To the right of each table a thumbnail of the actual co-expression heatmap is given. Klick on the link to see the heatmap containing all co-expressed genes. |
|
|
|
|
|
|
|
|
| leucine biosynthesis |
TAIR-GO |
166 |
25 |
|
|
|
|
|
|
|
|
|
| Valine, leucine and isoleucine biosynthesis |
KEGG |
162 |
23 |
|
|
|
|
|
|
|
|
|
| glucosinolate biosynthesis from homomethionine |
AraCyc |
130 |
13 |
|
For more information on how these pathway maps were generated please read the methods page |
|
|
|
|
|
|
|
|
| gamma-Hexachlorocyclohexane degradation |
KEGG |
58 |
7 |
|
|
|
|
|
|
|
|
|
| response to UV |
TAIR-GO |
50 |
5 |
|
|
|
|
|
|
|
|
|
|
|
|
|
| glucosinolate biosynthesis from phenylalanine |
AraCyc |
50 |
5 |
|
|
|
|
|
|
|
|
|
|
|
|
|
| cellulose biosynthesis |
TAIR-GO |
49 |
8 |
|
|
|
|
|
|
|
|
|
|
|
|
|
| homomethionine biosynthesis |
AraCyc |
40 |
4 |
|
|
|
|
|
|
|
|
|
|
|
|
|
|
|
|
|
|
|
|
|
|
|
|
|
|
|
|
|
|
|
|
|
|
|
|
|
|
|
|
|
|
|
|
|
|
|
| Pathways co-expressed in the Organ and Tissue data set (with more than 39 annotation points) |
|
CYP83A1 (At4g13770) |
|
|
|
|
|
|
|
|
| max. difference between log2-ratios: |
7.9 |
|
|
|
|
|
|
|
|
|
|
|
|
| max. difference between log2-ratios excluding lowest and highest 5%: |
7.2 |
|
|
|
|
|
|
|
|
|
|
|
|
| Pathway |
Source |
Scores of Genes |
p[Score] |
No. of Genes |
p[genes] |
Link to organ heatmap |
|
|
|
|
|
|
|
| Photosystems |
BioPath |
385 |
0.000 |
57 |
0.000 |
|
|
|
| Plastidial Isoprenoids (Chlorophylls, Carotenoids, Tocopherols, Plastoquinone, Phylloquinone) |
BioPath |
185 |
0.000 |
22 |
0.001 |
|
|
| additional photosystem II components |
BioPath |
158 |
0.000 |
22 |
0.000 |
|
|
| C-compound and carbohydrate metabolism |
FunCat |
154 |
0.000 |
27 |
0.044 |
|
|
| photosynthesis |
FunCat |
154 |
0.000 |
24 |
0.000 |
|
|
| biogenesis of chloroplast |
FunCat |
149 |
0.000 |
22 |
0.000 |
|
|
| Photosynthesis |
KEGG |
149 |
0.000 |
26 |
0.000 |
|
|
| Photosystem I |
BioPath |
141 |
0.000 |
23 |
0.000 |
|
|
| Chlorophyll a/b binding proteins |
BioPath |
138 |
0.000 |
17 |
0.000 |
|
|
| Glucosinolate Metabolism |
LitPath |
130 |
0.000 |
13 |
0.000 |
|
|
| glycolysis and gluconeogenesis |
FunCat |
119 |
0.000 |
19 |
0.000 |
|
|
| Carbon fixation |
KEGG |
110 |
0.000 |
16 |
0.000 |
|
|
| Chlorophyll biosynthesis and breakdown |
BioPath |
101 |
0.000 |
12 |
0.000 |
|
|
| chlorophyll and phytochromobilin metabolism |
LitPath |
95 |
0.000 |
11 |
0.000 |
|
|
|
|
|
|
|
|
|
|
|
| Porphyrin and chlorophyll metabolism |
KEGG |
91 |
0.000 |
11 |
0.000 |
|
|
|
|
|
|
|
|
|
|
|
| transport |
FunCat |
84 |
0.000 |
14 |
0.000 |
|
|
|
|
|
|
|
|
|
|
|
| chlorophyll biosynthesis |
AraCyc |
80 |
0.000 |
11 |
0.004 |
|
|
|
|
|
|
|
|
|
|
|
| photosystem I |
TAIR-GO |
77 |
0.000 |
9 |
0.000 |
|
|
|
|
|
|
|
|
|
|
|
| Calvin cycle |
AraCyc |
76 |
0.000 |
12 |
0.000 |
|
|
|
|
|
|
|
|
|
|
|
| Photosystem II |
BioPath |
73 |
0.000 |
10 |
0.015 |
|
|
|
|
|
|
|
|
|
|
|
| chlorophyll binding |
TAIR-GO |
70 |
0.000 |
8 |
0.000 |
|
|
|
|
|
|
|
|
|
|
|
| chlorophyll biosynthesis |
TAIR-GO |
65 |
0.000 |
7 |
0.000 |
|
|
|
|
|
|
|
|
|
|
|
| sulfate assimilation III |
AraCyc |
65 |
0.000 |
7 |
0.012 |
|
|
|
|
|
|
|
|
|
|
|
| acetate fermentation |
AraCyc |
62 |
0.000 |
11 |
0.030 |
|
|
|
|
|
|
|
|
|
|
|
| fructose degradation (anaerobic) |
AraCyc |
60 |
0.000 |
10 |
0.040 |
|
|
|
|
|
|
|
|
|
|
|
| glycolysis IV |
AraCyc |
60 |
0.000 |
10 |
0.044 |
|
|
|
|
|
|
|
|
|
|
|
| sorbitol fermentation |
AraCyc |
60 |
0.000 |
10 |
0.053 |
|
|
|
|
|
|
|
|
|
|
|
| Selenoamino acid metabolism |
KEGG |
60 |
0.000 |
6 |
0.002 |
|
|
|
|
|
|
|
|
|
|
|
| Sulfur metabolism |
KEGG |
60 |
0.000 |
6 |
0.000 |
|
|
|
|
|
|
|
|
|
|
|
| Glycolysis / Gluconeogenesis |
KEGG |
58 |
0.000 |
9 |
0.015 |
|
|
|
|
|
|
|
|
|
|
|
| Biosynthesis of steroids |
KEGG |
54 |
0.000 |
6 |
0.018 |
|
|
|
|
|
|
|
|
|
|
|
| Pentose phosphate pathway |
KEGG |
54 |
0.000 |
8 |
0.001 |
|
|
|
|
|
|
|
|
|
|
|
| gluconeogenesis |
AraCyc |
52 |
0.000 |
8 |
0.028 |
|
|
|
|
|
|
|
|
|
|
|
| photorespiration |
AraCyc |
52 |
0.000 |
11 |
0.000 |
|
|
|
|
|
|
|
|
|
|
|
| photosystem II |
TAIR-GO |
51 |
0.000 |
6 |
0.000 |
|
|
|
|
|
|
|
|
|
|
|
| glucosinolate biosynthesis |
TAIR-GO |
50 |
0.000 |
5 |
0.000 |
|
|
|
|
|
|
|
|
|
|
|
| chlorophyll biosynthesis |
LitPath |
49 |
0.000 |
5 |
0.000 |
|
|
|
|
|
|
|
|
|
|
|
| light harvesting complex |
BioPath |
48 |
0.000 |
6 |
0.000 |
|
|
|
|
|
|
|
|
|
|
|
| Branched-chain amino acids from aspartate |
BioPath |
46 |
0.000 |
7 |
0.017 |
|
|
|
|
|
|
|
|
|
|
|
| transport facilitation |
FunCat |
46 |
0.000 |
8 |
0.000 |
|
|
|
|
|
|
|
|
|
|
|
| photosynthesis |
TAIR-GO |
44 |
0.000 |
6 |
0.004 |
|
|
|
|
|
|
|
|
|
|
|
| energy |
FunCat |
44 |
0.000 |
6 |
0.000 |
|
|
|
|
|
|
|
|
|
|
|
| respiration |
FunCat |
44 |
0.000 |
6 |
0.000 |
|
|
|
|
|
|
|
|
|
|
|
| glucosinolate biosynthesis from homomethionine |
AraCyc |
40 |
0.000 |
4 |
0.000 |
|
|
|
|
|
|
|
|
|
|
|
| leucine biosynthesis |
AraCyc |
40 |
0.000 |
6 |
0.000 |
|
|
|
|
|
|
|
|
|
|
|
| aerobic respiration |
FunCat |
40 |
0.000 |
5 |
0.001 |
|
|
|
|
|
|
|
|
|
|
|
|
|
|
|
|
|
|
|
|
|
|
|
|
|
|
|
|
|
|
|
|
|
|
|
|
|
|
|
|
|
|
|
|
|
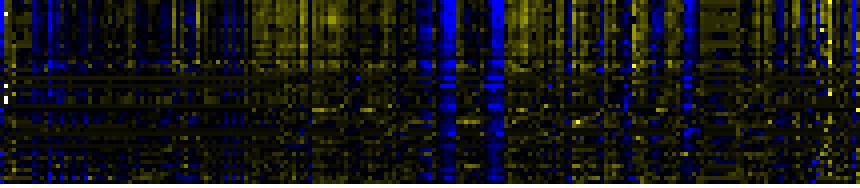
| Pathways co-expressed in the Stress data set ( with more than 10 annotation points) |
|
CYP83A1 (At4g13770) |
|
|
|
|
|
|
|
|
| max. difference between log2-ratios: |
10.2 |
|
|
|
|
|
|
|
|
|
|
|
|
| max. difference between log2-ratios excluding lowest and highest 5%: |
3.2 |
|
|
|
|
|
|
|
|
|
|
|
|
| Pathway |
Source |
Scores of Genes |
p[Score] |
No. of Genes |
p[genes] |
Link to stress heatmap |
|
|
|
|
|
|
|
| Biosynthesis of Amino Acids and Derivatives |
BioPath |
80 |
0.000 |
12 |
0.000 |
|
| Glucosinolate Metabolism |
LitPath |
60 |
0.000 |
6 |
0.000 |
| Branched-chain amino acids from aspartate |
BioPath |
58 |
0.000 |
9 |
0.000 |
| leucine biosynthesis |
AraCyc |
42 |
0.000 |
7 |
0.000 |
| Valine, leucine and isoleucine biosynthesis |
KEGG |
42 |
0.000 |
6 |
0.000 |
| glucosinolate biosynthesis |
TAIR-GO |
40 |
0.000 |
4 |
0.000 |
| glucosinolate biosynthesis from homomethionine |
AraCyc |
30 |
0.000 |
3 |
0.000 |
| amino acid metabolism |
FunCat |
30 |
0.000 |
4 |
0.001 |
| Pyruvate metabolism |
KEGG |
30 |
0.000 |
3 |
0.017 |
| TCA cycle -- aerobic respiration |
AraCyc |
24 |
0.000 |
4 |
0.002 |
| TCA cycle variation VII |
AraCyc |
24 |
0.000 |
4 |
0.011 |
| TCA cycle variation VIII |
AraCyc |
24 |
0.000 |
4 |
0.002 |
| TCA cycle variation IV |
AraCyc |
22 |
0.000 |
3 |
0.011 |
|
|
|
|
|
|
|
|
|
|
|
| C-compound and carbohydrate metabolism |
FunCat |
22 |
0.000 |
3 |
0.139 |
|
|
|
|
|
|
|
|
|
|
|
| Glycan Biosynthesis and Metabolism |
KEGG |
18 |
0.000 |
2 |
0.056 |
|
|
|
|
|
|
|
|
|
|
|
| aspartate degradation I |
AraCyc |
16 |
0.000 |
2 |
0.013 |
|
|
|
|
|
|
|
|
|
|
|
| aspartate degradation II |
AraCyc |
16 |
0.000 |
2 |
0.003 |
|
|
|
|
|
|
|
|
|
|
|
| Carbon fixation |
KEGG |
16 |
0.001 |
2 |
0.060 |
|
|
|
|
|
|
|
|
|
|
|
| Cysteine metabolism |
KEGG |
16 |
0.000 |
2 |
0.006 |
|
|
|
|
|
|
|
|
|
|
|
| Glutamate metabolism |
KEGG |
16 |
0.000 |
2 |
0.021 |
|
|
|
|
|
|
|
|
|
|
|
| cellulose biosynthesis |
BioPath |
14 |
0.000 |
2 |
0.042 |
|
|
|
|
|
|
|
|
|
|
|
| Glycine, serine and threonine metabolism |
KEGG |
14 |
0.000 |
2 |
0.013 |
|
|
|
|
|
|
|
|
|
|
|
| acetyl-CoA assimilation |
AraCyc |
12 |
0.001 |
2 |
0.024 |
|
|
|
|
|
|
|
|
|
|
|
| glyoxylate cycle |
AraCyc |
12 |
0.000 |
2 |
0.010 |
|
|
|
|
|
|
|
|
|
|
|
| serine-isocitrate lyase pathway |
AraCyc |
12 |
0.009 |
2 |
0.057 |
|
|
|
|
|
|
|
|
|
|
|
| tricarboxylic-acid pathway (citrate cycle, Krebs cycle, TCA cycle) |
FunCat |
12 |
0.000 |
2 |
0.041 |
|
|
|
|
|
|
|
|
|
|
|
| Stilbene, coumarine and lignin biosynthesis |
KEGG |
12 |
0.026 |
2 |
0.157 |
|
|
|
|
|
|
|
|
|
|
|
|
|
|
|
|
|
|
|
|
|
|
|
|
|
|
|
|
|
|
|
|
|
|
|
|
|
|
|
|
|
|
|
|
|
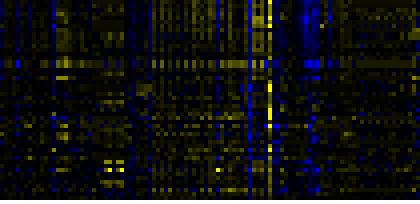
| Pathways co-expressed in the Hormone etc. data set (with more than 10 annotation points) |
|
CYP83A1 (At4g13770) |
|
|
|
|
|
|
|
|
| max. difference between log2-ratios: |
5.5 |
|
|
|
|
|
|
|
|
|
|
|
|
| max. difference between log2-ratios excluding lowest and highest 5%: |
1.6 |
|
|
|
|
|
|
|
|
|
|
|
|
| Pathway |
Source |
Scores of Genes |
p[Score] |
No. of Genes |
p[genes] |
Link to hormones etc. heatmap |
|
|
|
|
|
|
|
| Biosynthesis of Amino Acids and Derivatives |
BioPath |
82 |
0.000 |
13 |
0.000 |
|
|
|
|
|
|
| Glucosinolate Metabolism |
LitPath |
70 |
0.000 |
7 |
0.000 |
|
|
|
|
|
| Branched-chain amino acids from aspartate |
BioPath |
64 |
0.000 |
10 |
0.000 |
|
|
|
|
|
| leucine biosynthesis |
AraCyc |
42 |
0.000 |
7 |
0.000 |
|
|
|
|
|
| Valine, leucine and isoleucine biosynthesis |
KEGG |
42 |
0.000 |
6 |
0.000 |
|
|
|
|
|
| glucosinolate biosynthesis |
TAIR-GO |
40 |
0.000 |
4 |
0.000 |
|
|
|
|
|
| Pyruvate metabolism |
KEGG |
32 |
0.000 |
5 |
0.003 |
|
|
|
|
|
| glucosinolate biosynthesis from homomethionine |
AraCyc |
30 |
0.000 |
3 |
0.000 |
|
|
|
|
|
| amino acid metabolism |
FunCat |
30 |
0.000 |
5 |
0.001 |
|
|
|
|
|
| Glycine, serine and threonine metabolism |
KEGG |
26 |
0.000 |
4 |
0.001 |
|
|
|
|
|
| Stilbene, coumarine and lignin biosynthesis |
KEGG |
26 |
0.000 |
5 |
0.012 |
|
|
|
|
|
| Flavonoid and anthocyanin metabolism |
BioPath |
20 |
0.000 |
2 |
0.096 |
|
|
|
|
|
| formylTHF biosynthesis |
AraCyc |
20 |
0.000 |
3 |
0.001 |
|
|
|
|
|
|
|
|
|
|
|
| photorespiration |
AraCyc |
20 |
0.000 |
3 |
0.013 |
|
|
|
|
|
|
|
|
|
|
|
| Ascorbate and aldarate metabolism |
KEGG |
20 |
0.000 |
2 |
0.012 |
|
|
|
|
|
|
|
|
|
|
|
| Fluorene degradation |
KEGG |
20 |
0.000 |
2 |
0.003 |
|
|
|
|
|
|
|
|
|
|
|
| gamma-Hexachlorocyclohexane degradation |
KEGG |
20 |
0.000 |
2 |
0.004 |
|
|
|
|
|
|
|
|
|
|
|
| development |
TAIR-GO |
19 |
0.000 |
2 |
0.014 |
|
|
|
|
|
|
|
|
|
|
|
| Glutathione metabolism |
BioPath |
18 |
0.002 |
3 |
0.047 |
|
|
|
|
|
|
|
|
|
|
|
| TCA cycle -- aerobic respiration |
AraCyc |
18 |
0.000 |
4 |
0.009 |
|
|
|
|
|
|
|
|
|
|
|
| TCA cycle variation VII |
AraCyc |
18 |
0.008 |
4 |
0.043 |
|
|
|
|
|
|
|
|
|
|
|
| TCA cycle variation VIII |
AraCyc |
18 |
0.000 |
4 |
0.011 |
|
|
|
|
|
|
|
|
|
|
|
| serine-isocitrate lyase pathway |
AraCyc |
16 |
0.001 |
4 |
0.007 |
|
|
|
|
|
|
|
|
|
|
|
| TCA cycle variation IV |
AraCyc |
16 |
0.000 |
3 |
0.034 |
|
|
|
|
|
|
|
|
|
|
|
| Glutamate metabolism |
KEGG |
16 |
0.000 |
2 |
0.051 |
|
|
|
|
|
|
|
|
|
|
|
| formaldehyde assimilation I (serine pathway) |
AraCyc |
14 |
0.000 |
3 |
0.012 |
|
|
|
|
|
|
|
|
|
|
|
| Miscellaneous acyl lipid metabolism |
AcylLipid |
14 |
0.034 |
7 |
0.004 |
|
|
|
|
|
|
|
|
|
|
|
| Gluconeogenesis from lipids in seeds |
BioPath |
13 |
0.046 |
2 |
0.153 |
|
|
|
|
|
|
|
|
|
|
|
| isoleucine degradation I |
AraCyc |
13 |
0.000 |
2 |
0.027 |
|
|
|
|
|
|
|
|
|
|
|
| isoleucine degradation III |
AraCyc |
13 |
0.000 |
2 |
0.004 |
|
|
|
|
|
|
|
|
|
|
|
| leucine degradation I |
AraCyc |
13 |
0.000 |
2 |
0.027 |
|
|
|
|
|
|
|
|
|
|
|
| leucine degradation II |
AraCyc |
13 |
0.000 |
2 |
0.004 |
|
|
|
|
|
|
|
|
|
|
|
| valine degradation I |
AraCyc |
13 |
0.000 |
2 |
0.066 |
|
|
|
|
|
|
|
|
|
|
|
| valine degradation II |
AraCyc |
13 |
0.000 |
2 |
0.010 |
|
|
|
|
|
|
|
|
|
|
|
| ascorbate glutathione cycle |
AraCyc |
12 |
0.000 |
2 |
0.009 |
|
|
|
|
|
|
|
|
|
|
|
| Glutathione metabolism |
KEGG |
12 |
0.002 |
2 |
0.048 |
|
|
|
|
|
|
|
|
|
|
|
| Methane metabolism |
KEGG |
12 |
0.001 |
4 |
0.020 |
|
|
|
|
|
|
|
|
|
|
|
| Phenylalanine metabolism |
KEGG |
12 |
0.012 |
4 |
0.026 |
|
|
|
|
|
|
|
|
|
|
|
| detoxification |
FunCat |
11 |
0.000 |
2 |
0.000 |
|
|
|
|
|
|
|
|
|
|
|
| detoxification involving cytochrome P450 |
FunCat |
11 |
0.000 |
2 |
0.000 |
|
|
|
|
|
|
|
|
|
|
|
|
|
|
|
|
|
|
|
|
|
|
|
|
|
|
|
|
|
|
|
|
|
|
|
|
|
|
|
|
|
|
|
|
|
|
|
|
|
|
|
|
|
|
|
|
|
|
|
|
|
|
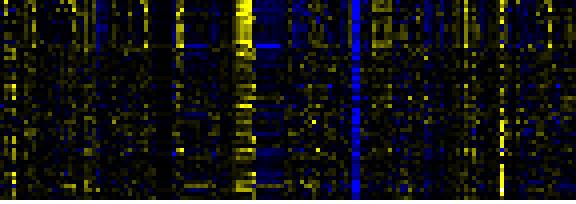
| Pathways co-expressed in the Mutant data set (with more than 20 annotation points) |
|
CYP83A1 (At4g13770) |
|
|
|
|
|
|
|
|
| max. difference between log2-ratios: |
10.2 |
|
|
|
|
|
|
|
|
|
|
|
|
| max. difference between log2-ratios excluding lowest and highest 5%: |
2.9 |
|
|
|
|
|
|
|
|
|
|
|
|
| Pathway |
Source |
Scores of Genes |
p[Score] |
No. of Genes |
p[genes] |
Link to mutants heatmap |
|
|
|
|
|
|
|
| Biosynthesis of Amino Acids and Derivatives |
BioPath |
116 |
0.000 |
16 |
0.000 |
|
|
|
|
| Glucosinolate Metabolism |
LitPath |
70 |
0.000 |
7 |
0.000 |
|
|
|
| amino acid metabolism |
FunCat |
66 |
0.000 |
8 |
0.000 |
|
|
|
| Pyruvate metabolism |
KEGG |
62 |
0.000 |
7 |
0.001 |
|
|
|
| Branched-chain amino acids from aspartate |
BioPath |
48 |
0.000 |
8 |
0.000 |
|
|
|
| C-compound and carbohydrate metabolism |
FunCat |
46 |
0.001 |
7 |
0.080 |
|
|
|
| leucine biosynthesis |
AraCyc |
42 |
0.000 |
7 |
0.000 |
|
|
|
| Valine, leucine and isoleucine biosynthesis |
KEGG |
42 |
0.000 |
6 |
0.000 |
|
|
|
| glucosinolate biosynthesis |
TAIR-GO |
40 |
0.000 |
4 |
0.000 |
|
|
|
| sulfate assimilation III |
AraCyc |
40 |
0.000 |
4 |
0.005 |
|
|
|
| Cysteine metabolism |
KEGG |
36 |
0.000 |
4 |
0.001 |
|
|
|
| Oxidative phosphorylation |
KEGG |
31 |
0.000 |
5 |
0.013 |
|
|
|
| glucosinolate biosynthesis from homomethionine |
AraCyc |
30 |
0.000 |
3 |
0.000 |
|
|
|
|
|
|
|
|
|
|
|
| TCA cycle -- aerobic respiration |
AraCyc |
30 |
0.000 |
5 |
0.005 |
|
|
|
|
|
|
|
|
|
|
|
| TCA cycle variation VII |
AraCyc |
30 |
0.000 |
5 |
0.031 |
|
|
|
|
|
|
|
|
|
|
|
| TCA cycle variation VIII |
AraCyc |
30 |
0.000 |
5 |
0.006 |
|
|
|
|
|
|
|
|
|
|
|
| Selenoamino acid metabolism |
KEGG |
30 |
0.000 |
3 |
0.008 |
|
|
|
|
|
|
|
|
|
|
|
| Sulfur metabolism |
KEGG |
30 |
0.000 |
3 |
0.003 |
|
|
|
|
|
|
|
|
|
|
|
| Glutathione metabolism |
BioPath |
28 |
0.000 |
4 |
0.021 |
|
|
|
|
|
|
|
|
|
|
|
| TCA cycle variation IV |
AraCyc |
28 |
0.000 |
4 |
0.017 |
|
|
|
|
|
|
|
|
|
|
|
| Leaf Glycerolipid Biosynthesis in Plastid |
BioPath |
24 |
0.000 |
3 |
0.043 |
|
|
|
|
|
|
|
|
|
|
|
| serine-isocitrate lyase pathway |
AraCyc |
24 |
0.000 |
4 |
0.017 |
|
|
|
|
|
|
|
|
|
|
|
| transport |
FunCat |
23 |
0.000 |
3 |
0.000 |
|
|
|
|
|
|
|
|
|
|
|
| transport facilitation |
FunCat |
23 |
0.000 |
3 |
0.000 |
|
|
|
|
|
|
|
|
|
|
|
| aspartate degradation I |
AraCyc |
22 |
0.000 |
3 |
0.011 |
|
|
|
|
|
|
|
|
|
|
|
| aspartate degradation II |
AraCyc |
22 |
0.000 |
3 |
0.002 |
|
|
|
|
|
|
|
|
|
|
|
| formaldehyde assimilation I (serine pathway) |
AraCyc |
22 |
0.000 |
3 |
0.024 |
|
|
|
|
|
|
|
|
|
|
|
| Carbon fixation |
KEGG |
22 |
0.005 |
3 |
0.097 |
|
|
|
|
|
|
|
|
|
|
|
| Nitrogen metabolism |
KEGG |
22 |
0.000 |
3 |
0.010 |
|
|
|
|
|
|
|
|
|
|
|
|
|
|
|
|
|
|
|
|
|
|
|
|
|
|
|
|