| _________________________________________ |
|
|
|
|
|
|
|
|

|
|
|
|
|
|
|
| Pathways co-expressed in the 2 data sets with co-expressed pathways (with more than 6 annotation points each) |
|
Find below a list of pathways that are co-expressed with the bait. First a list of pathways is given that are co-expressed in all data sets. Lists for each individual dataset are shown underneath. Depending on the number of co-expressed pathways only the top scoring pathways are given; all data can be saved as text using the link above. |
|
|
|
|
|
|
| Pathway |
Source |
Sum of scores |
Sum of genes |
|
|
|
|
|
|
|
| Phenylpropanoid Metabolism |
BioPath |
82 |
12 |
|
|
|
|
|
|
|
| Biosynthesis of Amino Acids and Derivatives |
BioPath |
56 |
8 |
|
|
|
|
|
|
|
|
|
| Phenylpropanoid pathway |
LitPath |
54 |
9 |
|
|
|
|
|
|
|
|
|
| lignin biosynthesis |
AraCyc |
54 |
7 |
|
To the right of each table a thumbnail of the actual co-expression heatmap is given. Klick on the link to see the heatmap containing all co-expressed genes. |
|
|
|
|
|
|
|
|
| lignin biosynthesis |
AraCyc |
54 |
7 |
|
|
|
|
|
|
|
|
|
| Lipid signaling |
AcylLipid |
54 |
12 |
|
|
|
|
|
|
|
|
|
| Aromatic amino acid (Phe, Tyr, Trp) metabolism |
BioPath |
42 |
6 |
|
For more information on how these pathway maps were generated please read the methods page |
|
|
|
|
|
|
|
|
| core phenylpropanoid metabolism |
BioPath |
40 |
6 |
|
|
|
|
|
|
|
|
|
| Propanoate metabolism |
KEGG |
36 |
5 |
|
|
|
|
|
|
|
|
|
|
|
|
|
| salicylic acid biosynthesis |
TAIR-GO |
34 |
4 |
|
|
|
|
|
|
|
|
|
|
|
|
|
| salicylic acid biosynthesis |
TAIR-GO |
34 |
4 |
|
|
|
|
|
|
|
|
|
|
|
|
|
| Methionin/SAM/ethylene metabolism from cysteine and aspartate |
BioPath |
32 |
4 |
|
|
|
|
|
|
|
|
|
|
|
|
|
| ethylene biosynthesis |
TAIR-GO |
26 |
3 |
|
|
|
|
|
|
|
|
|
|
|
|
|
| defense response |
TAIR-GO |
24 |
3 |
|
|
|
|
|
|
|
|
|
|
|
|
|
|
|
|
|
|
|
|
|
|
|
|
|
|
|
|
|
|
|
|
|
|
|
|
|
|
|
|
|
|
|
|
|
|
|
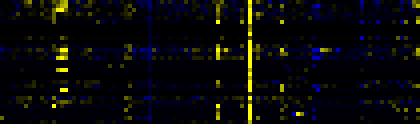
| Pathways co-expressed in the Hormone etc. data set (with more than 9 annotation points) |
|
CYP84A4 (At5g04330) |
|
|
|
|
|
|
|
|
| max. difference between log2-ratios: |
5.8 |
|
|
|
|
|
|
|
|
|
|
|
|
| max. difference between log2-ratios excluding lowest and highest 5%: |
2.2 |
|
|
|
|
|
|
|
|
|
|
|
|
| Pathway |
Source |
Scores of Genes |
p[Score] |
No. of Genes |
p[genes] |
Link to hormones etc. heatmap |
|
|
|
|
|
|
|
| Phenylpropanoid Metabolism |
BioPath |
28 |
0.000 |
4 |
0.012 |
|
|
|
|
|
|
| Phenylpropanoid pathway |
LitPath |
28 |
0.000 |
5 |
0.004 |
|
|
|
|
|
| Biosynthesis of Amino Acids and Derivatives |
BioPath |
22 |
0.000 |
3 |
0.045 |
|
|
|
|
|
| salicylic acid biosynthesis |
TAIR-GO |
17 |
0.000 |
2 |
0.000 |
|
|
|
|
|
| Methionin/SAM/ethylene metabolism from cysteine and aspartate |
BioPath |
16 |
0.000 |
2 |
0.002 |
|
|
|
|
|
| Aromatic amino acid (Phe, Tyr, Trp) metabolism |
BioPath |
14 |
0.000 |
2 |
0.010 |
|
|
|
|
|
| core phenylpropanoid metabolism |
BioPath |
14 |
0.000 |
2 |
0.006 |
|
|
|
|
|
| lignin biosynthesis |
AraCyc |
14 |
0.000 |
3 |
0.000 |
|
|
|
|
|
| secondary metabolism |
FunCat |
14 |
0.000 |
3 |
0.001 |
|
|
|
|
|
|
|
|
|
|
|
| Biosynthesis of prenyl diphosphates |
BioPath |
10 |
0.000 |
1 |
0.050 |
|
|
|
|
|
|
|
|
|
|
|
| Isoprenoid Biosynthesis in the Cytosol and in Mitochondria |
BioPath |
10 |
0.008 |
1 |
0.095 |
|
|
|
|
|
|
|
|
|
|
|
| Phylloquinone biosynthesis |
BioPath |
10 |
0.000 |
1 |
0.001 |
|
|
|
|
|
|
|
|
|
|
|
| salycilic acid biosynthesis |
BioPath |
10 |
0.000 |
1 |
0.000 |
|
|
|
|
|
|
|
|
|
|
|
| ethylene biosynthesis |
TAIR-GO |
10 |
0.000 |
1 |
0.001 |
|
|
|
|
|
|
|
|
|
|
|
| gibberellic acid catabolism |
TAIR-GO |
10 |
0.000 |
1 |
0.000 |
|
|
|
|
|
|
|
|
|
|
|
| lignin biosynthesis |
TAIR-GO |
10 |
0.000 |
1 |
0.002 |
|
|
|
|
|
|
|
|
|
|
|
| phenylpropanoid metabolism |
TAIR-GO |
10 |
0.000 |
1 |
0.001 |
|
|
|
|
|
|
|
|
|
|
|
| systemic acquired resistance |
TAIR-GO |
10 |
0.000 |
1 |
0.001 |
|
|
|
|
|
|
|
|
|
|
|
| alanine biosynthesis II |
AraCyc |
10 |
0.000 |
2 |
0.001 |
|
|
|
|
|
|
|
|
|
|
|
| menaquinone biosynthesis |
AraCyc |
10 |
0.000 |
1 |
0.002 |
|
|
|
|
|
|
|
|
|
|
|
| phenylalanine biosynthesis II |
AraCyc |
10 |
0.000 |
2 |
0.000 |
|
|
|
|
|
|
|
|
|
|
|
| salicylic acid biosynthesis |
AraCyc |
10 |
0.000 |
1 |
0.001 |
|
|
|
|
|
|
|
|
|
|
|
| Biosynthesis of Polyketides and Nonribosomal Peptides |
KEGG |
10 |
0.000 |
1 |
0.001 |
|
|
|
|
|
|
|
|
|
|
|
| Diterpenoid biosynthesis |
KEGG |
10 |
0.000 |
1 |
0.002 |
|
|
|
|
|
|
|
|
|
|
|
| Propanoate metabolism |
KEGG |
10 |
0.000 |
1 |
0.014 |
|
|
|
|
|
|
|
|
|
|
|
| Ubiquinone biosynthesis |
KEGG |
10 |
0.000 |
1 |
0.002 |
|
|
|
|
|
|
|
|
|
|
|
| Lipid signaling |
AcylLipid |
10 |
0.000 |
3 |
0.004 |
|
|
|
|
|
|
|
|
|
|
|
| Gibberellin metabolism |
LitPath |
10 |
0.000 |
1 |
0.051 |
|
|
|
|
|
|
|
|
|
|
|
| giberelin catabolism |
LitPath |
10 |
0.000 |
1 |
0.000 |
|
|
|
|
|
|
|
|
|
|
|
| phylloquinone biosynthesis |
LitPath |
10 |
0.000 |
1 |
0.075 |
|
|
|
|
|
|
|
|
|
|
|
| phylloquinone biosynthesis, salicylic acid biosynthesis |
LitPath |
10 |
0.000 |
1 |
0.000 |
|
|
|
|
|
|
|
|
|
|
|
| plastochinone and phylloquinone biosynthesis |
LitPath |
10 |
0.000 |
1 |
0.022 |
|
|
|
|
|
|
|
|
|
|
|
| prenyl diphosphate (GPP,FPP, GGPP) biosynthesis |
LitPath |
10 |
0.000 |
1 |
0.041 |
|
|
|
|
|
|
|
|
|
|
|
|
|
|
|
|
|
|
|
|
|
|
|
|
|
|
|
|
|
|
|
|
|
|
|
|
|
|
|
|
|
|
|
|
|
|
|
|
|
|
|
|
|
|
|
|
|
|
|
|
|
|
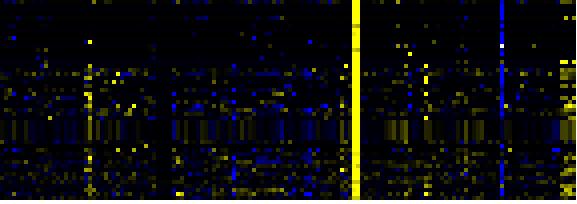
| Pathways co-expressed in the Mutant data set (with more than 10 annotation points) |
|
CYP84A4 (At5g04330) |
|
|
|
|
|
|
|
|
| max. difference between log2-ratios: |
6.0 |
|
|
|
|
|
|
|
|
|
|
|
|
| max. difference between log2-ratios excluding lowest and highest 5%: |
1.9 |
|
|
|
|
|
|
|
|
|
|
|
|
| Pathway |
Source |
Scores of Genes |
p[Score] |
No. of Genes |
p[genes] |
Link to mutants heatmap |
|
|
|
|
|
|
|
| Phenylpropanoid Metabolism |
BioPath |
54 |
0.000 |
8 |
0.003 |
|
|
|
|
| response to pathogenic bacteria |
TAIR-GO |
44 |
0.000 |
6 |
0.000 |
|
|
|
| Lipid signaling |
AcylLipid |
44 |
0.000 |
9 |
0.008 |
|
|
|
| Biosynthesis of Amino Acids and Derivatives |
BioPath |
34 |
0.000 |
5 |
0.070 |
|
|
|
| tryptophan biosynthesis |
TAIR-GO |
34 |
0.000 |
5 |
0.000 |
|
|
|
| tryptophan biosynthesis |
AraCyc |
34 |
0.000 |
5 |
0.000 |
|
|
|
| Shikimate pathway |
LitPath |
34 |
0.000 |
5 |
0.001 |
|
|
|
| Trp biosyntesis |
LitPath |
34 |
0.000 |
5 |
0.000 |
|
|
|
| Aromatic amino acid (Phe, Tyr, Trp) metabolism |
BioPath |
28 |
0.000 |
4 |
0.003 |
|
|
|
| core phenylpropanoid metabolism |
BioPath |
26 |
0.000 |
4 |
0.001 |
|
|
|
| Propanoate metabolism |
KEGG |
26 |
0.000 |
4 |
0.000 |
|
|
|
| Phenylpropanoid pathway |
LitPath |
26 |
0.000 |
4 |
0.101 |
|
|
|
| jasmonic acid biosynthesis |
AraCyc |
20 |
0.000 |
3 |
0.000 |
|
|
|
|
|
|
|
|
|
|
|
| lignin biosynthesis |
AraCyc |
20 |
0.000 |
2 |
0.023 |
|
|
|
|
|
|
|
|
|
|
|
| C-compound and carbohydrate metabolism |
FunCat |
19 |
0.021 |
5 |
0.086 |
|
|
|
|
|
|
|
|
|
|
|
| Glutathione metabolism |
BioPath |
18 |
0.000 |
3 |
0.032 |
|
|
|
|
|
|
|
|
|
|
|
| defense response |
TAIR-GO |
17 |
0.000 |
2 |
0.006 |
|
|
|
|
|
|
|
|
|
|
|
| Methionin/SAM/ethylene metabolism from cysteine and aspartate |
BioPath |
16 |
0.000 |
2 |
0.015 |
|
|
|
|
|
|
|
|
|
|
|
| ethylene biosynthesis |
TAIR-GO |
16 |
0.000 |
2 |
0.000 |
|
|
|
|
|
|
|
|
|
|
|
| jasmonic acid biosynthesis |
TAIR-GO |
16 |
0.000 |
2 |
0.005 |
|
|
|
|
|
|
|
|
|
|
|
| biosynthesis of proto- and siroheme |
AraCyc |
14 |
0.000 |
2 |
0.019 |
|
|
|
|
|
|
|
|
|
|
|
| chlorophyll biosynthesis |
AraCyc |
14 |
0.000 |
2 |
0.036 |
|
|
|
|
|
|
|
|
|
|
|
| intracellular signalling |
FunCat |
13 |
0.000 |
3 |
0.004 |
|
|
|
|
|
|
|
|
|
|
|
| Alanine and aspartate metabolism |
KEGG |
12 |
0.000 |
2 |
0.013 |
|
|
|
|
|
|
|
|
|
|
|
| beta-Alanine metabolism |
KEGG |
12 |
0.000 |
2 |
0.004 |
|
|
|
|
|
|
|
|
|
|
|
| Butanoate metabolism |
KEGG |
12 |
0.000 |
2 |
0.007 |
|
|
|
|
|
|
|
|
|
|
|
| Glutamate metabolism |
KEGG |
12 |
0.001 |
2 |
0.031 |
|
|
|
|
|
|
|
|
|
|
|
| Phenylalanine, tyrosine and tryptophan biosynthesis |
KEGG |
12 |
0.000 |
2 |
0.031 |
|
|
|
|
|
|
|
|
|
|
|
| Taurine and hypotaurine metabolism |
KEGG |
12 |
0.000 |
2 |
0.000 |
|
|
|
|
|
|
|
|
|
|
|
| Benzoate degradation via CoA ligation |
KEGG |
11 |
0.011 |
2 |
0.174 |
|
|
|
|
|
|
|
|
|
|
|
| Inositol phosphate metabolism |
KEGG |
11 |
0.022 |
2 |
0.206 |
|
|
|
|
|
|
|
|
|
|
|
| Nicotinate and nicotinamide metabolism |
KEGG |
11 |
0.004 |
2 |
0.146 |
|
|
|
|
|
|
|
|
|
|
|
|
|
|
|
|
|
|
|
|
|
|
|
|
|
|
|
|