| _________________________________________ |
|
|
|
|
|
|
|
|
|
|
|
|
|
|
|
|
|
|
| Pathways co-expressed in all 4 data sets (with more than 6 annotation points each) |
|
Find below a list of pathways that are co-expressed with the bait. First a list of pathways is given that are co-expressed in all data sets. Lists for each individual dataset are shown underneath. Depending on the number of co-expressed pathways only the top scoring pathways are given; all data can be saved as text using the link above. |

|
|
|
|
|
|
|
|
|
|
| Pathway |
Source |
Sum of scores |
Sum of genes |
|
|
|
|
|
|
|
|
|
|
| chlorophyll biosynthesis |
TAIR-GO |
275 |
31 |
|
|
|
|
|
|
|
|
|
|
| chlorophyll biosynthesis |
LitPath |
259 |
29 |
|
|
|
|
|
|
|
|
|
|
| Fatty acid elongation and wax and cutin metabolism |
AcylLipid |
202 |
34 |
|
|
|
|
|
|
|
|
|
|
| cuticle biosynthesis |
TAIR-GO |
109 |
17 |
|
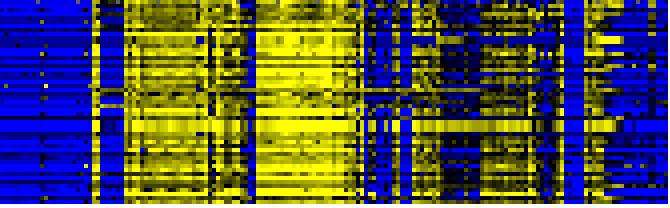
To the right of each table a thumbnail of the actual co-expression heatmap is given. Klick on the link to see the heatmap containing all co-expressed genes. |
|
|
|
|
|
|
|
|
|
|
|
| wax biosynthesis |
TAIR-GO |
102 |
13 |
|
|
|
|
|
|
|
|
|
|
|
|
| brassinosteroid biosynthesis |
BioPath |
102 |
11 |
|
|
|
|
|
|
|
|
|
|
|
|
| Ascorbate and aldarate metabolism |
KEGG |
82 |
10 |
|
For more information on how these pathway maps were generated please read the methods page |
|
|
|
|
|
|
|
|
|
|
|
| starch biosynthesis |
AraCyc |
75 |
9 |
|
|
|
|
|
|
|
|
|
|
|
|
| starch biosynthesis |
TAIR-GO |
74 |
9 |
|
|
|
|
|
|
|
|
|
|
|
|
|
|
|
| cellulose biosynthesis |
TAIR-GO |
74 |
13 |
|
|
|
|
|
|
|
|
|
|
|
|
|
|
|
| Fluorene degradation |
KEGG |
56 |
6 |
|
|
|
|
|
|
|
|
|
|
|
|
|
|
|
| epicuticular wax biosynthesis |
AraCyc |
56 |
7 |
|
|
|
|
|
|
|
|
|
|
|
|
|
|
|
| biosynthesis of extracellular lipids |
LitPath |
36 |
4 |
|
|
|
|
|
|
|
|
|
|
|
|
|
|
|
|
|
|
|
|
|
|
|
|
|
|
|
|
|
|
|
|
|
|
|
|
|
|
|
|
|
|
|
|
|
|
|
|
|
|
|
|
|
| Pathways co-expressed in the Organ and Tissue data set (with more than 39 annotation points) |
|
CYP86A2 (At4g00360) |
|
|
|
|
|
|
|
|
|
|
| max. difference between log2-ratios: |
6.6 |
|
|
|
|
|
|
|
|
|
|
|
|
|
|
| max. difference between log2-ratios excluding lowest and highest 5%: |
5.4 |
|
|
|
|
|
|
|
|
|
|
|
|
|
|
| Pathway |
Source |
Scores of Genes |
p[Score] |
No. of Genes |
p[genes] |
Link to organ heatmap |
|
|
|
|
|
|
|
|
|
| Photosystems |
BioPath |
327 |
0.000 |
50 |
0.000 |
|
|
|
|
|
| Plastidial Isoprenoids (Chlorophylls, Carotenoids, Tocopherols, Plastoquinone, Phylloquinone) |
BioPath |
140 |
0.000 |
19 |
0.001 |
|
|
|
|
| Photosynthesis |
KEGG |
135 |
0.000 |
24 |
0.000 |
|
|
|
|
| Photosystem I |
BioPath |
131 |
0.000 |
22 |
0.000 |
|
|
|
|
| additional photosystem II components |
BioPath |
130 |
0.000 |
19 |
0.000 |
|
|
|
|
| biogenesis of chloroplast |
FunCat |
125 |
0.000 |
19 |
0.000 |
|
|
|
|
| photosynthesis |
FunCat |
124 |
0.000 |
19 |
0.000 |
|
|
|
|
| Chlorophyll a/b binding proteins |
BioPath |
108 |
0.000 |
13 |
0.000 |
|
|
|
|
| transport |
FunCat |
99 |
0.000 |
16 |
0.000 |
|
|
|
|
| glycolysis and gluconeogenesis |
FunCat |
85 |
0.000 |
12 |
0.035 |
|
|
|
|
| photosystem I |
TAIR-GO |
77 |
0.000 |
9 |
0.000 |
|
|
|
|
| Photosystem II |
BioPath |
73 |
0.000 |
10 |
0.003 |
|
|
|
|
| Carbon fixation |
KEGG |
72 |
0.000 |
10 |
0.000 |
|
|
|
|
| transport facilitation |
FunCat |
65 |
0.000 |
10 |
0.000 |
|
|
|
|
|
|
|
|
|
|
|
|
|
| photosystem II |
TAIR-GO |
61 |
0.000 |
7 |
0.000 |
|
|
|
|
|
|
|
|
|
|
|
|
|
| chlorophyll binding |
TAIR-GO |
52 |
0.000 |
6 |
0.000 |
|
|
|
|
|
|
|
|
|
|
|
|
|
| Biosynthesis of steroids |
KEGG |
49 |
0.000 |
6 |
0.004 |
|
|
|
|
|
|
|
|
|
|
|
|
|
| Glycolysis / Gluconeogenesis |
KEGG |
48 |
0.000 |
7 |
0.019 |
|
|
|
|
|
|
|
|
|
|
|
|
|
| Carotenoid and abscisic acid metabolism |
LitPath |
48 |
0.000 |
6 |
0.000 |
|
|
|
|
|
|
|
|
|
|
|
|
|
| Carotenoid biosynthesis |
BioPath |
44 |
0.000 |
5 |
0.001 |
|
|
|
|
|
|
|
|
|
|
|
|
|
| carotenoid biosynthesis |
AraCyc |
44 |
0.000 |
5 |
0.000 |
|
|
|
|
|
|
|
|
|
|
|
|
|
| carotenid biosynthesis |
LitPath |
44 |
0.000 |
5 |
0.000 |
|
|
|
|
|
|
|
|
|
|
|
|
|
| light harvesting complex |
BioPath |
42 |
0.000 |
5 |
0.000 |
|
|
|
|
|
|
|
|
|
|
|
|
|
| acetate fermentation |
AraCyc |
42 |
0.000 |
6 |
0.245 |
|
|
|
|
|
|
|
|
|
|
|
|
|
| fructose degradation (anaerobic) |
AraCyc |
42 |
0.000 |
6 |
0.189 |
|
|
|
|
|
|
|
|
|
|
|
|
|
| glycolysis IV |
AraCyc |
42 |
0.000 |
6 |
0.200 |
|
|
|
|
|
|
|
|
|
|
|
|
|
| sorbitol fermentation |
AraCyc |
42 |
0.000 |
6 |
0.222 |
|
|
|
|
|
|
|
|
|
|
|
|
|
| Calvin cycle |
AraCyc |
40 |
0.000 |
7 |
0.006 |
|
|
|
|
|
|
|
|
|
|
|
|
|
| gluconeogenesis |
AraCyc |
40 |
0.000 |
5 |
0.116 |
|
|
|
|
|
|
|
|
|
|
|
|
|
| photorespiration |
AraCyc |
40 |
0.000 |
9 |
0.000 |
|
|
|
|
|
|
|
|
|
|
|
|
|
|
|
|
|
|
|
|
|
|
|
|
|
|
|
|
|
|
|
|
|
|
|
|
|
|
|
|
|
|
|
|
|
|
|
|
|
|
|
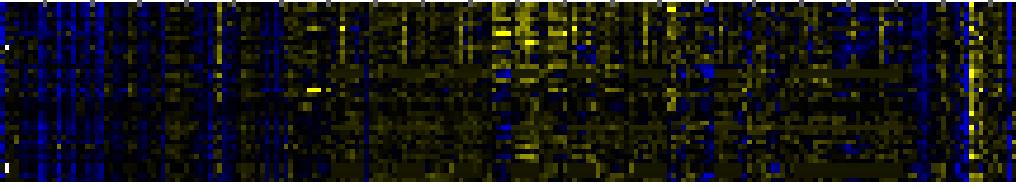
| Pathways co-expressed in the Stress data set ( with more than 10 annotation points) |
|
CYP86A2 (At4g00360) |
|
|
|
|
|
|
|
|
|
|
| max. difference between log2-ratios: |
7.1 |
|
|
|
|
|
|
|
|
|
|
|
|
|
|
| max. difference between log2-ratios excluding lowest and highest 5%: |
2.2 |
|
|
|
|
|
|
|
|
|
|
|
|
|
|
| Pathway |
Source |
Scores of Genes |
p[Score] |
No. of Genes |
p[genes] |
Link to stress heatmap |
|
|
|
|
|
|
|
|
|
| Fatty acid elongation and wax and cutin metabolism |
AcylLipid |
55 |
0.000 |
9 |
0.000 |
|
| fatty acid metabolism |
TAIR-GO |
44 |
0.000 |
6 |
0.000 |
| cuticle biosynthesis |
TAIR-GO |
41 |
0.000 |
6 |
0.000 |
| long-chain fatty acid metabolism |
TAIR-GO |
35 |
0.000 |
5 |
0.000 |
| very-long-chain fatty acid metabolism |
TAIR-GO |
35 |
0.000 |
5 |
0.000 |
| wax biosynthesis |
TAIR-GO |
30 |
0.000 |
4 |
0.000 |
| fatty acid elongation |
TAIR-GO |
23 |
0.000 |
3 |
0.000 |
| atty acid elongation -- unsaturated |
AraCyc |
23 |
0.000 |
4 |
0.000 |
| fatty acid biosynthesis -- initial steps |
AraCyc |
23 |
0.000 |
4 |
0.000 |
| fatty acid elongation -- saturated |
AraCyc |
23 |
0.000 |
4 |
0.000 |
| fatty acid elongation -- unsaturated |
AraCyc |
23 |
0.000 |
4 |
0.000 |
| Photosystems |
BioPath |
16 |
0.000 |
2 |
0.062 |
|
|
|
|
|
|
|
|
|
|
|
|
|
| acetyl-CoA assimilation |
AraCyc |
16 |
0.000 |
2 |
0.006 |
|
|
|
|
|
|
|
|
|
|
|
|
|
| epicuticular wax biosynthesis |
AraCyc |
16 |
0.000 |
2 |
0.000 |
|
|
|
|
|
|
|
|
|
|
|
|
|
| glyoxylate cycle |
AraCyc |
16 |
0.000 |
2 |
0.002 |
|
|
|
|
|
|
|
|
|
|
|
|
|
| serine-isocitrate lyase pathway |
AraCyc |
16 |
0.000 |
2 |
0.016 |
|
|
|
|
|
|
|
|
|
|
|
|
|
| TCA cycle -- aerobic respiration |
AraCyc |
16 |
0.000 |
2 |
0.018 |
|
|
|
|
|
|
|
|
|
|
|
|
|
| TCA cycle variation IV |
AraCyc |
16 |
0.000 |
2 |
0.016 |
|
|
|
|
|
|
|
|
|
|
|
|
|
| TCA cycle variation VII |
AraCyc |
16 |
0.000 |
2 |
0.051 |
|
|
|
|
|
|
|
|
|
|
|
|
|
| TCA cycle variation VIII |
AraCyc |
16 |
0.000 |
2 |
0.020 |
|
|
|
|
|
|
|
|
|
|
|
|
|
| biogenesis of cell wall |
FunCat |
12 |
0.000 |
2 |
0.010 |
|
|
|
|
|
|
|
|
|
|
|
|
|
| isoprenoid biosynthesis |
FunCat |
12 |
0.000 |
3 |
0.001 |
|
|
|
|
|
|
|
|
|
|
|
|
|
| lipid, fatty acid and isoprenoid biosynthesis |
FunCat |
12 |
0.000 |
3 |
0.000 |
|
|
|
|
|
|
|
|
|
|
|
|
|
|
|
|
|
|
|
|
|
|
|
|
|
|
|
|
|
|
|
|
|
|
|
|
|
|
|
|
|
|
|
|
|
|
|
|
|
|
|
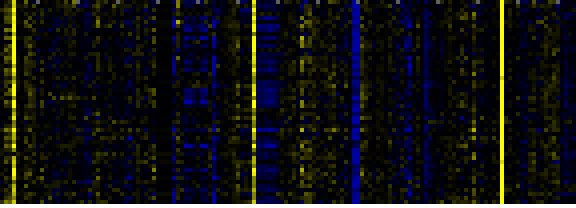
| Pathways co-expressed in the Hormone etc. data set (with more than 10 annotation points) |
|
CYP86A2 (At4g00360) |
|
|
|
|
|
|
|
|
|
|
| max. difference between log2-ratios: |
3.6 |
|
|
|
|
|
|
|
|
|
|
|
|
|
|
| max. difference between log2-ratios excluding lowest and highest 5%: |
1.4 |
|
|
|
|
|
|
|
|
|
|
|
|
|
|
| Pathway |
Source |
Scores of Genes |
p[Score] |
No. of Genes |
p[genes] |
Link to hormones etc. heatmap |
|
|
|
|
|
|
|
|
|
| Fatty acid elongation and wax and cutin metabolism |
AcylLipid |
51 |
0.000 |
9 |
0.000 |

|
|
|
|
|
|
|
|
| fatty acid metabolism |
TAIR-GO |
33 |
0.000 |
5 |
0.000 |
|
|
|
|
|
|
|
| cuticle biosynthesis |
TAIR-GO |
24 |
0.000 |
4 |
0.000 |
|
|
|
|
|
|
|
| long-chain fatty acid metabolism |
TAIR-GO |
24 |
0.000 |
4 |
0.000 |
|
|
|
|
|
|
|
| very-long-chain fatty acid metabolism |
TAIR-GO |
24 |
0.000 |
4 |
0.000 |
|
|
|
|
|
|
|
| wax biosynthesis |
TAIR-GO |
24 |
0.000 |
3 |
0.000 |
|
|
|
|
|
|
|
| Synthesis of membrane lipids in endomembrane system |
AcylLipid |
22 |
0.000 |
3 |
0.049 |
|
|
|
|
|
|
|
|
|
|
|
|
|
| Cell Wall Carbohydrate Metabolism |
BioPath |
16 |
0.000 |
4 |
0.011 |
|
|
|
|
|
|
|
|
|
|
|
|
|
| acetyl-CoA assimilation |
AraCyc |
16 |
0.000 |
2 |
0.003 |
|
|
|
|
|
|
|
|
|
|
|
|
|
| atty acid elongation -- unsaturated |
AraCyc |
16 |
0.000 |
4 |
0.000 |
|
|
|
|
|
|
|
|
|
|
|
|
|
| cellulose biosynthesis |
AraCyc |
16 |
0.000 |
3 |
0.001 |
|
|
|
|
|
|
|
|
|
|
|
|
|
| epicuticular wax biosynthesis |
AraCyc |
16 |
0.000 |
2 |
0.000 |
|
|
|
|
|
|
|
|
|
|
|
|
|
| fatty acid biosynthesis -- initial steps |
AraCyc |
16 |
0.000 |
4 |
0.000 |
|
|
|
|
|
|
|
|
|
|
|
|
|
| fatty acid elongation -- saturated |
AraCyc |
16 |
0.000 |
4 |
0.000 |
|
|
|
|
|
|
|
|
|
|
|
|
|
| fatty acid elongation -- unsaturated |
AraCyc |
16 |
0.000 |
4 |
0.000 |
|
|
|
|
|
|
|
|
|
|
|
|
|
| glyoxylate cycle |
AraCyc |
16 |
0.000 |
2 |
0.001 |
|
|
|
|
|
|
|
|
|
|
|
|
|
| serine-isocitrate lyase pathway |
AraCyc |
16 |
0.000 |
2 |
0.007 |
|
|
|
|
|
|
|
|
|
|
|
|
|
| TCA cycle -- aerobic respiration |
AraCyc |
16 |
0.000 |
2 |
0.008 |
|
|
|
|
|
|
|
|
|
|
|
|
|
| TCA cycle variation IV |
AraCyc |
16 |
0.000 |
2 |
0.007 |
|
|
|
|
|
|
|
|
|
|
|
|
|
| TCA cycle variation VII |
AraCyc |
16 |
0.000 |
2 |
0.024 |
|
|
|
|
|
|
|
|
|
|
|
|
|
| TCA cycle variation VIII |
AraCyc |
16 |
0.000 |
2 |
0.009 |
|
|
|
|
|
|
|
|
|
|
|
|
|
| cellulose biosynthesis |
BioPath |
12 |
0.000 |
2 |
0.001 |
|
|
|
|
|
|
|
|
|
|
|
|
|
| cell wall biosynthesis (sensu Magnoliophyta) |
TAIR-GO |
12 |
0.000 |
2 |
0.003 |
|
|
|
|
|
|
|
|
|
|
|
|
|
| cellulose biosynthesis |
TAIR-GO |
12 |
0.000 |
2 |
0.001 |
|
|
|
|
|
|
|
|
|
|
|
|
|
| primary cell wall biosynthesis (sensu Magnoliophyta) |
TAIR-GO |
12 |
0.000 |
2 |
0.000 |
|
|
|
|
|
|
|
|
|
|
|
|
|
| isoprenoid biosynthesis |
FunCat |
12 |
0.000 |
3 |
0.000 |
|
|
|
|
|
|
|
|
|
|
|
|
|
| lipid, fatty acid and isoprenoid biosynthesis |
FunCat |
12 |
0.000 |
3 |
0.000 |
|
|
|
|
|
|
|
|
|
|
|
|
|
|
|
|
|
|
|
|
|
|
|
|
|
|
|
|
|
|
|
|
|
|
|
|
|
|
|
|
|
|
|
|
|
|
|
|
|
|
|
|
|
|
|
|
|
|
|
|
|
|
|
|
|
|
|
|
|
|
| Pathways co-expressed in the Mutant data set (with more than 60 annotation points) |
|
CYP86A2 (At4g00360) |
|
|
|
|
|
|
|
|
|
|
| max. difference between log2-ratios: |
6.0 |
|
|
|
|
|
|
|
|
|
|
|
|
|
|
| max. difference between log2-ratios excluding lowest and highest 5%: |
1.8 |
|
|
|
|
|
|
|
|
|
|
|
|
|
|
| Pathway |
Source |
Scores of Genes |
p[Score] |
No. of Genes |
p[genes] |
Link to mutants heatmap |
|
|
|
|
|
|
|
|
|
| Photosystems |
BioPath |
339 |
0.000 |
47 |
0.000 |
|
|
|
|
|
|
| C-compound and carbohydrate metabolism |
FunCat |
221 |
0.000 |
38 |
0.037 |
|
|
|
|
|
| Plastidial Isoprenoids (Chlorophylls, Carotenoids, Tocopherols, Plastoquinone, Phylloquinone) |
BioPath |
208 |
0.000 |
26 |
0.000 |
|
|
|
|
|
| biogenesis of chloroplast |
FunCat |
161 |
0.000 |
24 |
0.000 |
|
|
|
|
|
| additional photosystem II components |
BioPath |
144 |
0.000 |
19 |
0.000 |
|
|
|
|
|
| photosynthesis |
FunCat |
142 |
0.000 |
21 |
0.000 |
|
|
|
|
|
| transport |
FunCat |
141 |
0.000 |
23 |
0.000 |
|
|
|
|
|
| Photosynthesis |
KEGG |
127 |
0.000 |
20 |
0.000 |
|
|
|
|
|
| glycolysis and gluconeogenesis |
FunCat |
121 |
0.000 |
20 |
0.018 |
|
|
|
|
|
| Chlorophyll a/b binding proteins |
BioPath |
118 |
0.000 |
15 |
0.000 |
|
|
|
|
|
| Photosystem I |
BioPath |
111 |
0.000 |
17 |
0.003 |
|
|
|
|
|
| chlorophyll biosynthesis |
AraCyc |
106 |
0.000 |
13 |
0.003 |
|
|
|
|
|
| Carbon fixation |
KEGG |
106 |
0.000 |
17 |
0.000 |
|
|
|
|
|
| Chlorophyll biosynthesis and breakdown |
BioPath |
103 |
0.000 |
12 |
0.001 |
|
|
|
|
|
| transport facilitation |
FunCat |
101 |
0.000 |
16 |
0.000 |
|
|
|
|
|
|
|
|
|
|
|
|
|
| chlorophyll and phytochromobilin metabolism |
LitPath |
97 |
0.000 |
11 |
0.000 |
|
|
|
|
|
|
|
|
|
|
|
|
|
| Biosynthesis of steroids |
KEGG |
95 |
0.000 |
10 |
0.004 |
|
|
|
|
|
|
|
|
|
|
|
|
|
| fatty acid biosynthesis |
TAIR-GO |
86 |
0.000 |
10 |
0.000 |
|
|
|
|
|
|
|
|
|
|
|
|
|
| chlorophyll biosynthesis |
TAIR-GO |
85 |
0.000 |
9 |
0.000 |
|
|
|
|
|
|
|
|
|
|
|
|
|
| Porphyrin and chlorophyll metabolism |
KEGG |
83 |
0.000 |
10 |
0.000 |
|
|
|
|
|
|
|
|
|
|
|
|
|
| Glycolysis / Gluconeogenesis |
KEGG |
78 |
0.000 |
14 |
0.006 |
|
|
|
|
|
|
|
|
|
|
|
|
|
| Methionin/SAM/ethylene metabolism from cysteine and aspartate |
BioPath |
76 |
0.000 |
9 |
0.017 |
|
|
|
|
|
|
|
|
|
|
|
|
|
| Selenoamino acid metabolism |
KEGG |
76 |
0.000 |
9 |
0.000 |
|
|
|
|
|
|
|
|
|
|
|
|
|
| triterpene, sterol, and brassinosteroid metabolism |
LitPath |
72 |
0.004 |
8 |
0.374 |
|
|
|
|
|
|
|
|
|
|
|
|
|
| Photosystem II |
BioPath |
65 |
0.025 |
8 |
0.177 |
|
|
|
|
|
|
|
|
|
|
|
|
|
| Nitrogen metabolism |
KEGG |
65 |
0.000 |
9 |
0.001 |
|
|
|
|
|
|
|
|
|
|
|
|
|
| Calvin cycle |
AraCyc |
64 |
0.000 |
12 |
0.000 |
|
|
|
|
|
|
|
|
|
|
|
|
|
| Fatty acid elongation and wax and cutin metabolism |
AcylLipid |
61 |
0.000 |
10 |
0.017 |
|
|
|
|
|
|
|
|
|
|
|
|
|
|
|
|
|
|
|
|
|
|
|
|
|
|
|
|
|
|
|
|