| _________________________________________ |
|
|
|
|
|
|
|
|

|
|
|
|
|
|
|
| Pathways co-expressed in the 2 data sets with co-expressed pathways (with more than 6 annotation points each) |
|
Find below a list of pathways that are co-expressed with the bait. First a list of pathways is given that are co-expressed in all data sets. Lists for each individual dataset are shown underneath. Depending on the number of co-expressed pathways only the top scoring pathways are given; all data can be saved as text using the link above. |
|
|
|
|
|
|
| Pathway |
Source |
Sum of scores |
Sum of genes |
|
|
|
|
|
|
|
| Miscellaneous acyl lipid metabolism |
AcylLipid |
90 |
33 |
|
|
|
|
|
|
|
| Cell Wall Carbohydrate Metabolism |
BioPath |
95 |
23 |
|
|
|
|
|
|
|
|
|
| pectin metabolism |
BioPath |
79 |
20 |
|
|
|
|
|
|
|
|
|
| Fatty acid elongation and wax and cutin metabolism |
AcylLipid |
48 |
12 |
|
To the right of each table a thumbnail of the actual co-expression heatmap is given. Klick on the link to see the heatmap containing all co-expressed genes. |
|
|
|
|
|
|
|
|
| sexual reproduction |
TAIR-GO |
40 |
10 |
|
|
|
|
|
|
|
|
|
| fatty acid metabolism |
TAIR-GO |
34 |
6 |
|
|
|
|
|
|
|
|
|
| Isoprenoid Biosynthesis in the Cytosol and in Mitochondria |
BioPath |
34 |
6 |
|
For more information on how these pathway maps were generated please read the methods page |
|
|
|
|
|
|
|
|
| Biosynthesis of prenyl diphosphates |
BioPath |
26 |
5 |
|
|
|
|
|
|
|
|
|
| gibberellic acid catabolism |
TAIR-GO |
20 |
2 |
|
|
|
|
|
|
|
|
|
|
|
|
|
| Diterpenoid biosynthesis |
KEGG |
20 |
2 |
|
|
|
|
|
|
|
|
|
|
|
|
|
| Gibberellin metabolism |
LitPath |
20 |
2 |
|
|
|
|
|
|
|
|
|
|
|
|
|
| giberelin catabolism |
LitPath |
20 |
2 |
|
|
|
|
|
|
|
|
|
|
|
|
|
| prenyl diphosphate (GPP,FPP, GGPP) biosynthesis |
LitPath |
20 |
2 |
|
|
|
|
|
|
|
|
|
|
|
|
|
| triacylglycerol degradation |
AraCyc |
18 |
8 |
|
|
|
|
|
|
|
|
|
|
|
|
|
| lignin biosynthesis |
AraCyc |
18 |
8 |
|
|
|
|
|
|
|
|
|
|
|
|
|
| cuticle biosynthesis |
TAIR-GO |
16 |
4 |
|
|
|
|
|
|
|
|
|
|
|
|
|
| long-chain fatty acid metabolism |
TAIR-GO |
16 |
4 |
|
|
|
|
|
|
|
|
|
|
|
|
|
| very-long-chain fatty acid metabolism |
TAIR-GO |
16 |
4 |
|
|
|
|
|
|
|
|
|
|
|
|
|
| suberin biosynthesis |
AraCyc |
14 |
6 |
|
|
|
|
|
|
|
|
|
|
|
|
|
|
|
|
|
|
|
|
|
|
|
|
|
|
|
|
|
|
|
|
|
|
|
|
|
|
|
|
|
|
|
|
|
|
|
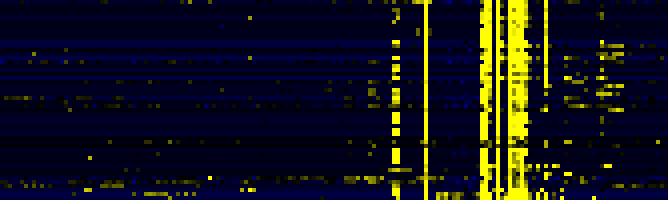
| Pathways co-expressed in the Organ and Tissue data set (with more than 10 annotation points) |
|
CYP86C2 (At3g26125) |
|
|
|
|
|
|
|
|
| max. difference between log2-ratios: |
6.8 |
|
|
|
|
|
|
|
|
|
|
|
|
| max. difference between log2-ratios excluding lowest and highest 5%: |
3.5 |
|
|
|
|
|
|
|
|
|
|
|
|
| Pathway |
Source |
Scores of Genes |
p[Score] |
No. of Genes |
p[genes] |
Link to organ heatmap |
|
|
|
|
|
|
|
| Miscellaneous acyl lipid metabolism |
AcylLipid |
44 |
0.000 |
16 |
0.000 |
|
|
|
| Fatty acid elongation and wax and cutin metabolism |
AcylLipid |
33 |
0.000 |
7 |
0.007 |
|
|
| fatty acid metabolism |
TAIR-GO |
26 |
0.000 |
4 |
0.000 |
|
|
| sexual reproduction |
TAIR-GO |
20 |
0.000 |
5 |
0.000 |
|
|
| Biosynthesis of prenyl diphosphates |
BioPath |
14 |
0.000 |
3 |
0.001 |
|
|
| Cell Wall Carbohydrate Metabolism |
BioPath |
14 |
0.006 |
4 |
0.176 |
|
|
| Isoprenoid Biosynthesis in the Cytosol and in Mitochondria |
BioPath |
14 |
0.000 |
3 |
0.002 |
|
|
| pectin metabolism |
BioPath |
14 |
0.000 |
4 |
0.009 |
|
|
| gibberellic acid catabolism |
TAIR-GO |
10 |
0.000 |
1 |
0.001 |
|
|
| triacylglycerol degradation |
AraCyc |
10 |
0.000 |
4 |
0.000 |
|
|
| Diterpenoid biosynthesis |
KEGG |
10 |
0.000 |
1 |
0.001 |
|
|
| Gibberellin metabolism |
LitPath |
10 |
0.000 |
1 |
0.019 |
|
|
| giberelin catabolism |
LitPath |
10 |
0.000 |
1 |
0.000 |
|
|
|
|
|
|
|
|
|
|
|
| prenyl diphosphate (GPP,FPP, GGPP) biosynthesis |
LitPath |
10 |
0.000 |
1 |
0.015 |
|
|
|
|
|
|
|
|
|
|
|
| lignin biosynthesis |
AraCyc |
9 |
0.000 |
4 |
0.000 |
|
|
|
|
|
|
|
|
|
|
|
| Phenylpropanoid pathway |
LitPath |
9 |
0.003 |
4 |
0.002 |
|
|
|
|
|
|
|
|
|
|
|
| cuticle biosynthesis |
TAIR-GO |
8 |
0.000 |
2 |
0.000 |
|
|
|
|
|
|
|
|
|
|
|
| long-chain fatty acid metabolism |
TAIR-GO |
8 |
0.000 |
2 |
0.000 |
|
|
|
|
|
|
|
|
|
|
|
| very-long-chain fatty acid metabolism |
TAIR-GO |
8 |
0.000 |
2 |
0.000 |
|
|
|
|
|
|
|
|
|
|
|
| C-compound and carbohydrate utilization |
FunCat |
8 |
0.000 |
2 |
0.000 |
|
|
|
|
|
|
|
|
|
|
|
| suberin biosynthesis |
AraCyc |
7 |
0.000 |
3 |
0.000 |
|
|
|
|
|
|
|
|
|
|
|
|
|
|
|
|
|
|
|
|
|
|
|
|
|
|
|
|
|
|
|
|
|
|
|
|
|
|
|
|
|
|
|
|
|
|
|
|
|
|
|
|
|
|
|
|
|
|
|
|
|
|
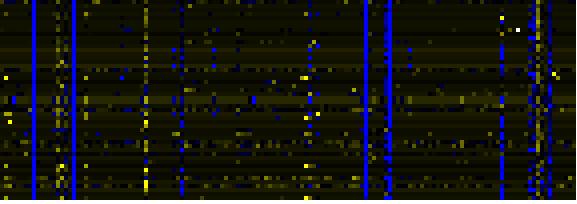
| Pathways co-expressed in the Mutant data set (with more than 10 annotation points) |
|
CYP86C2 (At3g26125) |
|
|
|
|
|
|
|
|
| max. difference between log2-ratios: |
6.0 |
|
|
|
|
|
|
|
|
|
|
|
|
| max. difference between log2-ratios excluding lowest and highest 5%: |
1.5 |
|
|
|
|
|
|
|
|
|
|
|
|
| Pathway |
Source |
Scores of Genes |
p[Score] |
No. of Genes |
p[genes] |
Link to mutants heatmap |
|
|
|
|
|
|
|
| Cell Wall Carbohydrate Metabolism |
BioPath |
81 |
0.000 |
19 |
0.000 |
|
|
|
|
| pectin metabolism |
BioPath |
65 |
0.000 |
16 |
0.000 |
|
|
|
| Miscellaneous acyl lipid metabolism |
AcylLipid |
46 |
0.000 |
17 |
0.000 |
|
|
|
| Starch and sucrose metabolism |
KEGG |
33 |
0.000 |
6 |
0.000 |
|
|
|
| C-compound and carbohydrate metabolism |
FunCat |
32 |
0.003 |
10 |
0.018 |
|
|
|
| Glycan Biosynthesis and Metabolism |
KEGG |
26 |
0.000 |
4 |
0.001 |
|
|
|
| Isoprenoid Biosynthesis in the Cytosol and in Mitochondria |
BioPath |
20 |
0.000 |
3 |
0.045 |
|
|
|
| sexual reproduction |
TAIR-GO |
20 |
0.000 |
5 |
0.000 |
|
|
|
| biogenesis of cell wall |
FunCat |
18 |
0.000 |
6 |
0.000 |
|
|
|
| glycolysis and gluconeogenesis |
FunCat |
16 |
0.017 |
4 |
0.095 |
|
|
|
| Fatty acid elongation and wax and cutin metabolism |
AcylLipid |
15 |
0.028 |
5 |
0.149 |
|
|
|
| Glutamate/glutamine from nitrogen fixation |
BioPath |
14 |
0.000 |
2 |
0.002 |
|
|
|
| assimilation of ammonia, metabolism of the glutamate group |
FunCat |
14 |
0.000 |
2 |
0.009 |
|
|
|
|
|
|
|
|
|
|
|
| nitrogen and sulfur metabolism |
FunCat |
14 |
0.000 |
2 |
0.008 |
|
|
|
|
|
|
|
|
|
|
|
| Glutamate metabolism |
KEGG |
14 |
0.000 |
2 |
0.018 |
|
|
|
|
|
|
|
|
|
|
|
| Glycerolipid metabolism |
KEGG |
14 |
0.000 |
2 |
0.009 |
|
|
|
|
|
|
|
|
|
|
|
| Nitrogen metabolism |
KEGG |
14 |
0.000 |
2 |
0.008 |
|
|
|
|
|
|
|
|
|
|
|
| Oxidative phosphorylation |
KEGG |
14 |
0.000 |
3 |
0.015 |
|
|
|
|
|
|
|
|
|
|
|
| Biosynthesis of prenyl diphosphates |
BioPath |
12 |
0.003 |
2 |
0.067 |
|
|
|
|
|
|
|
|
|
|
|
| lactose degradation IV |
AraCyc |
12 |
0.000 |
3 |
0.000 |
|
|
|
|
|
|
|
|
|
|
|
| Galactose metabolism |
KEGG |
12 |
0.000 |
2 |
0.007 |
|
|
|
|
|
|
|
|
|
|
|
| isoprenoid biosynthesis |
FunCat |
11 |
0.010 |
3 |
0.037 |
|
|
|
|
|
|
|
|
|
|
|
| lipid, fatty acid and isoprenoid biosynthesis |
FunCat |
11 |
0.004 |
3 |
0.024 |
|
|
|
|
|
|
|
|
|
|
|
|
|
|
|
|
|
|
|
|
|
|
|
|
|
|
|
|