| _________________________________________ |
|
|
|
|
|
|
|
|
|
|
|
|
|
|
|
|
|
|
| Pathways co-expressed in the 3 applicable data sets (with more than 6 annotation points each) |
|
Find below a list of pathways that are co-expressed with the bait. First a list of pathways is given that are co-expressed in all data sets. Lists for each individual dataset are shown underneath. Depending on the number of co-expressed pathways only the top scoring pathways are given; all data can be saved as text using the link above. |

|
|
|
|
|
|
|
|
|
|
| Pathway |
Source |
Sum of scores |
Sum of genes |
|
|
|
|
|
|
|
|
|
|
| Cell Wall Carbohydrate Metabolism |
BioPath |
202 |
49 |
|
|
|
|
|
|
|
|
|
|
| pectin metabolism |
BioPath |
154 |
40 |
|
|
|
|
|
|
|
|
|
|
| Miscellaneous acyl lipid metabolism |
AcylLipid |
138 |
51 |
|
|
|
|
|
|
|
|
|
|
| Fatty acid elongation and wax and cutin metabolism |
AcylLipid |
69 |
19 |
|
To the right of each table a thumbnail of the actual co-expression heatmap is given. Klick on the link to see the heatmap containing all co-expressed genes. |
|
|
|
|
|
|
|
|
|
|
|
| Phenylpropanoid pathway |
LitPath |
64 |
15 |
|
|
|
|
|
|
|
|
|
|
|
|
| sexual reproduction |
TAIR-GO |
60 |
15 |
|
|
|
|
|
|
|
|
|
|
|
|
| fatty acid metabolism |
TAIR-GO |
47 |
8 |
|
For more information on how these pathway maps were generated please read the methods page |
|
|
|
|
|
|
|
|
|
|
|
| ubiquinone biosynthesis |
BioPath |
32 |
4 |
|
|
|
|
|
|
|
|
|
|
|
|
| ubiquinone biosynthesis |
BioPath |
32 |
4 |
|
|
|
|
|
|
|
|
|
|
|
|
|
|
|
| cellulose biosynthesis |
BioPath |
28 |
6 |
|
|
|
|
|
|
|
|
|
|
|
|
|
|
|
|
|
|
|
|
|
|
|
|
|
|
|
|
|
|
|
|
|
|
|
|
|
|
|
|
|
|
|
|
|
|
|
|
|
|
|
|
|
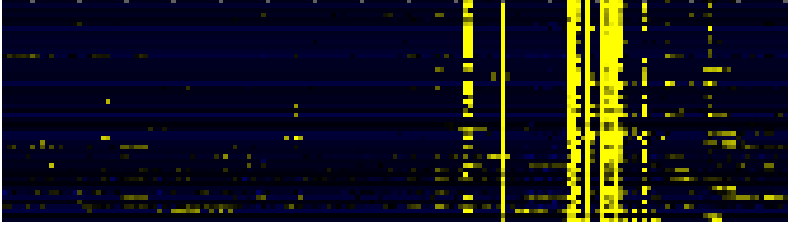
| Pathways co-expressed in the Organ and Tissue data set (with more than 6 annotation points) |
|
CYP86C3 (At1g13140) |
|
|
|
|
|
|
|
|
|
|
| max. difference between log2-ratios: |
3.0 |
|
|
|
|
|
|
|
|
|
|
|
|
|
|
| max. difference between log2-ratios excluding lowest and highest 5%: |
6.2 |
|
|
|
|
|
|
|
|
|
|
|
|
|
|
| Pathway |
Source |
Scores of Genes |
p[Score] |
No. of Genes |
p[genes] |
Link to organ heatmap |
|
|
|
|
|
|
|
|
|
| Miscellaneous acyl lipid metabolism |
AcylLipid |
42 |
0.000 |
15 |
0.000 |
|
|
|
| Fatty acid elongation and wax and cutin metabolism |
AcylLipid |
34 |
0.000 |
8 |
0.002 |
|
|
| fatty acid metabolism |
TAIR-GO |
26 |
0.000 |
4 |
0.000 |
|
|
| Cell Wall Carbohydrate Metabolism |
BioPath |
24 |
0.000 |
6 |
0.098 |
|
|
| Isoprenoid Biosynthesis in the Cytosol and in Mitochondria |
BioPath |
22 |
0.000 |
4 |
0.001 |
|
|
| sexual reproduction |
TAIR-GO |
20 |
0.000 |
5 |
0.000 |
|
|
| Biosynthesis of prenyl diphosphates |
BioPath |
14 |
0.000 |
3 |
0.002 |
|
|
| pectin metabolism |
BioPath |
14 |
0.000 |
4 |
0.031 |
|
|
| polyisoprenoid biosynthesis |
AraCyc |
12 |
0.000 |
3 |
0.000 |
|
|
| Phenylpropanoid pathway |
LitPath |
11 |
0.002 |
5 |
0.001 |
|
|
| cellulose biosynthesis |
BioPath |
10 |
0.000 |
2 |
0.016 |
|
|
| gibberellic acid catabolism |
TAIR-GO |
10 |
0.000 |
1 |
0.001 |
|
|
| Diterpenoid biosynthesis |
KEGG |
10 |
0.000 |
1 |
0.001 |
|
|
| Gibberellin metabolism |
LitPath |
10 |
0.000 |
1 |
0.028 |
|
|
| giberelin catabolism |
LitPath |
10 |
0.000 |
1 |
0.000 |
|
|
| prenyl diphosphate (GPP,FPP, GGPP) biosynthesis |
LitPath |
10 |
0.000 |
1 |
0.022 |
|
|
|
|
|
|
|
|
|
|
|
|
|
| lignin biosynthesis |
AraCyc |
9 |
0.000 |
4 |
0.000 |
|
|
|
|
|
|
|
|
|
|
|
|
|
| hemicellulose biosynthesis |
BioPath |
8 |
0.000 |
1 |
0.015 |
|
|
|
|
|
|
|
|
|
|
|
|
|
| ubiquinone biosynthesis |
BioPath |
8 |
0.000 |
1 |
0.001 |
|
|
|
|
|
|
|
|
|
|
|
|
|
| cell wall organization and biogenesis (sensu Magnoliophyta) |
TAIR-GO |
8 |
0.000 |
1 |
0.000 |
|
|
|
|
|
|
|
|
|
|
|
|
|
| cuticle biosynthesis |
TAIR-GO |
8 |
0.000 |
2 |
0.000 |
|
|
|
|
|
|
|
|
|
|
|
|
|
| long-chain fatty acid metabolism |
TAIR-GO |
8 |
0.000 |
2 |
0.001 |
|
|
|
|
|
|
|
|
|
|
|
|
|
| very-long-chain fatty acid metabolism |
TAIR-GO |
8 |
0.000 |
2 |
0.000 |
|
|
|
|
|
|
|
|
|
|
|
|
|
| biosynthesis of proto- and siroheme |
AraCyc |
8 |
0.000 |
1 |
0.035 |
|
|
|
|
|
|
|
|
|
|
|
|
|
| mevalonate pathway |
AraCyc |
8 |
0.000 |
1 |
0.008 |
|
|
|
|
|
|
|
|
|
|
|
|
|
| triacylglycerol degradation |
AraCyc |
8 |
0.000 |
4 |
0.000 |
|
|
|
|
|
|
|
|
|
|
|
|
|
| C-compound and carbohydrate utilization |
FunCat |
8 |
0.000 |
2 |
0.000 |
|
|
|
|
|
|
|
|
|
|
|
|
|
| metabolism of vitamins, cofactors, and prosthetic groups |
FunCat |
8 |
0.000 |
1 |
0.000 |
|
|
|
|
|
|
|
|
|
|
|
|
|
| Fructose and mannose metabolism |
KEGG |
8 |
0.000 |
1 |
0.011 |
|
|
|
|
|
|
|
|
|
|
|
|
|
| Glycan Biosynthesis and Metabolism |
KEGG |
8 |
0.000 |
1 |
0.021 |
|
|
|
|
|
|
|
|
|
|
|
|
|
| Glycerolipid metabolism |
KEGG |
8 |
0.000 |
1 |
0.006 |
|
|
|
|
|
|
|
|
|
|
|
|
|
| Ubiquinone biosynthesis |
KEGG |
8 |
0.000 |
1 |
0.001 |
|
|
|
|
|
|
|
|
|
|
|
|
|
| ubiquinone biosynthesis |
LitPath |
8 |
0.000 |
1 |
0.001 |
|
|
|
|
|
|
|
|
|
|
|
|
|
| suberin biosynthesis |
AraCyc |
7 |
0.000 |
3 |
0.000 |
|
|
|
|
|
|
|
|
|
|
|
|
|
|
|
|
|
|
|
|
|
|
|
|
|
|
|
|
|
|
|
|
|
|
|
|
|
|
|
|
|
|
|
|
|
|
|
|
|
|
|
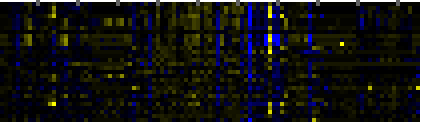
| Pathways co-expressed in the Hormone etc. data set (with more than 6 annotation points) |
|
CYP86C3 (At1g13140) |
|
|
|
|
|
|
|
|
|
|
| max. difference between log2-ratios: |
2.5 |
|
|
|
|
|
|
|
|
|
|
|
|
|
|
| max. difference between log2-ratios excluding lowest and highest 5%: |
0.4 |
|
|
|
|
|
|
|
|
|
|
|
|
|
|
| Pathway |
Source |
Scores of Genes |
p[Score] |
No. of Genes |
p[genes] |
Link to hormones heatmap |
|
|
|
|
|
|
|
|
|
| Cell Wall Carbohydrate Metabolism |
BioPath |
89 |
0.000 |
22 |
0.000 |
|
|
|
|
|
|
|
|
| pectin metabolism |
BioPath |
67 |
0.000 |
18 |
0.000 |
|
|
|
|
|
|
|
| mono-/sesqui-/di-terpene biosynthesis |
LitPath |
54 |
0.000 |
6 |
0.000 |
|
|
|
|
|
|
|
| terpenoid metabolism |
LitPath |
54 |
0.000 |
6 |
0.000 |
|
|
|
|
|
|
|
| Miscellaneous acyl lipid metabolism |
AcylLipid |
44 |
0.000 |
16 |
0.000 |
|
|
|
|
|
|
|
| Starch and sucrose metabolism |
KEGG |
42 |
0.000 |
6 |
0.000 |
|
|
|
|
|
|
|
| core phenylpropanoid metabolism |
BioPath |
22 |
0.000 |
3 |
0.009 |
|
|
|
|
|
|
|
| Phenylpropanoid Metabolism |
BioPath |
22 |
0.012 |
3 |
0.409 |
|
|
|
|
|
|
|
| Phenylpropanoid pathway |
LitPath |
22 |
0.043 |
3 |
0.247 |
|
|
|
|
|
|
|
|
|
|
|
|
|
| sexual reproduction |
TAIR-GO |
20 |
0.000 |
5 |
0.000 |
|
|
|
|
|
|
|
|
|
|
|
|
|
| monoterpene biosynthesis |
LitPath |
20 |
0.000 |
2 |
0.000 |
|
|
|
|
|
|
|
|
|
|
|
|
|
| Fatty acid elongation and wax and cutin metabolism |
AcylLipid |
19 |
0.000 |
5 |
0.038 |
|
|
|
|
|
|
|
|
|
|
|
|
|
| sucrose metabolism |
BioPath |
16 |
0.000 |
2 |
0.005 |
|
|
|
|
|
|
|
|
|
|
|
|
|
| Galactose metabolism |
KEGG |
16 |
0.000 |
2 |
0.003 |
|
|
|
|
|
|
|
|
|
|
|
|
|
| biogenesis of cell wall |
FunCat |
14 |
0.000 |
6 |
0.000 |
|
|
|
|
|
|
|
|
|
|
|
|
|
| C-compound and carbohydrate utilization |
FunCat |
14 |
0.000 |
2 |
0.000 |
|
|
|
|
|
|
|
|
|
|
|
|
|
| fatty acid metabolism |
TAIR-GO |
13 |
0.000 |
2 |
0.002 |
|
|
|
|
|
|
|
|
|
|
|
|
|
| jasmonic acid biosynthesis |
TAIR-GO |
10 |
0.000 |
1 |
0.018 |
|
|
|
|
|
|
|
|
|
|
|
|
|
| jasmonic acid mediated signaling pathway |
TAIR-GO |
10 |
0.000 |
1 |
0.000 |
|
|
|
|
|
|
|
|
|
|
|
|
|
| jasmonic acid metabolism |
TAIR-GO |
10 |
0.000 |
1 |
0.000 |
|
|
|
|
|
|
|
|
|
|
|
|
|
| monoterpenoid biosynthesis |
TAIR-GO |
10 |
0.000 |
1 |
0.001 |
|
|
|
|
|
|
|
|
|
|
|
|
|
| N-terminal protein myristoylation |
TAIR-GO |
10 |
0.000 |
1 |
0.006 |
|
|
|
|
|
|
|
|
|
|
|
|
|
| pentacyclic triterpenoid biosynthesis |
TAIR-GO |
10 |
0.000 |
1 |
0.003 |
|
|
|
|
|
|
|
|
|
|
|
|
|
| response to wounding |
TAIR-GO |
10 |
0.000 |
1 |
0.024 |
|
|
|
|
|
|
|
|
|
|
|
|
|
| jasmonic acid biosynthesis |
AraCyc |
10 |
0.000 |
1 |
0.002 |
|
|
|
|
|
|
|
|
|
|
|
|
|
| monoterpene biosynthesis |
AraCyc |
10 |
0.000 |
1 |
0.000 |
|
|
|
|
|
|
|
|
|
|
|
|
|
| plant monoterpene biosynthesis |
AraCyc |
10 |
0.000 |
1 |
0.000 |
|
|
|
|
|
|
|
|
|
|
|
|
|
| C-compound, carbohydrate catabolism |
FunCat |
10 |
0.000 |
3 |
0.003 |
|
|
|
|
|
|
|
|
|
|
|
|
|
| Biosynthesis of steroids |
KEGG |
10 |
0.000 |
1 |
0.064 |
|
|
|
|
|
|
|
|
|
|
|
|
|
| sequiterpene biosynthesis |
LitPath |
10 |
0.000 |
1 |
0.001 |
|
|
|
|
|
|
|
|
|
|
|
|
|
| triterpene biosynthesis |
LitPath |
10 |
0.000 |
1 |
0.039 |
|
|
|
|
|
|
|
|
|
|
|
|
|
| cellulose biosynthesis |
AraCyc |
8 |
0.000 |
2 |
0.000 |
|
|
|
|
|
|
|
|
|
|
|
|
|
| lactose degradation IV |
AraCyc |
8 |
0.000 |
2 |
0.000 |
|
|
|
|
|
|
|
|
|
|
|
|
|
| transport |
FunCat |
8 |
0.000 |
3 |
0.000 |
|
|
|
|
|
|
|
|
|
|
|
|
|
| Oxidative phosphorylation |
KEGG |
8 |
0.000 |
2 |
0.027 |
|
|
|
|
|
|
|
|
|
|
|
|
|
|
|
|
|
|
|
|
|
|
|
|
|
|
|
|
|
|
|
|
|
|
|
|
|
|
|
|
|
|
|
|
|
|
|
|
|
|
|
|
|
|
|
|
|
|
|
|
|
|
|
|
|
|
|
|
|
|
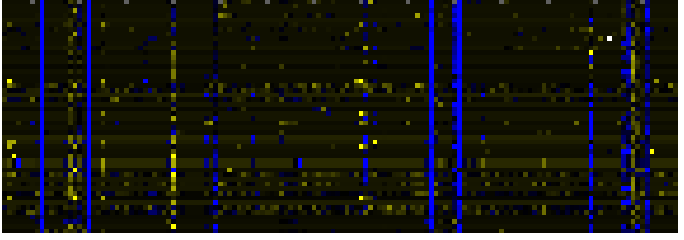
| Pathways co-expressed in the Mutant data set (with more than 6 annotation points) |
|
CYP86C3 (At1g13140) |
|
|
|
|
|
|
|
|
|
|
| max. difference between log2-ratios: |
7.1 |
|
|
|
|
|
|
|
|
|
|
|
|
|
|
| max. difference between log2-ratios excluding lowest and highest 5%: |
1.4 |
|
|
|
|
|
|
|
|
|
|
|
|
|
|
| Pathway |
Source |
Scores of Genes |
p[Score] |
No. of Genes |
p[genes] |
Link to mutants heatmap |
|
|
|
|
|
|
|
|
|
| Cell Wall Carbohydrate Metabolism |
BioPath |
89 |
0.000 |
21 |
0.000 |
|
|
|
|
|
| pectin metabolism |
BioPath |
73 |
0.000 |
18 |
0.000 |
|
|
|
|
| Miscellaneous acyl lipid metabolism |
AcylLipid |
52 |
0.000 |
20 |
0.000 |
|
|
|
|
| C-compound and carbohydrate metabolism |
FunCat |
40 |
0.000 |
12 |
0.008 |
|
|
|
|
| Starch and sucrose metabolism |
KEGG |
33 |
0.000 |
6 |
0.000 |
|
|
|
|
| Phenylpropanoid pathway |
LitPath |
31 |
0.000 |
7 |
0.000 |
|
|
|
|
| Phenylpropanoid Metabolism |
BioPath |
29 |
0.021 |
7 |
0.086 |
|
|
|
|
| biogenesis of cell wall |
FunCat |
28 |
0.000 |
9 |
0.000 |
|
|
|
|
| Glycan Biosynthesis and Metabolism |
KEGG |
26 |
0.000 |
4 |
0.002 |
|
|
|
|
| core phenylpropanoid metabolism |
BioPath |
24 |
0.000 |
4 |
0.006 |
|
|
|
|
| Isoprenoid Biosynthesis in the Cytosol and in Mitochondria |
BioPath |
20 |
0.001 |
3 |
0.086 |
|
|
|
|
| sexual reproduction |
TAIR-GO |
20 |
0.000 |
5 |
0.000 |
|
|
|
|
| glycolysis and gluconeogenesis |
FunCat |
16 |
0.029 |
4 |
0.143 |
|
|
|
|
| Fatty acid elongation and wax and cutin metabolism |
AcylLipid |
16 |
0.015 |
6 |
0.082 |
|
|
|
|
| Glutamate/glutamine from nitrogen fixation |
BioPath |
14 |
0.000 |
2 |
0.004 |
|
|
|
|
| lactose degradation IV |
AraCyc |
14 |
0.000 |
4 |
0.000 |
|
|
|
|
|
|
|
|
|
|
|
|
|
| assimilation of ammonia, metabolism of the glutamate group |
FunCat |
14 |
0.000 |
2 |
0.013 |
|
|
|
|
|
|
|
|
|
|
|
|
|
| nitrogen and sulfur metabolism |
FunCat |
14 |
0.000 |
2 |
0.011 |
|
|
|
|
|
|
|
|
|
|
|
|
|
| Glutamate metabolism |
KEGG |
14 |
0.000 |
2 |
0.022 |
|
|
|
|
|
|
|
|
|
|
|
|
|
| Glycerolipid metabolism |
KEGG |
14 |
0.000 |
2 |
0.011 |
|
|
|
|
|
|
|
|
|
|
|
|
|
| Nitrogen metabolism |
KEGG |
14 |
0.000 |
2 |
0.010 |
|
|
|
|
|
|
|
|
|
|
|
|
|
| Oxidative phosphorylation |
KEGG |
14 |
0.000 |
3 |
0.019 |
|
|
|
|
|
|
|
|
|
|
|
|
|
| Biosynthesis of prenyl diphosphates |
BioPath |
12 |
0.018 |
2 |
0.112 |
|
|
|
|
|
|
|
|
|
|
|
|
|
| triacylglycerol degradation |
AraCyc |
12 |
0.000 |
5 |
0.000 |
|
|
|
|
|
|
|
|
|
|
|
|
|
| Galactose metabolism |
KEGG |
12 |
0.000 |
2 |
0.009 |
|
|
|
|
|
|
|
|
|
|
|
|
|
| lignin biosynthesis |
AraCyc |
11 |
0.000 |
5 |
0.000 |
|
|
|
|
|
|
|
|
|
|
|
|
|
| cellulose biosynthesis |
BioPath |
10 |
0.016 |
2 |
0.118 |
|
|
|
|
|
|
|
|
|
|
|
|
|
| gibberellic acid catabolism |
TAIR-GO |
10 |
0.000 |
1 |
0.002 |
|
|
|
|
|
|
|
|
|
|
|
|
|
| ammonia assimilation cycle |
AraCyc |
10 |
0.000 |
1 |
0.011 |
|
|
|
|
|
|
|
|
|
|
|
|
|
| glutamine biosynthesis I |
AraCyc |
10 |
0.000 |
1 |
0.007 |
|
|
|
|
|
|
|
|
|
|
|
|
|
| nitrate assimilation pathway |
AraCyc |
10 |
0.000 |
1 |
0.014 |
|
|
|
|
|
|
|
|
|
|
|
|
|
| polyisoprenoid biosynthesis |
AraCyc |
10 |
0.000 |
2 |
0.002 |
|
|
|
|
|
|
|
|
|
|
|
|
|
| lipid, fatty acid and isoprenoid metabolism |
FunCat |
10 |
0.004 |
4 |
0.003 |
|
|
|
|
|
|
|
|
|
|
|
|
|
| transport |
FunCat |
10 |
0.000 |
3 |
0.000 |
|
|
|
|
|
|
|
|
|
|
|
|
|
| Diterpenoid biosynthesis |
KEGG |
10 |
0.000 |
1 |
0.012 |
|
|
|
|
|
|
|
|
|
|
|
|
|
| Fructose and mannose metabolism |
KEGG |
10 |
0.001 |
2 |
0.026 |
|
|
|
|
|
|
|
|
|
|
|
|
|
| Peptidoglycan biosynthesis |
KEGG |
10 |
0.000 |
1 |
0.002 |
|
|
|
|
|
|
|
|
|
|
|
|
|
| Gibberellin metabolism |
LitPath |
10 |
0.000 |
1 |
0.039 |
|
|
|
|
|
|
|
|
|
|
|
|
|
| giberelin catabolism |
LitPath |
10 |
0.000 |
1 |
0.000 |
|
|
|
|
|
|
|
|
|
|
|
|
|
| prenyl diphosphate (GPP,FPP, GGPP) biosynthesis |
LitPath |
10 |
0.000 |
1 |
0.031 |
|
|
|
|
|
|
|
|
|
|
|
|
|
| cytokinin catabolism |
TAIR-GO |
9 |
0.000 |
1 |
0.002 |
|
|
|
|
|
|
|
|
|
|
|
|
|
| induced systemic resistance, jasmonic acid mediated signaling pathway |
TAIR-GO |
9 |
0.000 |
1 |
0.000 |
|
|
|
|
|
|
|
|
|
|
|
|
|
| jasmonic acid and ethylene-dependent systemic resistance |
TAIR-GO |
9 |
0.000 |
1 |
0.000 |
|
|
|
|
|
|
|
|
|
|
|
|
|
| jasmonic acid mediated signaling pathway |
TAIR-GO |
9 |
0.000 |
1 |
0.000 |
|
|
|
|
|
|
|
|
|
|
|
|
|
| photomorphogenesis |
TAIR-GO |
9 |
0.000 |
1 |
0.001 |
|
|
|
|
|
|
|
|
|
|
|
|
|
| protein amino acid adenylylation |
TAIR-GO |
9 |
0.000 |
1 |
0.000 |
|
|
|
|
|
|
|
|
|
|
|
|
|
| red, far-red light phototransduction |
TAIR-GO |
9 |
0.000 |
1 |
0.000 |
|
|
|
|
|
|
|
|
|
|
|
|
|
| response to jasmonic acid stimulus |
TAIR-GO |
9 |
0.000 |
1 |
0.004 |
|
|
|
|
|
|
|
|
|
|
|
|
|
| cytokinins degradation |
AraCyc |
9 |
0.000 |
1 |
0.001 |
|
|
|
|
|
|
|
|
|
|
|
|
|
| hemicellulose biosynthesis |
BioPath |
8 |
0.001 |
1 |
0.067 |
|
|
|
|
|
|
|
|
|
|
|
|
|
| ubiquinone biosynthesis |
BioPath |
8 |
0 |
1 |
0 |
|
|
|
|
|
|
|
|
|
|
|
|
|