| _________________________________________ |
|
|
|
|
|
|
|
|

|
|
|
|
|
|
|
| Pathways co-expressed in all 4 data sets (with more than 6 annotation points each) |
|
Find below a list of pathways that are co-expressed with the bait. First a list of pathways is given that are co-expressed in all data sets. Lists for each individual dataset are shown underneath. Depending on the number of co-expressed pathways only the top scoring pathways are given; all data can be saved as text using the link above. |
|
|
|
|
|
|
| Pathway |
Source |
Sum of scores |
Sum of genes |
|
|
|
|
|
|
|
| plastoquinone biosynthesis |
TAIR-GO |
50 |
5 |
|
|
|
|
|
|
|
| vitamin E biosynthesis |
TAIR-GO |
50 |
5 |
|
|
|
|
|
|
|
| plastoquinone biosynthesis |
AraCyc |
50 |
5 |
|
|
|
|
|
|
|
|
|
| vitamin E biosynthesis |
AraCyc |
50 |
5 |
|
To the right of each table a thumbnail of the actual co-expression heatmap is given. Klick on the link to see the heatmap containing all co-expressed genes. |
|
|
|
|
|
|
|
|
|
|
|
|
|
|
|
|
|
|
|
|
|
|
|
|
|
|
|
|
|
|
|
|
|
|
|
|
|
|
|
For more information on how these pathway maps were generated please read the methods page |
|
|
|
|
|
|
|
|
|
|
|
|
|
|
|
|
|
|
|
|
|
|
|
|
|
|
|
|
|
|
|
|
|
|
|
|
|
|
|
|
|
|
|
|
|
|
|
|
|
|
|
|
|
|
|
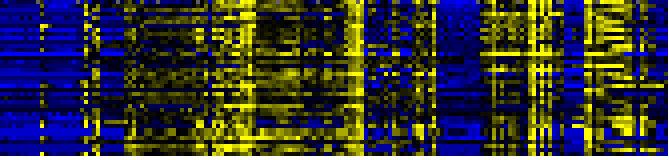
| Pathways co-expressed in the Organ and Tissue data set (with more than 6 annotation points) |
|
CYP89A9 (At3g03470) |
|
|
|
|
|
|
|
|
| max. difference between log2-ratios: |
7.4 |
|
|
|
|
|
|
|
|
|
|
|
|
| max. difference between log2-ratios excluding lowest and highest 5%: |
5.8 |
|
|
|
|
|
|
|
|
|
|
|
|
| Pathway |
Source |
Scores of Genes |
p[Score] |
No. of Genes |
p[genes] |
Link to organ heatmap |
|
|
|
|
|
|
|
| C-compound and carbohydrate utilization |
FunCat |
22 |
0.000 |
3 |
0.000 |
|
|
|
|
|
|
|
|
|
|
|
| Lipid signaling |
AcylLipid |
22 |
0.000 |
4 |
0.026 |
|
|
|
| Phenylpropanoid Metabolism |
BioPath |
21 |
0.000 |
3 |
0.037 |
|
|
| Cell Wall Carbohydrate Metabolism |
BioPath |
20 |
0.012 |
4 |
0.097 |
|
|
| Glucosyltransferases for benzoic acids |
BioPath |
20 |
0.000 |
2 |
0.000 |
|
|
| C-compound, carbohydrate catabolism |
FunCat |
14 |
0.000 |
2 |
0.006 |
|
|
| starch metabolism |
BioPath |
12 |
0.000 |
2 |
0.001 |
|
|
| jasmonic acid biosynthesis |
TAIR-GO |
12 |
0.000 |
2 |
0.000 |
|
|
| jasmonic acid biosynthesis |
AraCyc |
12 |
0.000 |
2 |
0.000 |
|
|
| starch degradation |
AraCyc |
12 |
0.000 |
2 |
0.000 |
|
|
| energy |
FunCat |
12 |
0.000 |
2 |
0.000 |
|
|
| metabolism of energy reserves (e.g. glycogen, trehalose) |
FunCat |
12 |
0.000 |
2 |
0.000 |
|
|
|
|
|
|
|
|
|
|
|
| Starch and sucrose metabolism |
KEGG |
12 |
0.000 |
2 |
0.012 |
|
|
|
|
|
|
|
|
|
|
|
| Valine, leucine and isoleucine degradation |
KEGG |
12 |
0.000 |
3 |
0.000 |
|
|
|
|
|
|
|
|
|
|
|
|
|
|
|
|
|
|
|
|
|
|
|
|
|
|
|
|
|
|
|
|
|
|
|
|
|
|
|
|
|
|
|
|
|
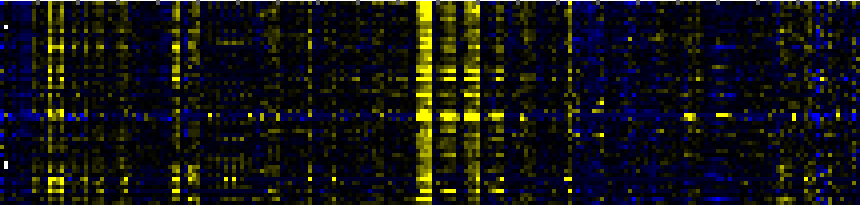
| Pathways co-expressed in the Stress data set ( with more than 18 annotation points) |
|
CYP89A9 (At3g03470) |
|
|
|
|
|
|
|
|
| max. difference between log2-ratios: |
8.1 |
|
|
|
|
|
|
|
|
|
|
|
|
| max. difference between log2-ratios excluding lowest and highest 5%: |
3.0 |
|
|
|
|
|
|
|
|
|
|
|
|
| Pathway |
Source |
Scores of Genes |
p[Score] |
No. of Genes |
p[genes] |
Link to stress heatmap |
|
|
|
|
|
|
|
| Degradation of storage lipids and straight fatty acids |
AcylLipid |
60 |
0.000 |
8 |
0.000 |
|
|
|
|
|
|
|
|
|
|
|
| Gluconeogenesis from lipids in seeds |
BioPath |
58 |
0.000 |
7 |
0.000 |
|
| Fatty acid metabolism |
KEGG |
54 |
0.000 |
7 |
0.000 |
| fatty acid beta oxidation complex |
BioPath |
48 |
0.000 |
6 |
0.000 |
| Biosynthesis of Amino Acids and Derivatives |
BioPath |
42 |
0.000 |
6 |
0.031 |
| Valine, leucine and isoleucine degradation |
KEGG |
40 |
0.000 |
7 |
0.000 |
| leucine degradation I |
AraCyc |
38 |
0.000 |
5 |
0.000 |
| leucine degradation II |
AraCyc |
38 |
0.000 |
5 |
0.000 |
| Glutathione metabolism |
BioPath |
30 |
0.000 |
4 |
0.008 |
| beta-Alanine metabolism |
KEGG |
29 |
0.000 |
5 |
0.000 |
| fatty acid oxidation pathway |
AraCyc |
28 |
0.000 |
4 |
0.000 |
| isoleucine degradation I |
AraCyc |
28 |
0.000 |
4 |
0.001 |
| isoleucine degradation III |
AraCyc |
28 |
0.000 |
4 |
0.000 |
| lipid, fatty acid and isoprenoid degradation |
FunCat |
24 |
0.000 |
4 |
0.000 |
| stress response |
FunCat |
24 |
0.000 |
3 |
0.000 |
|
|
|
|
|
|
|
|
|
|
|
| C-compound and carbohydrate utilization |
FunCat |
22 |
0.000 |
3 |
0.000 |
|
|
|
|
|
|
|
|
|
|
|
| Bile acid biosynthesis |
KEGG |
22 |
0.000 |
3 |
0.001 |
|
|
|
|
|
|
|
|
|
|
|
| amino acid metabolism |
FunCat |
21 |
0.000 |
3 |
0.060 |
|
|
|
|
|
|
|
|
|
|
|
| Arginine and proline metabolism |
KEGG |
21 |
0.000 |
3 |
0.034 |
|
|
|
|
|
|
|
|
|
|
|
| Nucleotide Metabolism |
KEGG |
21 |
0.005 |
3 |
0.186 |
|
|
|
|
|
|
|
|
|
|
|
| carotenoid biosynthesis |
TAIR-GO |
20 |
0.000 |
2 |
0.001 |
|
|
|
|
|
|
|
|
|
|
|
| fatty acid metabolism |
TAIR-GO |
20 |
0.000 |
2 |
0.025 |
|
|
|
|
|
|
|
|
|
|
|
| long-chain fatty acid metabolism |
TAIR-GO |
20 |
0.000 |
2 |
0.009 |
|
|
|
|
|
|
|
|
|
|
|
| Tyrosine metabolism |
KEGG |
20 |
0.000 |
4 |
0.006 |
|
|
|
|
|
|
|
|
|
|
|
|
|
|
|
|
|
|
|
|
|
|
|
|
|
|
|
|
|
|
|
|
|
|
|
|
|
|
|
|
|
|
|
|
|
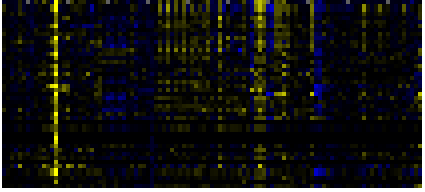
| Pathways co-expressed in the Hormone etc. data set (with more than 10 annotation points) |
|
CYP89A9 (At3g03470) |
|
|
|
|
|
|
|
|
| max. difference between log2-ratios: |
5.4 |
|
|
|
|
|
|
|
|
|
|
|
|
| max. difference between log2-ratios excluding lowest and highest 5%: |
1.9 |
|
|
|
|
|
|
|
|
|
|
|
|
| Pathway |
Source |
Scores of Genes |
p[Score] |
No. of Genes |
p[genes] |
Link to hormones etc. heatmap |
|
|
|
|
|
|
|
| Valine, leucine and isoleucine degradation |
KEGG |
29 |
0.000 |
5 |
0.000 |
|
|
|
|
|
|
|
|
|
|
|
| Phenylpropanoid Metabolism |
BioPath |
28 |
0.000 |
3 |
0.057 |
|
|
|
|
|
|
| metabolism of acyl-lipids in mitochondria |
AcylLipid |
23 |
0.000 |
3 |
0.002 |
|
|
|
|
|
| amino acid metabolism |
FunCat |
22 |
0.000 |
3 |
0.027 |
|
|
|
|
|
| Biosynthesis of Amino Acids and Derivatives |
BioPath |
20 |
0.011 |
2 |
0.171 |
|
|
|
|
|
| Prolin/Hydroxyproline from glutamate |
BioPath |
20 |
0.000 |
2 |
0.000 |
|
|
|
|
|
| hyperosmotic salinity response |
TAIR-GO |
20 |
0.000 |
2 |
0.000 |
|
|
|
|
|
| proline biosynthesis |
TAIR-GO |
20 |
0.000 |
2 |
0.000 |
|
|
|
|
|
| response to abscisic acid stimulus |
TAIR-GO |
20 |
0.000 |
2 |
0.000 |
|
|
|
|
|
| Urea cycle and metabolism of amino groups |
KEGG |
20 |
0.000 |
2 |
0.002 |
|
|
|
|
|
| leucine catabolism |
TAIR-GO |
19 |
0.000 |
2 |
0.000 |
|
|
|
|
|
| leucine degradation I |
AraCyc |
19 |
0.000 |
2 |
0.003 |
|
|
|
|
|
| leucine degradation II |
AraCyc |
19 |
0.000 |
2 |
0.000 |
|
|
|
|
|
| phenylalanine degradation I |
AraCyc |
16 |
0.000 |
2 |
0.004 |
|
|
|
|
|
|
|
|
|
|
|
| tyrosine degradation |
AraCyc |
16 |
0.000 |
2 |
0.000 |
|
|
|
|
|
|
|
|
|
|
|
| Tyrosine metabolism |
KEGG |
16 |
0.000 |
2 |
0.009 |
|
|
|
|
|
|
|
|
|
|
|
| Fatty acid metabolism |
KEGG |
14 |
0.000 |
2 |
0.006 |
|
|
|
|
|
|
|
|
|
|
|
| Degradation of storage lipids and straight fatty acids |
AcylLipid |
14 |
0.000 |
3 |
0.009 |
|
|
|
|
|
|
|
|
|
|
|
| Ascorbate and aldarate metabolism |
KEGG |
12 |
0.000 |
2 |
0.002 |
|
|
|
|
|
|
|
|
|
|
|
| Basal transcription factors |
KEGG |
12 |
0.000 |
2 |
0.006 |
|
|
|
|
|
|
|
|
|
|
|
| Transcription |
KEGG |
12 |
0.000 |
2 |
0.049 |
|
|
|
|
|
|
|
|
|
|
|
| Phenylpropanoid pathway |
LitPath |
12 |
0.000 |
2 |
0.013 |
|
|
|
|
|
|
|
|
|
|
|
|
|
|
|
|
|
|
|
|
|
|
|
|
|
|
|
|