| _________________________________________ |
|
|
|
|
|
|
|
|
|
|
|
|
|
|
|
|
| Pathways co-expressed in the 3 applicable data sets (with more than 6 annotation points each) |
|
Find below a list of pathways that are co-expressed with the bait. First a list of pathways is given that are co-expressed in all data sets. Lists for each individual dataset are shown underneath. Depending on the number of co-expressed pathways only the top scoring pathways are given; all data can be saved as text using the link above. |

|
|
|
|
|
|
|
|
| Pathway |
Source |
Sum of scores |
Sum of genes |
|
|
|
|
|
|
|
|
| jasmonic acid biosynthesis |
TAIR-GO |
188 |
26 |
|
|
|
|
|
|
|
|
| jasmonic acid biosynthesis |
TAIR-GO |
188 |
26 |
|
|
|
|
|
|
|
|
| Lipid signaling |
AcylLipid |
104 |
14 |
|
|
|
|
|
|
|
|
| response to wounding |
TAIR-GO |
90 |
12 |
|
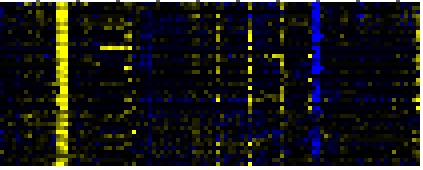
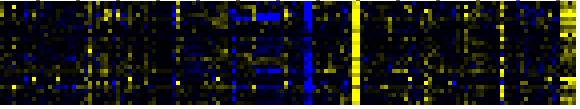
To the right of each table a thumbnail of the actual co-expression heatmap is given. Klick on the link to see the heatmap containing all co-expressed genes. |
|
|
|
|
|
|
|
|
|
| lipoxygenase pathway |
AraCyc |
74 |
11 |
|
|
|
|
|
|
|
|
|
|
|
|
|
|
|
|
|
|
|
|
|
|
|
|
|
|
|
|
|
For more information on how these pathway maps were generated please read the methods page |
|
|
|
|
|
|
|
|
|
|
|
|
|
|
|
|
|
|
|
|
|
|
|
|
|
|
|
|
|
|
|
|
|
|
|
|
|
|
|
|
|
|
|
|
|
|
|
|
|
|
|
|
|
|
|
|
|
| Pathways co-expressed in the Stress data set ( with more than 10 annotation points) |
|
CYP94B1 (At5g63450) |
|
|
|
|
|
|
|
|
| max. difference between log2-ratios: |
6.6 |
|
|
|
|
|
|
|
|
|
|
|
|
| max. difference between log2-ratios excluding lowest and highest 5%: |
2.8 |
|
|
|
|
|
|
|
|
|
|
|
|
| Pathway |
Source |
Scores of Genes |
p[Score] |
No. of Genes |
p[genes] |
Link to stress heatmap |
|
|
|
|
|
|
|
| jasmonic acid biosynthesis |
TAIR-GO |
22 |
0.000 |
3 |
0.000 |

|
| jasmonic acid biosynthesis |
AraCyc |
22 |
0.000 |
3 |
0.000 |
| Lipid signaling |
AcylLipid |
22 |
0.000 |
3 |
0.037 |
| response to wounding |
TAIR-GO |
16 |
0.000 |
2 |
0.000 |
| lipid, fatty acid and isoprenoid metabolism |
FunCat |
14 |
0.000 |
2 |
0.000 |
|
|
|
|
|
|
|
|
|
|
|
| lipoxygenase pathway |
AraCyc |
12 |
0.000 |
2 |
0.000 |
|
|
|
|
|
|
|
|
|
|
|
| Cell Wall Carbohydrate Metabolism |
BioPath |
10 |
0.002 |
1 |
0.168 |
|
|
|
|
|
|
|
|
|
|
|
| cellulose biosynthesis |
BioPath |
10 |
0.000 |
1 |
0.004 |
|
|
|
|
|
|
|
|
|
|
|
| Leaf Glycerolipid Biosynthesis |
BioPath |
10 |
0.000 |
1 |
0.054 |
|
|
|
|
|
|
|
|
|
|
|
| Leaf Glycerolipid Biosynthesis in Plastid |
BioPath |
10 |
0.000 |
1 |
0.006 |
|
|
|
|
|
|
|
|
|
|
|
| chloroplast envelope |
TAIR-GO |
10 |
0.000 |
1 |
0.000 |
|
|
|
|
|
|
|
|
|
|
|
| galactolipid biosynthesis |
TAIR-GO |
10 |
0.000 |
1 |
0.000 |
|
|
|
|
|
|
|
|
|
|
|
| glycolipid biosynthesis |
TAIR-GO |
10 |
0.000 |
1 |
0.000 |
|
|
|
|
|
|
|
|
|
|
|
| lipid biosynthesis |
TAIR-GO |
10 |
0.000 |
1 |
0.000 |
|
|
|
|
|
|
|
|
|
|
|
| cellulose biosynthesis |
AraCyc |
10 |
0.000 |
1 |
0.003 |
|
|
|
|
|
|
|
|
|
|
|
| glycosylglyceride biosynthesis |
AraCyc |
10 |
0.000 |
1 |
0.000 |
|
|
|
|
|
|
|
|
|
|
|
| Synthesis of membrane lipids in plastids |
AcylLipid |
10 |
0.000 |
1 |
0.018 |
|
|
|
|
|
|
|
|
|
|
|
|
|
|
|
|
|
|
|
|
|
|
|
|
|
|
|
|
|
|
|
|
|
|
|
|
|
|
|
|
|
|
|
|
|
| Pathways co-expressed in the Hormone etc. data set (with more than 6 annotation points) |
|
CYP94B1 (At5g63450) |
|
|
|
|
|
|
|
|
| max. difference between log2-ratios: |
7.7 |
|
|
|
|
|
|
|
|
|
|
|
|
| max. difference between log2-ratios excluding lowest and highest 5%: |
2.6 |
|
|
|
|
|
|
|
|
|
|
|
|
| Pathway |
Source |
Scores of Genes |
p[Score] |
No. of Genes |
p[genes] |
Link to hormones etc. heatmap |
|
|
|
|
|
|
|
| Lipid signaling |
AcylLipid |
46 |
0.000 |
6 |
0.001 |
|
|
|
|
|
|
| jasmonic acid biosynthesis |
TAIR-GO |
36 |
0.000 |
5 |
0.000 |
|
|
|
|
|
| jasmonic acid biosynthesis |
AraCyc |
36 |
0.000 |
5 |
0.000 |
|
|
|
|
|
| lipoxygenase pathway |
AraCyc |
36 |
0.000 |
5 |
0.000 |
|
|
|
|
|
| response to wounding |
TAIR-GO |
30 |
0.000 |
4 |
0.000 |
|
|
|
|
|
| Isoprenoid Biosynthesis in the Cytosol and in Mitochondria |
BioPath |
20 |
0.000 |
2 |
0.011 |
|
|
|
|
|
| oxylipin pathway |
LitPath |
20 |
0.000 |
2 |
0.000 |
|
|
|
|
|
| defense response |
TAIR-GO |
17 |
0.000 |
3 |
0.000 |
|
|
|
|
|
| transport |
FunCat |
13 |
0.000 |
3 |
0.000 |
|
|
|
|
|
| transport facilitation |
FunCat |
13 |
0.000 |
3 |
0.000 |
|
|
|
|
|
| transport ATPases |
FunCat |
11 |
0.000 |
2 |
0.002 |
|
|
|
|
|
| Glutathione metabolism |
KEGG |
11 |
0.000 |
2 |
0.001 |
|
|
|
|
|
|
|
|
|
|
|
| Biosynthesis of prenyl diphosphates |
BioPath |
10 |
0.000 |
1 |
0.042 |
|
|
|
|
|
|
|
|
|
|
|
| Chlorophyll biosynthesis and breakdown |
BioPath |
10 |
0.000 |
1 |
0.025 |
|
|
|
|
|
|
|
|
|
|
|
| Plastidial Isoprenoids (Chlorophylls, Carotenoids, Tocopherols, Plastoquinone, Phylloquinone) |
BioPath |
10 |
0.007 |
1 |
0.128 |
|
|
|
|
|
|
|
|
|
|
|
| sterol biosynthesis |
BioPath |
10 |
0.000 |
1 |
0.016 |
|
|
|
|
|
|
|
|
|
|
|
| sucrose metabolism |
BioPath |
10 |
0.000 |
1 |
0.009 |
|
|
|
|
|
|
|
|
|
|
|
| chlorophyll catabolism |
TAIR-GO |
10 |
0.000 |
1 |
0.001 |
|
|
|
|
|
|
|
|
|
|
|
| growth |
TAIR-GO |
10 |
0.000 |
2 |
0.003 |
|
|
|
|
|
|
|
|
|
|
|
| response to jasmonic acid stimulus |
TAIR-GO |
10 |
0.000 |
1 |
0.003 |
|
|
|
|
|
|
|
|
|
|
|
| response to stress |
TAIR-GO |
10 |
0.000 |
1 |
0.001 |
|
|
|
|
|
|
|
|
|
|
|
| sterol biosynthesis |
TAIR-GO |
10 |
0.000 |
1 |
0.028 |
|
|
|
|
|
|
|
|
|
|
|
| sterol biosynthesis |
AraCyc |
10 |
0.000 |
1 |
0.011 |
|
|
|
|
|
|
|
|
|
|
|
| glycolysis and gluconeogenesis |
FunCat |
10 |
0.002 |
1 |
0.213 |
|
|
|
|
|
|
|
|
|
|
|
| lipid, fatty acid and isoprenoid metabolism |
FunCat |
10 |
0.000 |
1 |
0.036 |
|
|
|
|
|
|
|
|
|
|
|
| Fatty acid metabolism |
KEGG |
10 |
0.000 |
1 |
0.010 |
|
|
|
|
|
|
|
|
|
|
|
| Galactose metabolism |
KEGG |
10 |
0.000 |
1 |
0.009 |
|
|
|
|
|
|
|
|
|
|
|
| gamma-Hexachlorocyclohexane degradation |
KEGG |
10 |
0.000 |
1 |
0.003 |
|
|
|
|
|
|
|
|
|
|
|
| Starch and sucrose metabolism |
KEGG |
10 |
0.000 |
1 |
0.046 |
|
|
|
|
|
|
|
|
|
|
|
| Tryptophan metabolism |
KEGG |
10 |
0.000 |
1 |
0.010 |
|
|
|
|
|
|
|
|
|
|
|
| brassinosteroid biosynthesis |
LitPath |
10 |
0.001 |
1 |
0.084 |
|
|
|
|
|
|
|
|
|
|
|
| chlorophyll and phytochromobilin metabolism |
LitPath |
10 |
0.038 |
1 |
0.180 |
|
|
|
|
|
|
|
|
|
|
|
| chlorophyll catabolism |
LitPath |
10 |
0.000 |
1 |
0.002 |
|
|
|
|
|
|
|
|
|
|
|
| prenyl diphosphate (GPP,FPP, GGPP) biosynthesis |
LitPath |
10 |
0.000 |
1 |
0.046 |
|
|
|
|
|
|
|
|
|
|
|
| sterol and brassinosteroid biosynthesis |
LitPath |
10 |
0.000 |
1 |
0.046 |
|
|
|
|
|
|
|
|
|
|
|
| salicylic acid biosynthesis |
TAIR-GO |
7 |
0.000 |
1 |
0.000 |
|
|
|
|
|
|
|
|
|
|
|
| Oxidative phosphorylation |
KEGG |
7 |
0.000 |
1 |
0.044 |
|
|
|
|
|
|
|
|
|
|
|
|
|
|
|
|
|
|
|
|
|
|
|
|
|
|
|
|
|
|
|
|
|
|
|
|
|
|
|
|
|
|
|
|
|
| Pathways co-expressed in the Mutant data set (with more than 10 annotation points) |
|
CYP94B1 (At5g63450) |
|
|
|
|
|
|
|
|
| max. difference between log2-ratios: |
6.0 |
|
|
|
|
|
|
|
|
|
|
|
|
| max. difference between log2-ratios excluding lowest and highest 5%: |
2.5 |
|
|
|
|
|
|
|
|
|
|
|
|
| Pathway |
Source |
Scores of Genes |
p[Score] |
No. of Genes |
p[genes] |
Link to mutants heatmap |
|
|
|
|
|
|
|
| response to wounding |
TAIR-GO |
44 |
0.000 |
6 |
0.000 |
|
|
|
|
| jasmonic acid biosynthesis |
TAIR-GO |
36 |
0.000 |
5 |
0.000 |
|
|
|
| jasmonic acid biosynthesis |
AraCyc |
36 |
0.000 |
5 |
0.000 |
|
|
|
| Lipid signaling |
AcylLipid |
36 |
0.000 |
5 |
0.019 |
|
|
|
| Phenylpropanoid Metabolism |
BioPath |
26 |
0.000 |
4 |
0.000 |
|
|
|
| lipoxygenase pathway |
AraCyc |
26 |
0.000 |
4 |
0.000 |
|
|
|
| Aromatic amino acid (Phe, Tyr, Trp) metabolism |
BioPath |
24 |
0.000 |
3 |
0.000 |
|
|
|
| tryptophan biosynthesis |
TAIR-GO |
24 |
0.000 |
3 |
0.000 |
|
|
|
|
|
|
|
|
|
|
|
| tryptophan biosynthesis |
AraCyc |
24 |
0.000 |
3 |
0.000 |
|
|
|
|
|
|
|
|
|
|
|
| Shikimate pathway |
LitPath |
24 |
0.000 |
3 |
0.003 |
|
|
|
|
|
|
|
|
|
|
|
| Trp biosyntesis |
LitPath |
24 |
0.000 |
3 |
0.000 |
|
|
|
|
|
|
|
|
|
|
|
| Phenylalanine, tyrosine and tryptophan biosynthesis |
KEGG |
20 |
0.000 |
2 |
0.000 |
|
|
|
|
|
|
|
|
|
|
|
| response to pathogenic bacteria |
TAIR-GO |
14 |
0.000 |
2 |
0.000 |
|
|
|
|
|
|
|
|
|
|
|
| anthranilate synthase complex |
TAIR-GO |
10 |
0.000 |
1 |
0.000 |
|
|
|
|
|
|
|
|
|
|
|
| defense response |
TAIR-GO |
10 |
0.000 |
2 |
0.002 |
|
|
|
|
|
|
|
|
|
|
|
| growth |
TAIR-GO |
10 |
0.000 |
2 |
0.003 |
|
|
|
|
|
|
|
|
|
|
|
| response to jasmonic acid stimulus |
TAIR-GO |
10 |
0.000 |
1 |
0.003 |
|
|
|
|
|
|
|
|
|
|
|
| oxylipin pathway |
LitPath |
10 |
0.000 |
1 |
0.000 |
|
|
|
|
|
|
|
|
|
|
|
|
|
|
|
|
|
|
|
|
|
|
|
|
|
|
|
|