| _________________________________________ |
|
|
|
|
|
|
|
|
|
|
|
|
|
|
|
|
| Pathways co-expressed in the 2 data sets with co-expressed pathways (with more than 6 annotation points each) |
|
Find below a list of pathways that are co-expressed with the bait. First a list of pathways is given that are co-expressed in all data sets. Lists for each individual dataset are shown underneath. Depending on the number of co-expressed pathways only the top scoring pathways are given; all data can be saved as text using the link above. |
|
|
|
|
|
|
|
|
| Pathway |
Source |
Sum of scores |
Sum of genes |
|
|
|
|
|
|
|
|
| Biosynthesis of Amino Acids and Derivatives |
BioPath |
70 |
12 |
|
|
|
|
|
|
|
|
| Methionin/SAM/ethylene metabolism from cysteine and aspartate |
BioPath |
50 |
8 |
|
|
|
|
|
|
|
|
| Benzoate degradation via CoA ligation |
KEGG |
39 |
15 |
|
|
|
|
|
|
|
|
| Inositol phosphate metabolism |
KEGG |
39 |
15 |
|
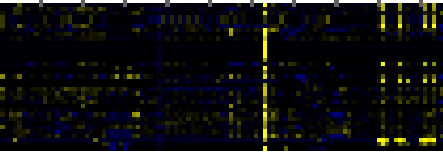
To the right of each table a thumbnail of the actual co-expression heatmap is given. Klick on the link to see the heatmap containing all co-expressed genes. |
|
|
|
|
|
|
|
|
|
| Nicotinate and nicotinamide metabolism |
KEGG |
39 |
15 |
|
|
|
|
|
|
|
|
|
|
| nucleotide metabolism |
FunCat |
24 |
3 |
|
|
|
|
|
|
|
|
|
|
| methionine biosynthesis II |
AraCyc |
19 |
2 |
|
For more information on how these pathway maps were generated please read the methods page |
|
|
|
|
|
|
|
|
|
|
|
|
|
|
|
|
|
|
|
|
|
|
|
|
|
|
|
|
|
|
|
|
|
|
|
|
|
|
|
|
|
|
|
|
|
|
|
|
|
|
|
|
|
|
|
|
|
| Pathways co-expressed in the Hormone etc. data set (with more than 10 annotation points) |
|
CYP96A5 (At2g21910) |
|
|
|
|
|
|
|
|
| max. difference between log2-ratios: |
4.0 |
|
|
|
|
|
|
|
|
|
|
|
|
| max. difference between log2-ratios excluding lowest and highest 5%: |
1.4 |
|
|
|
|
|
|
|
|
|
|
|
|
| Pathway |
Source |
Scores of Genes |
p[Score] |
No. of Genes |
p[genes] |
Link to hormones etc. heatmap |
|
|
|
|
|
|
|
| C-compound and carbohydrate metabolism |
FunCat |
20 |
0.000 |
4 |
0.054 |
|
|
|
|
|
|
|
|
|
|
|
| Biosynthesis of Amino Acids and Derivatives |
BioPath |
18 |
0.000 |
4 |
0.002 |
|
|
|
|
|
| Benzoate degradation via CoA ligation |
KEGG |
18 |
0.000 |
8 |
0.000 |
|
|
|
|
| Inositol phosphate metabolism |
KEGG |
18 |
0.000 |
8 |
0.000 |
|
|
|
|
| Nicotinate and nicotinamide metabolism |
KEGG |
18 |
0.000 |
8 |
0.000 |
|
|
|
|
| Intermediary Carbon Metabolism |
BioPath |
16 |
0.000 |
3 |
0.010 |
|
|
|
|
| Glycolysis / Gluconeogenesis |
KEGG |
16 |
0.000 |
3 |
0.012 |
|
|
|
|
| nucleotide metabolism |
FunCat |
15 |
0.000 |
2 |
0.000 |
|
|
|
|
| purine nucleotide metabolism |
FunCat |
15 |
0.000 |
2 |
0.001 |
|
|
|
|
| allantoin degradation |
AraCyc |
12 |
0.000 |
2 |
0.000 |
|
|
|
|
| isoleucine biosynthesis I |
AraCyc |
12 |
0.000 |
2 |
0.000 |
|
|
|
|
|
|
|
|
|
|
|
| leucine biosynthesis |
AraCyc |
12 |
0.000 |
2 |
0.000 |
|
|
|
|
|
|
|
|
|
|
|
| trans-zeatin biosynthesis |
AraCyc |
12 |
0.000 |
2 |
0.000 |
|
|
|
|
|
|
|
|
|
|
|
| valine biosynthesis |
AraCyc |
12 |
0.000 |
2 |
0.000 |
|
|
|
|
|
|
|
|
|
|
|
| fermentation |
FunCat |
12 |
0.000 |
2 |
0.000 |
|
|
|
|
|
|
|
|
|
|
|
| Methionin/SAM/ethylene metabolism from cysteine and aspartate |
BioPath |
10 |
0.000 |
2 |
0.001 |
|
|
|
|
|
|
|
|
|
|
|
| methionine biosynthesis II |
AraCyc |
9 |
0.000 |
1 |
0.002 |
|
|
|
|
|
|
|
|
|
|
|
| threonine biosynthesis from homoserine |
AraCyc |
9 |
0.000 |
1 |
0.000 |
|
|
|
|
|
|
|
|
|
|
|
| amino acid metabolism |
FunCat |
9 |
0.025 |
1 |
0.199 |
|
|
|
|
|
|
|
|
|
|
|
| pyrimidine nucleotide metabolism |
FunCat |
9 |
0.000 |
1 |
0.008 |
|
|
|
|
|
|
|
|
|
|
|
| Glutathione metabolism |
BioPath |
8 |
0.000 |
2 |
0.006 |
|
|
|
|
|
|
|
|
|
|
|
| glycolysis and gluconeogenesis |
FunCat |
8 |
0.032 |
2 |
0.065 |
|
|
|
|
|
|
|
|
|
|
|
|
|
|
|
|
|
|
|
|
|
|
|
|
|
|
|
|
|
|
|
|
|
|
|
|
|
|
|
|
|
|
|
|
|
|
|
|
|
|
|
|
|
|
|
|
|
|
|
|
|
|
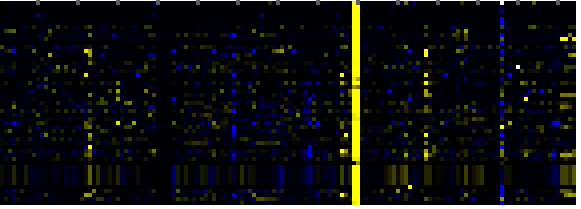
| Pathways co-expressed in the Mutant data set (with more than 6 annotation points) |
|
CYP96A5 (At2g21910) |
|
|
|
|
|
|
|
|
| max. difference between log2-ratios: |
5.9 |
|
|
|
|
|
|
|
|
|
|
|
|
| max. difference between log2-ratios excluding lowest and highest 5%: |
0.3 |
|
|
|
|
|
|
|
|
|
|
|
|
| Pathway |
Source |
Scores of Genes |
p[Score] |
No. of Genes |
p[genes] |
Link to mutants heatmap |
|
|
|
|
|
|
|
| Phenylpropanoid Metabolism |
BioPath |
68 |
0.000 |
10 |
0.002 |
|
|
|
|
| Biosynthesis of Amino Acids and Derivatives |
BioPath |
52 |
0.000 |
8 |
0.015 |
|
|
|
| Shikimate pathway |
LitPath |
48 |
0.000 |
7 |
0.000 |
|
|
|
| Phenylpropanoid pathway |
LitPath |
46 |
0.000 |
8 |
0.009 |
|
|
|
| tryptophan biosynthesis |
TAIR-GO |
44 |
0.000 |
6 |
0.000 |
|
|
|
| tryptophan biosynthesis |
AraCyc |
44 |
0.000 |
6 |
0.000 |
|
|
|
| Trp biosyntesis |
LitPath |
44 |
0.000 |
6 |
0.000 |
|
|
|
| Aromatic amino acid (Phe, Tyr, Trp) metabolism |
BioPath |
42 |
0.000 |
6 |
0.000 |
|
|
|
| Methionin/SAM/ethylene metabolism from cysteine and aspartate |
BioPath |
40 |
0.000 |
6 |
0.000 |
|
|
|
| response to pathogenic bacteria |
TAIR-GO |
34 |
0.000 |
5 |
0.000 |
|
|
|
| Lipid signaling |
AcylLipid |
34 |
0.002 |
11 |
0.019 |
|
|
|
| lignin biosynthesis |
AraCyc |
30 |
0.000 |
5 |
0.000 |
|
|
|
| core phenylpropanoid metabolism |
BioPath |
26 |
0.000 |
4 |
0.004 |
|
|
|
| secondary metabolism |
FunCat |
26 |
0.000 |
5 |
0.002 |
|
|
|
|
|
|
|
|
|
|
|
| Propanoate metabolism |
KEGG |
26 |
0.000 |
4 |
0.001 |
|
|
|
|
|
|
|
|
|
|
|
| biosynthesis of proto- and siroheme |
AraCyc |
24 |
0.000 |
3 |
0.014 |
|
|
|
|
|
|
|
|
|
|
|
| biogenesis of chloroplast |
FunCat |
24 |
0.000 |
3 |
0.043 |
|
|
|
|
|
|
|
|
|
|
|
| Phenylalanine, tyrosine and tryptophan biosynthesis |
KEGG |
22 |
0.000 |
3 |
0.027 |
|
|
|
|
|
|
|
|
|
|
|
| Benzoate degradation via CoA ligation |
KEGG |
21 |
0.000 |
7 |
0.002 |
|
|
|
|
|
|
|
|
|
|
|
| Inositol phosphate metabolism |
KEGG |
21 |
0.000 |
7 |
0.004 |
|
|
|
|
|
|
|
|
|
|
|
| Nicotinate and nicotinamide metabolism |
KEGG |
21 |
0.000 |
7 |
0.001 |
|
|
|
|
|
|
|
|
|
|
|
| Chlorophyll biosynthesis and breakdown |
BioPath |
20 |
0.000 |
2 |
0.042 |
|
|
|
|
|
|
|
|
|
|
|
| ethylene biosynthesis |
TAIR-GO |
20 |
0.000 |
3 |
0.000 |
|
|
|
|
|
|
|
|
|
|
|
| Porphyrin and chlorophyll metabolism |
KEGG |
20 |
0.000 |
2 |
0.034 |
|
|
|
|
|
|
|
|
|
|
|
| chlorophyll and phytochromobilin metabolism |
LitPath |
20 |
0.029 |
2 |
0.212 |
|
|
|
|
|
|
|
|
|
|
|
|
|
|
|
|
|
|
|
|
|
|
|
|
|
|
|
|