| _________________________________________ |
|
|
|
|
|
|
|
|
|
|
|
|
|
|
|
|
| Pathways co-expressed in all 4 data sets (with more than 6 annotation points each) |
|
Find below a list of pathways that are co-expressed with the bait. First a list of pathways is given that are co-expressed in all data sets. Lists for each individual dataset are shown underneath. Depending on the number of co-expressed pathways only the top scoring pathways are given; all data can be saved as text using the link above. |

|
|
|
|
|
|
|
| Pathway |
Source |
Sum of scores |
Sum of genes |
|
|
|
|
|
|
|
| Gibberellin metabolism |
LitPath |
70 |
7 |
|
|
|
|
|
|
|
| giberelin biosynthesis |
LitPath |
70 |
7 |
|
|
|
|
|
|
|
| gibberellic acid biosynthesis |
TAIR-GO |
60 |
6 |
|
|
|
|
|
|
|
| plant / fungal specific systemic sensing and response |
FunCat |
60 |
6 |
|
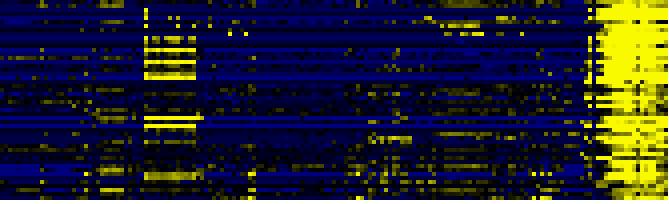
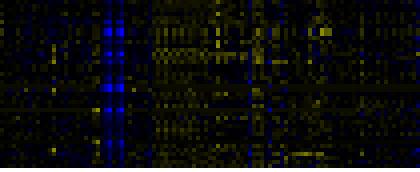
To the right of each table a thumbnail of the actual co-expression heatmap is given. Klick on the link to see the heatmap containing all co-expressed genes. |
|
|
|
|
|
|
|
|
| plant hormonal regulation |
FunCat |
60 |
6 |
|
|
|
|
|
|
|
|
|
| Diterpenoid biosynthesis |
KEGG |
60 |
6 |
|
|
|
|
|
|
|
|
|
| gibberellic acid mediated signaling |
TAIR-GO |
40 |
4 |
|
For more information on how these pathway maps were generated please read the methods page |
|
|
|
|
|
|
|
|
| microsome |
TAIR-GO |
40 |
4 |
|
|
|
|
|
|
|
|
|
| oxygen binding |
TAIR-GO |
40 |
4 |
|
|
|
|
|
|
|
|
|
|
|
|
|
| biosynthesis of derivatives of homoisopentenyl pyrophosphate |
FunCat |
40 |
4 |
|
|
|
|
|
|
|
|
|
|
|
|
|
|
|
|
|
|
|
|
|
|
|
|
|
|
|
|
|
|
|
|
|
|
|
|
|
|
|
|
|
|
|
|
|
|
|
| Pathways co-expressed in the Organ and Tissue data set (with more than 10 annotation points) |
|
CYP701A3, GA3 (At5g25900) |
|
|
|
|
|
|
|
|
| max. difference between log2-ratios: |
4.4 |
|
|
|
|
|
|
|
|
|
|
|
|
| max. difference between log2-ratios excluding lowest and highest 5%: |
3.7 |
|
|
|
|
|
|
|
|
|
|
|
|
| Pathway |
Source |
Scores of Genes |
p[Score] |
No. of Genes |
p[genes] |
Link to organ heatmap |
|
|
|
|
|
|
|
| Miscellaneous acyl lipid metabolism |
AcylLipid |
35 |
0.000 |
6 |
0.227 |
|
|
|
| Synthesis and storage of oil |
AcylLipid |
34 |
0.000 |
9 |
0.000 |
|
|
| Gibberellin metabolism |
LitPath |
30 |
0.000 |
3 |
0.000 |
|
|
| giberelin biosynthesis |
LitPath |
30 |
0.000 |
3 |
0.000 |
|
|
| Pyruvate metabolism |
KEGG |
24 |
0.000 |
4 |
0.002 |
|
|
| glycolysis and gluconeogenesis |
FunCat |
22 |
0.000 |
4 |
0.023 |
|
|
| gibberellic acid biosynthesis |
TAIR-GO |
20 |
0.000 |
2 |
0.000 |
|
|
| lipid, fatty acid and isoprenoid metabolism |
FunCat |
20 |
0.000 |
3 |
0.002 |
|
|
| plant / fungal specific systemic sensing and response |
FunCat |
20 |
0.000 |
2 |
0.002 |
|
|
| plant hormonal regulation |
FunCat |
20 |
0.000 |
2 |
0.002 |
|
|
| Diterpenoid biosynthesis |
KEGG |
20 |
0.000 |
2 |
0.000 |
|
|
| acyl-CoA binding |
TAIR-GO |
19 |
0.000 |
2 |
0.000 |
|
|
| lipid transport |
TAIR-GO |
19 |
0.000 |
2 |
0.000 |
|
|
| Intermediary Carbon Metabolism |
BioPath |
18 |
0.000 |
3 |
0.019 |
|
|
|
|
|
|
|
|
|
|
|
| glyoxylate cycle |
AraCyc |
16 |
0.000 |
2 |
0.011 |
|
|
|
|
|
|
|
|
|
|
|
| TCA cycle variation VII |
AraCyc |
16 |
0.000 |
2 |
0.173 |
|
|
|
|
|
|
|
|
|
|
|
| TCA cycle variation VIII |
AraCyc |
16 |
0.000 |
2 |
0.078 |
|
|
|
|
|
|
|
|
|
|
|
| Glyoxylate and dicarboxylate metabolism |
KEGG |
16 |
0.000 |
2 |
0.005 |
|
|
|
|
|
|
|
|
|
|
|
| transport |
FunCat |
13 |
0.000 |
2 |
0.000 |
|
|
|
|
|
|
|
|
|
|
|
| Gluconeogenesis from lipids in seeds |
BioPath |
11 |
0.000 |
2 |
0.010 |
|
|
|
|
|
|
|
|
|
|
|
| isoleucine degradation I |
AraCyc |
11 |
0.000 |
3 |
0.001 |
|
|
|
|
|
|
|
|
|
|
|
| isoleucine degradation III |
AraCyc |
11 |
0.000 |
3 |
0.000 |
|
|
|
|
|
|
|
|
|
|
|
| leucine degradation I |
AraCyc |
11 |
0.000 |
3 |
0.001 |
|
|
|
|
|
|
|
|
|
|
|
| leucine degradation II |
AraCyc |
11 |
0.000 |
3 |
0.000 |
|
|
|
|
|
|
|
|
|
|
|
| valine degradation I |
AraCyc |
11 |
0.000 |
3 |
0.005 |
|
|
|
|
|
|
|
|
|
|
|
| valine degradation II |
AraCyc |
11 |
0.000 |
3 |
0.000 |
|
|
|
|
|
|
|
|
|
|
|
|
|
|
|
|
|
|
|
|
|
|
|
|
|
|
|
|
|
|
|
|
|
|
|
|
|
|
|
|
|
|
|
|
|
| Pathways co-expressed in the Stress data set ( with more than 6 annotation points) |
|
CYP701A3, GA3 (At5g25900) |
|
|
|
|
|
|
|
|
| max. difference between log2-ratios: |
3.7 |
|
|
|
|
|
|
|
|
|
|
|
|
| max. difference between log2-ratios excluding lowest and highest 5%: |
1.3 |
|
|
|
|
|
|
|
|
|
|
|
|
| Pathway |
Source |
Scores of Genes |
p[Score] |
No. of Genes |
p[genes] |
Link to stress heatmap |
|
|
|
|
|
|
|
| gibberellic acid biosynthesis |
TAIR-GO |
10 |
0.000 |
1 |
0.000 |

|
| gibberellic acid mediated signaling |
TAIR-GO |
10 |
0.000 |
1 |
0.000 |
|
|
|
|
|
|
|
|
|
|
|
| microsome |
TAIR-GO |
10 |
0.000 |
1 |
0.000 |
|
|
|
|
|
|
|
|
|
|
|
| oxygen binding |
TAIR-GO |
10 |
0.000 |
1 |
0.000 |
|
|
|
|
|
|
|
|
|
|
|
| biosynthesis of derivatives of homoisopentenyl pyrophosphate |
FunCat |
10 |
0.000 |
1 |
0.000 |
|
|
|
|
|
|
|
|
|
|
|
| plant / fungal specific systemic sensing and response |
FunCat |
10 |
0.000 |
1 |
0.000 |
|
|
|
|
|
|
|
|
|
|
|
| plant hormonal regulation |
FunCat |
10 |
0.000 |
1 |
0.000 |
|
|
|
|
|
|
|
|
|
|
|
| Diterpenoid biosynthesis |
KEGG |
10 |
0.000 |
1 |
0.000 |
|
|
|
|
|
|
|
|
|
|
|
| Gibberellin metabolism |
LitPath |
10 |
0.000 |
1 |
0.001 |
|
|
|
|
|
|
|
|
|
|
|
| giberelin biosynthesis |
LitPath |
10 |
0.000 |
1 |
0.000 |
|
|
|
|
|
|
|
|
|
|
|
|
|
|
|
|
|
|
|
|
|
|
|
|
|
|
|
|
|
|
|
|
|
|
|
|
|
|
|
|
|
|
|
|
|
| Pathways co-expressed in the Hormone etc. data set (with more than 10 annotation points) |
|
CYP701A3, GA3 (At5g25900) |
|
|
|
|
|
|
|
|
| max. difference between log2-ratios: |
1.9 |
|
|
|
|
|
|
|
|
|
|
|
|
| max. difference between log2-ratios excluding lowest and highest 5%: |
0.9 |
|
|
|
|
|
|
|
|
|
|
|
|
| Pathway |
Source |
Scores of Genes |
p[Score] |
No. of Genes |
p[genes] |
Link to hormones etc. heatmap |
|
|
|
|
|
|
|
| Glutathione metabolism |
KEGG |
22 |
0.000 |
3 |
0.001 |
|
|
|
|
|
|
| gibberellic acid biosynthesis |
TAIR-GO |
20 |
0.000 |
2 |
0.000 |
|
|
|
|
|
| plant / fungal specific systemic sensing and response |
FunCat |
20 |
0.000 |
2 |
0.001 |
|
|
|
|
|
| plant hormonal regulation |
FunCat |
20 |
0.000 |
2 |
0.001 |
|
|
|
|
|
| secondary metabolism |
FunCat |
20 |
0.000 |
2 |
0.014 |
|
|
|
|
|
| Diterpenoid biosynthesis |
KEGG |
20 |
0.000 |
2 |
0.000 |
|
|
|
|
|
| Gibberellin metabolism |
LitPath |
20 |
0.000 |
2 |
0.000 |
|
|
|
|
|
| giberelin biosynthesis |
LitPath |
20 |
0.000 |
2 |
0.000 |
|
|
|
|
|
| oxidative branch of the pentose phosphate pathway |
AraCyc |
19 |
0.000 |
3 |
0.000 |
|
|
|
|
|
| Biosynthesis of Amino Acids and Derivatives |
BioPath |
18 |
0.000 |
3 |
0.009 |
|
|
|
|
|
| toxin catabolism |
TAIR-GO |
14 |
0.000 |
3 |
0.004 |
|
|
|
|
|
| beta-Alanine metabolism |
KEGG |
13 |
0.000 |
3 |
0.000 |
|
|
|
|
|
|
|
|
|
|
|
| Glutathione metabolism |
BioPath |
12 |
0.000 |
2 |
0.005 |
|
|
|
|
|
|
|
|
|
|
|
| Intermediary Carbon Metabolism |
BioPath |
12 |
0.000 |
2 |
0.046 |
|
|
|
|
|
|
|
|
|
|
|
| biosynthesis of phenylpropanoids |
FunCat |
12 |
0.000 |
2 |
0.003 |
|
|
|
|
|
|
|
|
|
|
|
| biosynthesis of secondary products derived from L-phenylalanine and L-tyrosine |
FunCat |
12 |
0.000 |
2 |
0.003 |
|
|
|
|
|
|
|
|
|
|
|
| Pentose phosphate pathway |
KEGG |
12 |
0.000 |
2 |
0.011 |
|
|
|
|
|
|
|
|
|
|
|
| Lipid signaling |
AcylLipid |
12 |
0.000 |
2 |
0.168 |
|
|
|
|
|
|
|
|
|
|
|
| Nucleotide Metabolism |
KEGG |
11 |
0.001 |
2 |
0.057 |
|
|
|
|
|
|
|
|
|
|
|
| Pyrimidine metabolism |
KEGG |
11 |
0.000 |
2 |
0.011 |
|
|
|
|
|
|
|
|
|
|
|
|
|
|
|
|
|
|
|
|
|
|
|
|
|
|
|
|
|
|
|
|
|
|
|
|
|
|
|
|
|
|
|
|
|
|
|
|
|
|
|
|
|
|
|
|
|
|
|
|
|
|
| Pathways co-expressed in the Mutant data set (with more than 6 annotation points) |
|
CYP701A3, GA3 (At5g25900) |
|
|
|
|
|
|
|
|
| max. difference between log2-ratios: |
2.4 |
|
|
|
|
|
|
|
|
|
|
|
|
| max. difference between log2-ratios excluding lowest and highest 5%: |
1.2 |
|
|
|
|
|
|
|
|
|
|
|
|
| Pathway |
Source |
Scores of Genes |
p[Score] |
No. of Genes |
p[genes] |
Link to mutants heatmap |
|
|
|
|
|
|
|
| Valine, leucine and isoleucine degradation |
KEGG |
11 |
0.000 |
2 |
0.000 |

|
|
|
|
| gibberellic acid biosynthesis |
TAIR-GO |
10 |
0.000 |
1 |
0.001 |
|
|
|
| gibberellic acid mediated signaling |
TAIR-GO |
10 |
0.000 |
1 |
0.000 |
|
|
|
|
|
|
|
|
|
|
|
| microsome |
TAIR-GO |
10 |
0.000 |
1 |
0.000 |
|
|
|
|
|
|
|
|
|
|
|
| oxygen binding |
TAIR-GO |
10 |
0.000 |
1 |
0.000 |
|
|
|
|
|
|
|
|
|
|
|
| biosynthesis of derivatives of homoisopentenyl pyrophosphate |
FunCat |
10 |
0.000 |
1 |
0.000 |
|
|
|
|
|
|
|
|
|
|
|
| plant / fungal specific systemic sensing and response |
FunCat |
10 |
0.000 |
1 |
0.000 |
|
|
|
|
|
|
|
|
|
|
|
| plant hormonal regulation |
FunCat |
10 |
0.000 |
1 |
0.000 |
|
|
|
|
|
|
|
|
|
|
|
| Diterpenoid biosynthesis |
KEGG |
10 |
0.000 |
1 |
0.000 |
|
|
|
|
|
|
|
|
|
|
|
| Gibberellin metabolism |
LitPath |
10 |
0.000 |
1 |
0.001 |
|
|
|
|
|
|
|
|
|
|
|
| giberelin biosynthesis |
LitPath |
10 |
0.000 |
1 |
0.000 |
|
|
|
|
|
|
|
|
|
|
|
| leucine catabolism |
TAIR-GO |
9 |
0.000 |
1 |
0.000 |
|
|
|
|
|
|
|
|
|
|
|
| leucine degradation I |
AraCyc |
9 |
0.000 |
1 |
0.001 |
|
|
|
|
|
|
|
|
|
|
|
| leucine degradation II |
AraCyc |
9 |
0.000 |
1 |
0.000 |
|
|
|
|
|
|
|
|
|
|
|
| metabolism of acyl-lipids in mitochondria |
AcylLipid |
9 |
0.000 |
1 |
0.002 |
|
|
|
|
|
|
|
|
|
|
|
| photoreactive repair |
TAIR-GO |
7 |
0.000 |
1 |
0.000 |
|
|
|
|
|
|
|
|
|
|
|
| response to UV |
TAIR-GO |
7 |
0.000 |
1 |
0.001 |
|
|
|
|
|
|
|
|
|
|
|
| Calvin cycle |
AraCyc |
7 |
0.000 |
1 |
0.003 |
|
|
|
|
|
|
|
|
|
|
|
| non-oxidative branch of the pentose phosphate pathway |
AraCyc |
7 |
0.000 |
1 |
0.000 |
|
|
|
|
|
|
|
|
|
|
|
| oxidative branch of the pentose phosphate pathway |
AraCyc |
7 |
0.000 |
1 |
0.000 |
|
|
|
|
|
|
|
|
|
|
|
| ribose degradation |
AraCyc |
7 |
0.000 |
1 |
0.000 |
|
|
|
|
|
|
|
|
|
|
|
| superpathway of gluconate degradation |
AraCyc |
7 |
0.000 |
1 |
0.001 |
|
|
|
|
|
|
|
|
|
|
|
|
|
|
|
|
|
|
|
|
|
|
|
|
|
|
|
|