| _________________________________________ |
|
|
|
|
|
|
|
|

|
|
|
|
|
|
|
| Pathways co-expressed in the 3 data sets with co-expressed pathways (with more than 6 annotation points each) |
|
Find below a list of pathways that are co-expressed with the bait. First a list of pathways is given that are co-expressed in all data sets. Lists for each individual dataset are shown underneath. Depending on the number of co-expressed pathways only the top scoring pathways are given; all data can be saved as text using the link above. |
|
|
|
|
|
|
| Pathway |
Source |
Sum of scores |
Sum of genes |
|
|
|
|
|
|
|
| Biosynthesis of steroids |
KEGG |
77 |
13 |
|
|
|
|
|
|
|
| triterpene, sterol, and brassinosteroid metabolism |
LitPath |
69 |
15 |
|
|
|
|
|
|
|
| triterpene biosynthesis |
LitPath |
47 |
7 |
|
|
|
|
|
|
|
|
|
| isoprenoid biosynthesis |
FunCat |
38 |
7 |
|
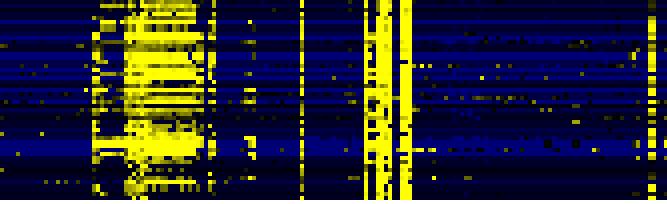
To the right of each table a thumbnail of the actual co-expression heatmap is given. Klick on the link to see the heatmap containing all co-expressed genes. |
|
|
|
|
|
|
|
|
| lipid, fatty acid and isoprenoid biosynthesis |
FunCat |
38 |
7 |
|
|
|
|
|
|
|
|
|
| pentacyclic triterpenoid biosynthesis |
TAIR-GO |
35 |
5 |
|
|
|
|
|
|
|
|
|
| secondary metabolism |
FunCat |
34 |
8 |
|
For more information on how these pathway maps were generated please read the methods page |
|
|
|
|
|
|
|
|
|
|
|
|
|
|
|
|
|
|
|
|
|
|
|
|
|
|
|
|
|
|
|
|
|
|
|
|
|
|
|
|
|
|
|
|
|
|
|
|
|
|
|
|
|
|
|
| Pathways co-expressed in the Organ and Tissue data set (with more than 15 annotation points) |
|
CYP705A12 (At5g42580) |
|
|
|
|
|
|
|
|
| max. difference between log2-ratios: |
5.5 |
|
|
|
|
|
|
|
|
|
|
|
|
| max. difference between log2-ratios excluding lowest and highest 5%: |
2.9 |
|
|
|
|
|
|
|
|
|
|
|
|
| Pathway |
Source |
Scores of Genes |
p[Score] |
No. of Genes |
p[genes] |
Link to organ heatmap |
|
|
|
|
|
|
|
| Stilbene, coumarine and lignin biosynthesis |
KEGG |
58 |
0.000 |
23 |
0.000 |
|
|
|
| Phenylalanine metabolism |
KEGG |
57 |
0.000 |
23 |
0.000 |
|
|
| Methane metabolism |
KEGG |
48 |
0.000 |
22 |
0.000 |
|
|
| Prostaglandin and leukotriene metabolism |
KEGG |
48 |
0.000 |
22 |
0.000 |
|
|
| Cell Wall Carbohydrate Metabolism |
BioPath |
41 |
0.000 |
11 |
0.018 |
|
|
| Phenylpropanoid Metabolism |
BioPath |
34 |
0.000 |
9 |
0.001 |
|
|
| mono-/sesqui-/di-terpene biosynthesis |
LitPath |
31 |
0.000 |
5 |
0.003 |
|
|
| terpenoid metabolism |
LitPath |
31 |
0.000 |
5 |
0.003 |
|
|
| triterpene, sterol, and brassinosteroid metabolism |
LitPath |
28 |
0.000 |
7 |
0.011 |
|
|
| Biosynthesis of steroids |
KEGG |
24 |
0.000 |
4 |
0.014 |
|
|
| pectin metabolism |
BioPath |
21 |
0.000 |
8 |
0.002 |
|
|
| detoxification |
FunCat |
21 |
0.000 |
7 |
0.000 |
|
|
| cellulose biosynthesis |
BioPath |
20 |
0.000 |
3 |
0.009 |
|
|
| Glucosyltransferases for benzoic acids |
BioPath |
20 |
0.000 |
2 |
0.002 |
|
|
|
|
|
|
|
|
|
|
|
| flavonol biosynthesis |
AraCyc |
20 |
0.000 |
5 |
0.000 |
|
|
|
|
|
|
|
|
|
|
|
| Glycan Biosynthesis and Metabolism |
KEGG |
20 |
0.000 |
3 |
0.134 |
|
|
|
|
|
|
|
|
|
|
|
| Miscellaneous acyl lipid metabolism |
AcylLipid |
20 |
0.000 |
9 |
0.000 |
|
|
|
|
|
|
|
|
|
|
|
| triterpene biosynthesis |
LitPath |
20 |
0.000 |
3 |
0.001 |
|
|
|
|
|
|
|
|
|
|
|
| monoterpenoid biosynthesis |
TAIR-GO |
19 |
0.000 |
2 |
0.000 |
|
|
|
|
|
|
|
|
|
|
|
| monoterpene biosynthesis |
LitPath |
19 |
0.000 |
2 |
0.001 |
|
|
|
|
|
|
|
|
|
|
|
| secondary metabolism |
FunCat |
17 |
0.000 |
4 |
0.003 |
|
|
|
|
|
|
|
|
|
|
|
| hemicellulose biosynthesis |
BioPath |
16 |
0.000 |
2 |
0.003 |
|
|
|
|
|
|
|
|
|
|
|
| Fructose and mannose metabolism |
KEGG |
16 |
0.000 |
2 |
0.174 |
|
|
|
|
|
|
|
|
|
|
|
| Glycerolipid metabolism |
KEGG |
16 |
0.000 |
2 |
0.083 |
|
|
|
|
|
|
|
|
|
|
|
|
|
|
|
|
|
|
|
|
|
|
|
|
|
|
|
|
|
|
|
|
|
|
|
|
|
|
|
|
|
|
|
|
|
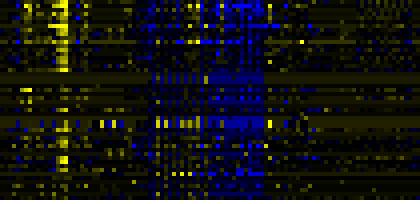
| Pathways co-expressed in the Hormone etc. data set (with more than 10 annotation points) |
|
CYP705A12 (At5g42580) |
|
|
|
|
|
|
|
|
| max. difference between log2-ratios: |
5.0 |
|
|
|
|
|
|
|
|
|
|
|
|
| max. difference between log2-ratios excluding lowest and highest 5%: |
2.2 |
|
|
|
|
|
|
|
|
|
|
|
|
| Pathway |
Source |
Scores of Genes |
p[Score] |
No. of Genes |
p[genes] |
Link to hormones etc. heatmap |
|
|
|
|
|
|
|
| Biosynthesis of steroids |
KEGG |
36 |
0.000 |
6 |
0.000 |
|
|
|
|
|
|
| C-compound and carbohydrate metabolism |
FunCat |
26 |
0.000 |
4 |
0.046 |
|
|
|
|
|
| glycolysis and gluconeogenesis |
FunCat |
26 |
0.000 |
4 |
0.002 |
|
|
|
|
|
| Cell Wall Carbohydrate Metabolism |
BioPath |
24 |
0.013 |
4 |
0.456 |
|
|
|
|
|
| triterpene, sterol, and brassinosteroid metabolism |
LitPath |
22 |
0.000 |
4 |
0.039 |
|
|
|
|
|
| Phenylpropanoid Metabolism |
BioPath |
21 |
0.001 |
6 |
0.006 |
|
|
|
|
|
| sucrose metabolism |
BioPath |
20 |
0.000 |
2 |
0.002 |
|
|
|
|
|
| Galactose metabolism |
KEGG |
20 |
0.000 |
2 |
0.003 |
|
|
|
|
|
| Starch and sucrose metabolism |
KEGG |
20 |
0.000 |
2 |
0.033 |
|
|
|
|
|
| Biosynthesis of prenyl diphosphates |
BioPath |
18 |
0.000 |
3 |
0.002 |
|
|
|
|
|
| Lipid signaling |
AcylLipid |
16 |
0.002 |
5 |
0.019 |
|
|
|
|
|
| Isoprenoid Biosynthesis in the Cytosol and in Mitochondria |
BioPath |
14 |
0.000 |
2 |
0.049 |
|
|
|
|
|
| pentacyclic triterpenoid biosynthesis |
TAIR-GO |
14 |
0.000 |
2 |
0.000 |
|
|
|
|
|
|
|
|
|
|
|
| sterol biosynthesis |
TAIR-GO |
14 |
0.000 |
2 |
0.000 |
|
|
|
|
|
|
|
|
|
|
|
| triterpene biosynthesis |
LitPath |
14 |
0.000 |
2 |
0.002 |
|
|
|
|
|
|
|
|
|
|
|
| Terpenoid biosynthesis |
KEGG |
12 |
0.000 |
3 |
0.000 |
|
|
|
|
|
|
|
|
|
|
|
|
|
|
|
|
|
|
|
|
|
|
|
|
|
|
|
|
|
|
|
|
|
|
|
|
|
|
|
|
|
|
|
|
|
|
|
|
|
|
|
|
|
|
|
|
|
|
|
|
|
|
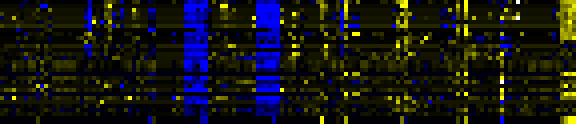
| Pathways co-expressed in the Mutant data set (with more than 6 annotation points) |
|
CYP705A12 (At5g42580) |
|
|
|
|
|
|
|
|
| max. difference between log2-ratios: |
6.3 |
|
|
|
|
|
|
|
|
|
|
|
|
| max. difference between log2-ratios excluding lowest and highest 5%: |
3.8 |
|
|
|
|
|
|
|
|
|
|
|
|
| Pathway |
Source |
Scores of Genes |
p[Score] |
No. of Genes |
p[genes] |
Link to mutants heatmap |
|
|
|
|
|
|
|
| Photosystems |
BioPath |
22 |
0.000 |
3 |
0.004 |
|
|
|
|
| triterpene, sterol, and brassinosteroid metabolism |
LitPath |
19 |
0.000 |
4 |
0.001 |
|
|
|
| isoprenoid biosynthesis |
FunCat |
17 |
0.000 |
3 |
0.000 |
|
|
|
| lipid, fatty acid and isoprenoid biosynthesis |
FunCat |
17 |
0.000 |
3 |
0.000 |
|
|
|
| Biosynthesis of steroids |
KEGG |
17 |
0.000 |
3 |
0.000 |
|
|
|
| additional photosystem II components |
BioPath |
16 |
0.000 |
2 |
0.002 |
|
|
|
| ATP synthase components |
BioPath |
16 |
0.000 |
2 |
0.000 |
|
|
|
| ATP synthesis coupled proton transport |
TAIR-GO |
16 |
0.000 |
2 |
0.000 |
|
|
|
| proton transport |
TAIR-GO |
16 |
0.000 |
2 |
0.000 |
|
|
|
|
|
|
|
|
|
|
|
| triterpene biosynthesis |
LitPath |
13 |
0.000 |
2 |
0.000 |
|
|
|
|
|
|
|
|
|
|
|
| Intermediary Carbon Metabolism |
BioPath |
12 |
0.003 |
2 |
0.075 |
|
|
|
|
|
|
|
|
|
|
|
| C-compound and carbohydrate metabolism |
FunCat |
12 |
0.024 |
2 |
0.212 |
|
|
|
|
|
|
|
|
|
|
|
| glycolysis and gluconeogenesis |
FunCat |
12 |
0.000 |
2 |
0.032 |
|
|
|
|
|
|
|
|
|
|
|
| proton-transporting ATP synthase, catalytic core (sensu Eukaryota) |
TAIR-GO |
10 |
0.000 |
1 |
0.000 |
|
|
|
|
|
|
|
|
|
|
|
| Calvin cycle |
AraCyc |
10 |
0.000 |
1 |
0.000 |
|
|
|
|
|
|
|
|
|
|
|
| photosynthesis |
FunCat |
10 |
0.000 |
1 |
0.029 |
|
|
|
|
|
|
|
|
|
|
|
| Carbon fixation |
KEGG |
10 |
0.000 |
1 |
0.022 |
|
|
|
|
|
|
|
|
|
|
|
| Glyoxylate and dicarboxylate metabolism |
KEGG |
10 |
0.000 |
1 |
0.004 |
|
|
|
|
|
|
|
|
|
|
|
| Leaf Glycerolipid Biosynthesis in Plastid |
BioPath |
8 |
0.001 |
2 |
0.005 |
|
|
|
|
|
|
|
|
|
|
|
| secondary metabolism |
FunCat |
8 |
0.000 |
2 |
0.005 |
|
|
|
|
|
|
|
|
|
|
|
| Synthesis of fatty acids in plastids |
AcylLipid |
8 |
0.000 |
2 |
0.000 |
|
|
|
|
|
|
|
|
|
|
|
| pentacyclic triterpenoid biosynthesis |
TAIR-GO |
7 |
0.000 |
1 |
0.003 |
|
|
|
|
|
|
|
|
|
|
|
| Translation factors |
KEGG |
6.5 |
0.000 |
2 |
0.003 |
|
|
|
|
|
|
|
|
|
|
|
|
|
|
|
|
|
|
|
|
|
|
|
|
|
|
|
|