

| Co-Expression Analysis of: | CYPedia Home | Institut de Biologie Moléculaire des Plantes (Home) | ||||||||||||||
| CYP71B11 (At5g25120) | save all data as Tab Delimited Table | |||||||||||||||
| _________________________________________ | ||||||||||||||||
| Pathways co-expressed in the 3 applicable data sets (with more than 6 annotation points each) | Find below a list of pathways that are co-expressed with the bait. First a list of pathways is given that are co-expressed in all data sets. Lists for each individual dataset are shown underneath. Depending on the number of co-expressed pathways only the top scoring pathways are given; all data can be saved as text using the link above. | 
|
||||||||||||||
| Pathway | Source | Sum of scores | Sum of genes | |||||||||||||
| sterol biosynthesis | BioPath | 24 | 6 | |||||||||||||
| sterol biosynthesis | BioPath | 24 | 6 | |||||||||||||
| sterol biosynthesis | BioPath | 24 | 6 | |||||||||||||
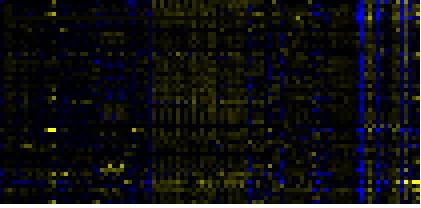
| To the right of each table a thumbnail of the actual co-expression heatmap is given. Klick on the link to see the heatmap containing all co-expressed genes. | ||||||||||||||||
| For more information on how these pathway maps were generated please read the methods page | ||||||||||||||||
| Pathways co-expressed in the Organ and Tissue data set (with more than 10 annotation points) | CYP71B11 (At5g25120) | |||||||||||||||
| max. difference between log2-ratios: | 3.7 | |||||||||||||||
| max. difference between log2-ratios excluding lowest and highest 5%: | 2.4 | |||||||||||||||
| Link to organ heatmap | ||||||||||||||||
| there are no co-expressed pathways with r-value greater than 0.5 | ||||||||||||||||
| Pathways co-expressed in the Stress data set ( with more than 6 annotation points) | CYP71B11 (At5g25120) | |||||||||||||||
| max. difference between log2-ratios: | 5.6 | |||||||||||||||
| max. difference between log2-ratios excluding lowest and highest 5%: | 2.6 | |||||||||||||||
| Pathway | Source | Scores of Genes | p[Score] | No. of Genes | p[genes] | Link to stress heatmap | ||||||||||
| Isoprenoid Biosynthesis in the Cytosol and in Mitochondria | BioPath | 8 | 0.000 | 2 | 0.000 | |||||||||||
| sterol biosynthesis | BioPath | 8 | 0.000 | 2 | 0.000 | |||||||||||
| sterol biosynthesis | TAIR-GO | 8 | 0.000 | 2 | 0.000 | |||||||||||
| sterol biosynthesis | AraCyc | 8 | 0.000 | 2 | 0.000 | |||||||||||
| Biosynthesis of steroids | KEGG | 8 | 0.000 | 2 | 0.000 | |||||||||||
| Terpenoid biosynthesis | KEGG | 8 | 0.000 | 2 | 0.000 | |||||||||||
| triterpene, sterol, and brassinosteroid metabolism | LitPath | 8 | 0.000 | 2 | 0.000 | |||||||||||
| Pathways co-expressed in the Hormone etc. data set (with more than 10 annotation points) | CYP71B11 (At5g25120) | |||||||||||||||
| max. difference between log2-ratios: | 3.9 | |||||||||||||||
| max. difference between log2-ratios excluding lowest and highest 5%: | 2.1 | |||||||||||||||
| Pathway | Source | Scores of Genes | p[Score] | No. of Genes | p[genes] | Link to hormones etc. heatmap | ||||||||||
| Photosystems | BioPath | 44 | 0.000 | 6 | 0.002 | 
|
||||||||||
| photosynthesis | FunCat | 40 | 0.000 | 6 | 0.000 | |||||||||||
| C-compound and carbohydrate metabolism | FunCat | 34 | 0.001 | 6 | 0.053 | |||||||||||
| photorespiration | AraCyc | 29 | 0.000 | 6 | 0.000 | |||||||||||
| Carbon fixation | KEGG | 28 | 0.000 | 4 | 0.000 | |||||||||||
| glycine biosynthesis I | AraCyc | 23 | 0.000 | 5 | 0.001 | |||||||||||
| superpathway of serine and glycine biosynthesis II | AraCyc | 23 | 0.000 | 5 | 0.000 | |||||||||||
| glycolysis and gluconeogenesis | FunCat | 23 | 0.000 | 3 | 0.066 | |||||||||||
| Photosynthesis | KEGG | 23 | 0.000 | 4 | 0.000 | |||||||||||
| biogenesis of chloroplast | FunCat | 19 | 0.000 | 3 | 0.008 | |||||||||||
| formaldehyde assimilation I (serine pathway) | AraCyc | 18 | 0.000 | 3 | 0.012 | |||||||||||
| serine-isocitrate lyase pathway | AraCyc | 18 | 0.000 | 3 | 0.035 | |||||||||||
| starch metabolism | BioPath | 16 | 0.000 | 2 | 0.014 | |||||||||||
| gluconeogenesis | AraCyc | 16 | 0.001 | 2 | 0.128 | |||||||||||
| starch biosynthesis | AraCyc | 16 | 0.000 | 2 | 0.000 | |||||||||||
| Starch and sucrose metabolism | KEGG | 16 | 0.000 | 2 | 0.041 | |||||||||||
| additional photosystem II components | BioPath | 15 | 0.000 | 2 | 0.029 | |||||||||||
| Photosystem I | BioPath | 15 | 0.002 | 2 | 0.075 | |||||||||||
| Photosystem II | BioPath | 15 | 0.000 | 2 | 0.029 | |||||||||||
| photorespiration | TAIR-GO | 15 | 0.000 | 2 | 0.000 | |||||||||||
| colanic acid building blocks biosynthesis | AraCyc | 15 | 0.003 | 4 | 0.019 | |||||||||||
| galactose degradation I | AraCyc | 15 | 0.000 | 4 | 0.000 | |||||||||||
| glucose conversion | AraCyc | 15 | 0.000 | 4 | 0.005 | |||||||||||
| lactose degradation IV | AraCyc | 15 | 0.000 | 4 | 0.000 | |||||||||||
| UDP-glucose conversion | AraCyc | 15 | 0.000 | 4 | 0.004 | |||||||||||
| photosystem I | TAIR-GO | 14 | 0.000 | 2 | 0.000 | |||||||||||
| acetate fermentation | AraCyc | 14 | 0.034 | 2 | 0.293 | |||||||||||
| fructose degradation (anaerobic) | AraCyc | 14 | 0.021 | 2 | 0.255 | |||||||||||
| glycolysis IV | AraCyc | 14 | 0.023 | 2 | 0.262 | |||||||||||
| sorbitol fermentation | AraCyc | 14 | 0.036 | 2 | 0.278 | |||||||||||
| transport | FunCat | 14 | 0.000 | 2 | 0.000 | |||||||||||
| Glycolysis / Gluconeogenesis | KEGG | 14 | 0.000 | 2 | 0.044 | |||||||||||
| dTDP-rhamnose biosynthesis | AraCyc | 13 | 0.001 | 3 | 0.030 | |||||||||||
| Glycine, serine and threonine metabolism | KEGG | 12 | 0.000 | 2 | 0.006 | |||||||||||
| Regulatory enzymes | BioPath | 10 | 0.000 | 1 | 0.001 | |||||||||||
| Thylakoid biogenesis and photosystem assembly | BioPath | 10 | 0.000 | 1 | 0.006 | |||||||||||
| chloroplast-nucleus signaling pathway | TAIR-GO | 10 | 0.000 | 1 | 0.001 | |||||||||||
| cytochrome b6f complex | TAIR-GO | 10 | 0.000 | 1 | 0.006 | |||||||||||
| cytochrome b6f complex assembly | TAIR-GO | 10 | 0.000 | 1 | 0.000 | |||||||||||
| enzyme binding | TAIR-GO | 10 | 0.000 | 1 | 0.000 | |||||||||||
| gibberellic acid catabolism | TAIR-GO | 10 | 0.000 | 1 | 0.004 | |||||||||||
| tetrapyrrole binding | TAIR-GO | 10 | 0.000 | 1 | 0.000 | |||||||||||
| glucose and glucose-1-phosphate degradation | AraCyc | 10 | 0.000 | 1 | 0.049 | |||||||||||
| glyceraldehyde 3-phosphate degradation | AraCyc | 10 | 0.001 | 1 | 0.133 | |||||||||||
| peptidoglycan biosynthesis | AraCyc | 10 | 0.000 | 1 | 0.019 | |||||||||||
| sucrose biosynthesis | AraCyc | 10 | 0.001 | 1 | 0.105 | |||||||||||
| sucrose degradation III | AraCyc | 10 | 0.000 | 1 | 0.071 | |||||||||||
| trehalose biosynthesis III | AraCyc | 10 | 0.005 | 1 | 0.223 | |||||||||||
| UDP-N-acetylglucosamine biosynthesis | AraCyc | 10 | 0.000 | 1 | 0.015 | |||||||||||
| C-compound, carbohydrate anabolism | FunCat | 10 | 0.000 | 1 | 0.025 | |||||||||||
| Pathways co-expressed in the Mutant data set (with more than 10 annotation points) | CYP71B11 (At5g25120) | |||||||||||||||
| max. difference between log2-ratios: | 6.2 | |||||||||||||||
| max. difference between log2-ratios excluding lowest and highest 5%: | 2.3 | |||||||||||||||
| Pathway | Source | Scores of Genes | p[Score] | No. of Genes | p[genes] | Link to mutants heatmap | ||||||||||
| gibberellic acid biosynthesis | TAIR-GO | 10 | 0.000 | 1 | 0.001 | 
|
||||||||||
| gibberellic acid mediated signaling | TAIR-GO | 10 | 0.000 | 1 | 0.000 | |||||||||||
| gibberellin biosynthesis | AraCyc | 10 | 0.000 | 1 | 0.000 | |||||||||||
| biosynthesis of derivatives of homoisopentenyl pyrophosphate | FunCat | 10 | 0.000 | 1 | 0.004 | |||||||||||
| plant / fungal specific systemic sensing and response | FunCat | 10 | 0.000 | 1 | 0.006 | |||||||||||
| plant hormonal regulation | FunCat | 10 | 0.000 | 1 | 0.006 | |||||||||||
| Diterpenoid biosynthesis | KEGG | 10 | 0.000 | 1 | 0.001 | |||||||||||
| diterpene biosynthesis | LitPath | 10 | 0.000 | 1 | 0.000 | |||||||||||
| Gibberellin metabolism | LitPath | 10 | 0.000 | 1 | 0.006 | |||||||||||
| page created by Vincent Sauveplane | 05/03/06 | |||||||||||||||