|
|
|
|
|
|
|
|
|
|
|
|
|
|
|
|
|
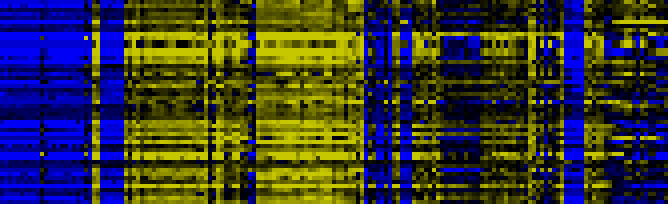
| Pathways co-expressed in the Organ and Tissue data set (with more than 50 annotation points) |
|
CYP71B28 (At1g13090) |
|
|
|
|
|
|
|
|
| max. difference between log2-ratios: |
4.9 |
|
|
|
|
|
|
|
|
|
|
|
|
| max. difference between log2-ratios excluding lowest and highest 5%: |
4.4 |
|
|
|
|
|
|
|
|
|
|
|
|
| Pathway |
Source |
Scores of Genes |
p[Score] |
No. of Genes |
p[genes] |
Link to organ heatmap |
|
|
|
|
|
|
|
| Photosystems |
BioPath |
307 |
0.000 |
47 |
0.000 |
|
|
|
| Plastidial Isoprenoids (Chlorophylls, Carotenoids, Tocopherols, Plastoquinone, Phylloquinone) |
BioPath |
171 |
0.000 |
21 |
0.000 |
|
|
| C-compound and carbohydrate metabolism |
FunCat |
146 |
0.000 |
26 |
0.064 |
|
|
| additional photosystem II components |
BioPath |
136 |
0.000 |
19 |
0.000 |
|
|
| biogenesis of chloroplast |
FunCat |
135 |
0.000 |
22 |
0.000 |
|
|
| Photosynthesis |
KEGG |
127 |
0.000 |
22 |
0.000 |
|
|
| photosynthesis |
FunCat |
126 |
0.000 |
20 |
0.000 |
|
|
| Photosystem I |
BioPath |
119 |
0.000 |
20 |
0.000 |
|
|
| Carbon fixation |
KEGG |
100 |
0.000 |
14 |
0.000 |
|
|
| Chlorophyll a/b binding proteins |
BioPath |
98 |
0.000 |
12 |
0.000 |
|
|
| glycolysis and gluconeogenesis |
FunCat |
95 |
0.000 |
15 |
0.015 |
|
|
| transport |
FunCat |
85 |
0.000 |
15 |
0.000 |
|
|
| photosystem I |
TAIR-GO |
82 |
0.000 |
10 |
0.000 |
|
|
| Folding, Sorting and Degradation |
KEGG |
76 |
0.000 |
11 |
0.013 |
|
|
|
|
|
|
|
|
|
|
|
| photosystem II |
TAIR-GO |
66 |
0.000 |
8 |
0.000 |
|
|
|
|
|
|
|
|
|
|
|
| Chlorophyll biosynthesis and breakdown |
BioPath |
65 |
0.000 |
8 |
0.015 |
|
|
|
|
|
|
|
|
|
|
|
| chlorophyll and phytochromobilin metabolism |
LitPath |
65 |
0.000 |
8 |
0.001 |
|
|
|
|
|
|
|
|
|
|
|
| Calvin cycle |
AraCyc |
62 |
0.000 |
10 |
0.000 |
|
|
|
|
|
|
|
|
|
|
|
| Carotenoid and abscisic acid metabolism |
LitPath |
62 |
0.000 |
8 |
0.000 |
|
|
|
|
|
|
|
|
|
|
|
| Pathway for nuclear-encoded, thylakoid-localized proteins |
BioPath |
58 |
0.000 |
7 |
0.000 |
|
|
|
|
|
|
|
|
|
|
|
| Photosystem II |
BioPath |
57 |
0.001 |
8 |
0.043 |
|
|
|
|
|
|
|
|
|
|
|
| Biosynthesis of steroids |
KEGG |
56 |
0.000 |
7 |
0.003 |
|
|
|
|
|
|
|
|
|
|
|
| Carotenoid biosynthesis |
BioPath |
52 |
0.000 |
6 |
0.000 |
|
|
|
|
|
|
|
|
|
|
|
| carotenoid biosynthesis |
AraCyc |
52 |
0.000 |
6 |
0.000 |
|
|
|
|
|
|
|
|
|
|
|
| photorespiration |
AraCyc |
52 |
0.000 |
13 |
0.000 |
|
|
|
|
|
|
|
|
|
|
|
| carotenid biosynthesis |
LitPath |
52 |
0.000 |
6 |
0.000 |
|
|
|
|
|
|
|
|
|
|
|
|
|
|
|
|
|
|
|
|
|
|
|
|
|
|
|
|
|
|
|
|
|
|
|
|
|
|
|
|
|
|
|
|
|
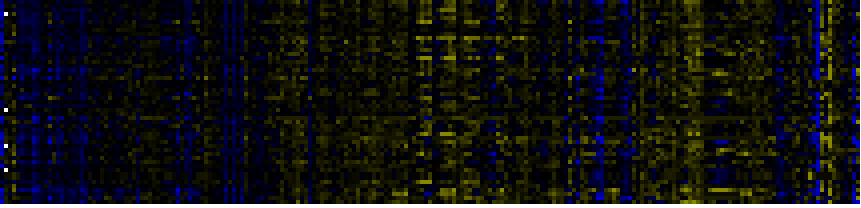
| Pathways co-expressed in the Stress data set ( with more than 12 annotation points) |
|
CYP71B28 (At1g13090) |
|
|
|
|
|
|
|
|
| max. difference between log2-ratios: |
3.9 |
|
|
|
|
|
|
|
|
|
|
|
|
| max. difference between log2-ratios excluding lowest and highest 5%: |
1.6 |
|
|
|
|
|
|
|
|
|
|
|
|
| Pathway |
Source |
Scores of Genes |
p[Score] |
No. of Genes |
p[genes] |
Link to stress heatmap |
|
|
|
|
|
|
|
| C-compound and carbohydrate metabolism |
FunCat |
58 |
0.000 |
11 |
0.004 |
|
| Intermediary Carbon Metabolism |
BioPath |
42 |
0.000 |
7 |
0.036 |
| Pathway for nuclear-encoded, thylakoid-localized proteins |
BioPath |
34 |
0.000 |
4 |
0.000 |
| Photosystems |
BioPath |
32 |
0.002 |
4 |
0.116 |
| glycolysis and gluconeogenesis |
FunCat |
30 |
0.000 |
6 |
0.007 |
| additional photosystem II components |
BioPath |
26 |
0.000 |
3 |
0.014 |
| Miscellaneous acyl lipid metabolism |
AcylLipid |
24 |
0.000 |
7 |
0.015 |
| Delta-pH pathway |
BioPath |
20 |
0.000 |
2 |
0.000 |
| Leaf Glycerolipid Biosynthesis in Plastid |
BioPath |
20 |
0.003 |
2 |
0.162 |
| chloroplast thylakoid membrane protein import |
TAIR-GO |
20 |
0.000 |
2 |
0.000 |
| Carbon fixation |
KEGG |
20 |
0.000 |
3 |
0.020 |
| Pyruvate metabolism |
KEGG |
19 |
0.000 |
3 |
0.028 |
| Transcription (chloroplast) |
BioPath |
18 |
0.000 |
2 |
0.000 |
| transcription initiation |
TAIR-GO |
18 |
0.000 |
2 |
0.000 |
|
|
|
|
|
|
|
|
|
|
|
| phenylalanine degradation I |
AraCyc |
18 |
0.000 |
5 |
0.000 |
|
|
|
|
|
|
|
|
|
|
|
| threonine degradation |
AraCyc |
17 |
0.000 |
4 |
0.000 |
|
|
|
|
|
|
|
|
|
|
|
| formaldehyde assimilation I (serine pathway) |
AraCyc |
16 |
0.000 |
3 |
0.019 |
|
|
|
|
|
|
|
|
|
|
|
| serine-isocitrate lyase pathway |
AraCyc |
16 |
0.000 |
3 |
0.052 |
|
|
|
|
|
|
|
|
|
|
|
| photosynthesis |
FunCat |
16 |
0.000 |
2 |
0.054 |
|
|
|
|
|
|
|
|
|
|
|
| Folding, Sorting and Degradation |
KEGG |
16 |
0.004 |
3 |
0.094 |
|
|
|
|
|
|
|
|
|
|
|
| Pentose phosphate pathway |
KEGG |
16 |
0.000 |
2 |
0.028 |
|
|
|
|
|
|
|
|
|
|
|
| Photosynthesis |
KEGG |
16 |
0.000 |
2 |
0.016 |
|
|
|
|
|
|
|
|
|
|
|
| Protein export |
KEGG |
16 |
0.000 |
3 |
0.001 |
|
|
|
|
|
|
|
|
|
|
|
| methylglyoxal degradation |
AraCyc |
15 |
0.000 |
3 |
0.001 |
|
|
|
|
|
|
|
|
|
|
|
| Chloroplastic protein turnover |
BioPath |
14 |
0.000 |
2 |
0.003 |
|
|
|
|
|
|
|
|
|
|
|
| TCA cycle variation IV |
AraCyc |
14 |
0.001 |
3 |
0.052 |
|
|
|
|
|
|
|
|
|
|
|
| TCA cycle variation VII |
AraCyc |
14 |
0.038 |
3 |
0.178 |
|
|
|
|
|
|
|
|
|
|
|
| TCA cycle variation VIII |
AraCyc |
14 |
0.002 |
3 |
0.067 |
|
|
|
|
|
|
|
|
|
|
|
| transport |
FunCat |
14 |
0.000 |
2 |
0.000 |
|
|
|
|
|
|
|
|
|
|
|
| Glutathione metabolism |
KEGG |
14 |
0.000 |
2 |
0.030 |
|
|
|
|
|
|
|
|
|
|
|
|
|
|
|
|
|
|
|
|
|
|
|
|
|
|
|
|
|
|
|
|
|
|
|
|
|
|
|
|
|
|
|
|
|
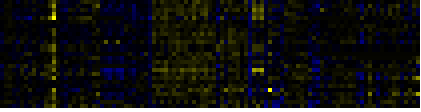
| Pathways co-expressed in the Hormone etc. data set (with more than 10 annotation points) |
|
CYP71B28 (At1g13090) |
|
|
|
|
|
|
|
|
| max. difference between log2-ratios: |
1.9 |
|
|
|
|
|
|
|
|
|
|
|
|
| max. difference between log2-ratios excluding lowest and highest 5%: |
1.0 |
|
|
|
|
|
|
|
|
|
|
|
|
| Pathway |
Source |
Scores of Genes |
p[Score] |
No. of Genes |
p[genes] |
Link to hormones etc. heatmap |
|
|
|
|
|
|
|
| Plastidial Isoprenoids (Chlorophylls, Carotenoids, Tocopherols, Plastoquinone, Phylloquinone) |
BioPath |
28 |
0.000 |
3 |
0.006 |
|
|
|
|
|
|
| Intermediary Carbon Metabolism |
BioPath |
16 |
0.003 |
3 |
0.050 |
|
|
|
|
|
| biogenesis of chloroplast |
FunCat |
16 |
0.000 |
2 |
0.010 |
|
|
|
|
|
| ascorbate glutathione cycle |
AraCyc |
14 |
0.000 |
2 |
0.001 |
|
|
|
|
|
| photorespiration |
AraCyc |
14 |
0.000 |
2 |
0.011 |
|
|
|
|
|
| Ascorbate and aldarate metabolism |
KEGG |
14 |
0.000 |
2 |
0.001 |
|
|
|
|
|
| Biosynthesis of steroids |
KEGG |
14 |
0.000 |
2 |
0.007 |
|
|
|
|
|
| Carbon fixation |
KEGG |
14 |
0.000 |
3 |
0.002 |
|
|
|
|
|
|
|
|
|
|
|
| Glutamate metabolism |
KEGG |
14 |
0.000 |
2 |
0.006 |
|
|
|
|
|
|
|
|
|
|
|
| Gluconeogenesis from lipids in seeds |
BioPath |
12 |
0.000 |
2 |
0.022 |
|
|
|
|
|
|
|
|
|
|
|
| detoxification |
FunCat |
12 |
0.000 |
2 |
0.000 |
|
|
|
|
|
|
|
|
|
|
|
| Basal transcription factors |
KEGG |
12 |
0.000 |
2 |
0.003 |
|
|
|
|
|
|
|
|
|
|
|
| Stilbene, coumarine and lignin biosynthesis |
KEGG |
12 |
0.000 |
2 |
0.054 |
|
|
|
|
|
|
|
|
|
|
|
| Transcription |
KEGG |
12 |
0.000 |
2 |
0.029 |
|
|
|
|
|
|
|
|
|
|
|
|
|
|
|
|
|
|
|
|
|
|
|
|
|
|
|
|
|
|
|
|
|
|
|
|
|
|
|
|
|
|
|
|
|
|
|
|
|
|
|
|
|
|
|
|
|
|
|
|
|
|
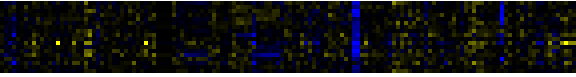
| Pathways co-expressed in the Mutant data set (with more than 6 annotation points) |
|
CYP71B28 (At1g13090) |
|
|
|
|
|
|
|
|
| max. difference between log2-ratios: |
4.0 |
|
|
|
|
|
|
|
|
|
|
|
|
| max. difference between log2-ratios excluding lowest and highest 5%: |
1.3 |
|
|
|
|
|
|
|
|
|
|
|
|
| Pathway |
Source |
Scores of Genes |
p[Score] |
No. of Genes |
p[genes] |
Link to mutants heatmap |
|
|
|
|
|
|
|
| Phenylpropanoid Metabolism |
BioPath |
14 |
0.000 |
2 |
0.012 |
|
|
|
|
| core phenylpropanoid metabolism |
BioPath |
10 |
0.000 |
1 |
0.007 |
|
|
|
| Thylakoid biogenesis and photosystem assembly |
BioPath |
10 |
0.000 |
1 |
0.000 |
|
|
|
| cytochrome b6f complex |
TAIR-GO |
10 |
0.000 |
1 |
0.000 |
|
|
|
| cytochrome b6f complex assembly |
TAIR-GO |
10 |
0.000 |
1 |
0.000 |
|
|
|
| lignin biosynthesis |
TAIR-GO |
10 |
0.000 |
1 |
0.001 |
|
|
|
|
|
|
|
|
|
|
|
| lignin biosynthesis |
AraCyc |
10 |
0.000 |
1 |
0.024 |
|
|
|
|
|
|
|
|
|
|
|
| electron transport and membrane-associated energy conservation |
FunCat |
10 |
0.000 |
1 |
0.000 |
|
|
|
|
|
|
|
|
|
|
|
| energy |
FunCat |
10 |
0.000 |
1 |
0.000 |
|
|
|
|
|
|
|
|
|
|
|
| transport |
FunCat |
10 |
0.000 |
1 |
0.000 |
|
|
|
|
|
|
|
|
|
|
|
| Phenylpropanoid pathway |
LitPath |
10 |
0.000 |
1 |
0.106 |
|
|
|
|
|
|
|
|
|
|
|
| beta-Alanine metabolism |
KEGG |
9 |
0.000 |
1 |
0.003 |
|
|
|
|
|
|
|
|
|
|
|
| Nucleotide Metabolism |
KEGG |
9 |
0.000 |
1 |
0.034 |
|
|
|
|
|
|
|
|
|
|
|
| Pantothenate and CoA biosynthesis |
KEGG |
9 |
0.000 |
1 |
0.003 |
|
|
|
|
|
|
|
|
|
|
|
| Pyrimidine metabolism |
KEGG |
9 |
0.000 |
1 |
0.010 |
|
|
|
|
|
|
|
|
|
|
|
| Valine, leucine and isoleucine degradation |
KEGG |
8 |
0.000 |
2 |
0.000 |
|
|
|
|
|
|
|
|
|
|
|
|
|
|
|
|
|
|
|
|
|
|
|
|
|
|
|
|