| _________________________________________ |
|
|
|
|
|
|
|
|

|
|
|
|
|
|
|
| Pathways co-expressed in the 3 applicable data sets (with more than 6 annotation points each) |
|
Find below a list of pathways that are co-expressed with the bait. First a list of pathways is given that are co-expressed in all data sets. Lists for each individual dataset are shown underneath. Depending on the number of co-expressed pathways only the top scoring pathways are given; all data can be saved as text using the link above. |
|
|
|
|
|
|
| Pathway |
Source |
Sum of scores |
Sum of genes |
|
|
|
|
|
|
|
| C-compound and carbohydrate metabolism |
FunCat |
139 |
23 |
|
|
|
|
|
|
|
| glycolysis and gluconeogenesis |
FunCat |
109 |
16 |
|
|
|
|
|
|
|
|
|
|
|
|
|
|
|
|
|
|
|
|
|
|
|
|
|
To the right of each table a thumbnail of the actual co-expression heatmap is given. Klick on the link to see the heatmap containing all co-expressed genes. |
|
|
|
|
|
|
|
|
|
|
|
|
|
|
|
|
|
|
|
|
|
|
|
|
|
|
|
|
|
|
|
|
|
|
|
|
|
|
|
For more information on how these pathway maps were generated please read the methods page |
|
|
|
|
|
|
|
|
|
|
|
|
|
|
|
|
|
|
|
|
|
|
|
|
|
|
|
|
|
|
|
|
|
|
|
|
|
|
|
|
|
|
|
|
|
|
|
|
|
|
|
|
|
|
|
|
|
|
|
|
|
|
|
|
|
|
|
|
|
|
|
|
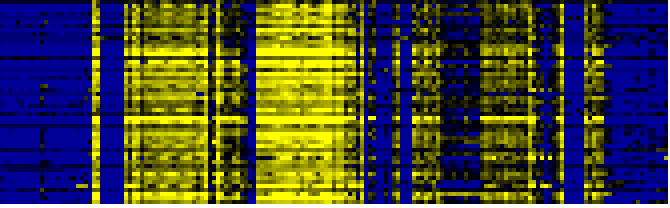
| Pathways co-expressed in the Organ and Tissue data set (with more than 40 annotation points) |
|
CYP71B35 (At3g26310) |
|
|
|
|
|
|
|
|
| max. difference between log2-ratios: |
2.9 |
|
|
|
|
|
|
|
|
|
|
|
|
| max. difference between log2-ratios excluding lowest and highest 5%: |
1.7 |
|
|
|
|
|
|
|
|
|
|
|
|
| Pathway |
Source |
Scores of Genes |
p[Score] |
No. of Genes |
p[genes] |
Link to organ heatmap |
|
|
|
|
|
|
|
| Photosystems |
BioPath |
224 |
0.000 |
35 |
0.000 |
|
|
|
| Plastidial Isoprenoids (Chlorophylls, Carotenoids, Tocopherols, Plastoquinone, Phylloquinone) |
BioPath |
153 |
0.000 |
21 |
0.000 |
|
|
| photosynthesis |
FunCat |
110 |
0.000 |
18 |
0.000 |
|
|
| C-compound and carbohydrate metabolism |
FunCat |
107 |
0.000 |
18 |
0.022 |
|
|
| Photosynthesis |
KEGG |
97 |
0.000 |
17 |
0.000 |
|
|
| additional photosystem II components |
BioPath |
95 |
0.000 |
15 |
0.000 |
|
|
| biogenesis of chloroplast |
FunCat |
91 |
0.000 |
14 |
0.000 |
|
|
| Photosystem I |
BioPath |
87 |
0.000 |
14 |
0.000 |
|
|
| glycolysis and gluconeogenesis |
FunCat |
83 |
0.000 |
13 |
0.001 |
|
|
| Carbon fixation |
KEGG |
80 |
0.000 |
12 |
0.000 |
|
|
| Chlorophyll biosynthesis and breakdown |
BioPath |
67 |
0.000 |
8 |
0.002 |
|
|
| chlorophyll and phytochromobilin metabolism |
LitPath |
67 |
0.000 |
8 |
0.000 |
|
|
| Porphyrin and chlorophyll metabolism |
KEGG |
63 |
0.000 |
8 |
0.000 |
|
|
| photorespiration |
AraCyc |
62 |
0.000 |
12 |
0.000 |
|
|
|
|
|
|
|
|
|
|
|
| Calvin cycle |
AraCyc |
60 |
0.000 |
11 |
0.000 |
|
|
|
|
|
|
|
|
|
|
|
| Glycolysis / Gluconeogenesis |
KEGG |
58 |
0.000 |
9 |
0.000 |
|
|
|
|
|
|
|
|
|
|
|
| chlorophyll biosynthesis |
AraCyc |
54 |
0.000 |
7 |
0.015 |
|
|
|
|
|
|
|
|
|
|
|
| transport |
FunCat |
53 |
0.000 |
8 |
0.000 |
|
|
|
|
|
|
|
|
|
|
|
| acetate fermentation |
AraCyc |
50 |
0.000 |
9 |
0.010 |
|
|
|
|
|
|
|
|
|
|
|
| fructose degradation (anaerobic) |
AraCyc |
50 |
0.000 |
9 |
0.006 |
|
|
|
|
|
|
|
|
|
|
|
| glycolysis I |
AraCyc |
50 |
0.008 |
9 |
0.291 |
|
|
|
|
|
|
|
|
|
|
|
| glycolysis IV |
AraCyc |
50 |
0.000 |
9 |
0.006 |
|
|
|
|
|
|
|
|
|
|
|
| sorbitol fermentation |
AraCyc |
50 |
0.000 |
9 |
0.008 |
|
|
|
|
|
|
|
|
|
|
|
| Carotenoid and abscisic acid metabolism |
LitPath |
50 |
0.000 |
7 |
0.000 |
|
|
|
|
|
|
|
|
|
|
|
| Photosystem II |
BioPath |
49 |
0.000 |
7 |
0.019 |
|
|
|
|
|
|
|
|
|
|
|
| Chlorophyll a/b binding proteins |
BioPath |
48 |
0.000 |
6 |
0.001 |
|
|
|
|
|
|
|
|
|
|
|
| photosystem I |
TAIR-GO |
48 |
0.000 |
6 |
0.000 |
|
|
|
|
|
|
|
|
|
|
|
| Carotenoid biosynthesis |
BioPath |
46 |
0.000 |
6 |
0.000 |
|
|
|
|
|
|
|
|
|
|
|
| carotenid biosynthesis |
LitPath |
46 |
0.000 |
6 |
0.000 |
|
|
|
|
|
|
|
|
|
|
|
| carotenoid biosynthesis |
AraCyc |
44 |
0.000 |
5 |
0.000 |
|
|
|
|
|
|
|
|
|
|
|
|
|
|
|
|
|
|
|
|
|
|
|
|
|
|
|
|
|
|
|
|
|
|
|
|
|
|
|
|
|
|
|
|
|
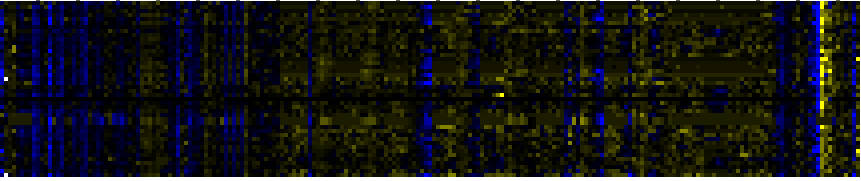
| Pathways co-expressed in the Stress data set ( with more than 15 annotation points) |
|
CYP71B35 (At3g26310) |
|
|
|
|
|
|
|
|
| max. difference between log2-ratios: |
5.3 |
|
|
|
|
|
|
|
|
|
|
|
|
| max. difference between log2-ratios excluding lowest and highest 5%: |
1.5 |
|
|
|
|
|
|
|
|
|
|
|
|
| Pathway |
Source |
Scores of Genes |
p[Score] |
No. of Genes |
p[genes] |
Link to stress heatmap |
|
|
|
|
|
|
|
| Plastidial Isoprenoids (Chlorophylls, Carotenoids, Tocopherols, Plastoquinone, Phylloquinone) |
BioPath |
30 |
0.000 |
3 |
0.057 |
|
| Photosystems |
BioPath |
24 |
0.002 |
5 |
0.010 |
| C-compound and carbohydrate metabolism |
FunCat |
22 |
0.000 |
4 |
0.027 |
| Chlorophyll biosynthesis and breakdown |
BioPath |
20 |
0.000 |
2 |
0.020 |
| Pathway for nuclear-encoded, thylakoid-localized proteins |
BioPath |
20 |
0.000 |
2 |
0.001 |
| Transcription (chloroplast) |
BioPath |
20 |
0.000 |
2 |
0.000 |
| Transcriptional regulators (chloroplast) |
BioPath |
20 |
0.000 |
2 |
0.000 |
| positive regulation of transcription |
TAIR-GO |
20 |
0.000 |
2 |
0.000 |
| regulation of transcription |
TAIR-GO |
20 |
0.000 |
2 |
0.000 |
| transcription initiation |
TAIR-GO |
20 |
0.000 |
2 |
0.000 |
| chlorophyll and phytochromobilin metabolism |
LitPath |
20 |
0.000 |
2 |
0.003 |
| Gluconeogenesis from lipids in seeds |
BioPath |
18 |
0.000 |
3 |
0.031 |
|
|
|
|
|
|
|
|
|
|
|
| Pentose phosphate pathway |
KEGG |
18 |
0.000 |
3 |
0.000 |
|
|
|
|
|
|
|
|
|
|
|
| mRNA synthesis |
FunCat |
17 |
0.000 |
2 |
0.001 |
|
|
|
|
|
|
|
|
|
|
|
| RNA synthesis |
FunCat |
17 |
0.000 |
2 |
0.001 |
|
|
|
|
|
|
|
|
|
|
|
| transcription |
FunCat |
17 |
0.000 |
2 |
0.000 |
|
|
|
|
|
|
|
|
|
|
|
| transcriptional control |
FunCat |
17 |
0.000 |
2 |
0.000 |
|
|
|
|
|
|
|
|
|
|
|
| acetate fermentation |
AraCyc |
16 |
0.000 |
2 |
0.047 |
|
|
|
|
|
|
|
|
|
|
|
| Calvin cycle |
AraCyc |
16 |
0.000 |
2 |
0.010 |
|
|
|
|
|
|
|
|
|
|
|
| fructose degradation (anaerobic) |
AraCyc |
16 |
0.000 |
2 |
0.039 |
|
|
|
|
|
|
|
|
|
|
|
| glycolysis I |
AraCyc |
16 |
0.001 |
2 |
0.198 |
|
|
|
|
|
|
|
|
|
|
|
| glycolysis IV |
AraCyc |
16 |
0.000 |
2 |
0.041 |
|
|
|
|
|
|
|
|
|
|
|
| mannitol degradation |
AraCyc |
16 |
0.000 |
2 |
0.003 |
|
|
|
|
|
|
|
|
|
|
|
| sorbitol degradation |
AraCyc |
16 |
0.000 |
2 |
0.003 |
|
|
|
|
|
|
|
|
|
|
|
| sorbitol fermentation |
AraCyc |
16 |
0.000 |
2 |
0.044 |
|
|
|
|
|
|
|
|
|
|
|
| glycolysis and gluconeogenesis |
FunCat |
16 |
0.000 |
2 |
0.042 |
|
|
|
|
|
|
|
|
|
|
|
| pentose-phosphate pathway |
FunCat |
16 |
0.000 |
2 |
0.000 |
|
|
|
|
|
|
|
|
|
|
|
| Carbon fixation |
KEGG |
16 |
0.000 |
2 |
0.007 |
|
|
|
|
|
|
|
|
|
|
|
| Fructose and mannose metabolism |
KEGG |
16 |
0.000 |
2 |
0.003 |
|
|
|
|
|
|
|
|
|
|
|
| Glycolysis / Gluconeogenesis |
KEGG |
16 |
0.000 |
2 |
0.011 |
|
|
|
|
|
|
|
|
|
|
|
|
|
|
|
|
|
|
|
|
|
|
|
|
|
|
|
|