| _________________________________________ |
|
|
|
|
|
|
|
|
|
|
|
|
|
|
|
|
| Pathways co-expressed in all 4 data sets (with more than 6 annotation points each) |
|
Find below a list of pathways that are co-expressed with the bait. First a list of pathways is given that are co-expressed in all data sets. Lists for each individual dataset are shown underneath. Depending on the number of co-expressed pathways only the top scoring pathways are given; all data can be saved as text using the link above. |
|
|
|
|
|
|
|
|
| Pathway |
Source |
Sum of scores |
Sum of genes |
|
|
|
|
|
|
|
|
| lipoxygenase pathway |
AraCyc |
80 |
9 |
|
|
|
|
|
|
|
|
| lipid, fatty acid and isoprenoid metabolism |
FunCat |
66 |
8 |
|
|
|
|
|
|
|
|
| oxylipin pathway |
LitPath |
60 |
6 |
|
|
|
|
|
|
|
|
| chlorophyll catabolism |
TAIR-GO |
50 |
5 |
|
To the right of each table a thumbnail of the actual co-expression heatmap is given. Klick on the link to see the heatmap containing all co-expressed genes. |
|
|
|
|
|
|
|
|
|
| chlorophyll catabolism |
LitPath |
50 |
5 |
|
|
|
|
|
|
|
|
|
|
|
|
|
|
|
|
|
|
|
|
|
|
|
|
|
|
|
|
|
For more information on how these pathway maps were generated please read the methods page |
|
|
|
|
|
|
|
|
|
|
|
|
|
|
|
|
|
|
|
|
|
|
|
|
|
|
|
|
|
|
|
|
|
|
|
|
|
|
|
|
|
|
|
|
|
|
|
|
|
|
|
|
|
|
|
|
|
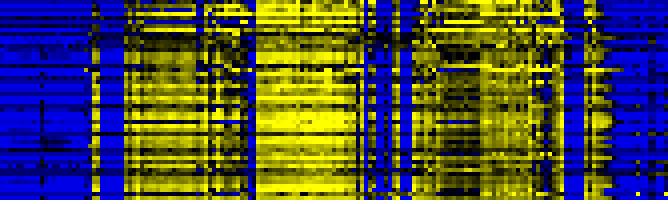
| Pathways co-expressed in the Organ and Tissue data set (with more than 30 annotation points) |
|
CYP74B2, HPL1 (At4g15440) |
|
|
|
|
|
|
|
|
| max. difference between log2-ratios: |
6.8 |
|
|
|
|
|
|
|
|
|
|
|
|
| max. difference between log2-ratios excluding lowest and highest 5%: |
5.2 |
|
|
|
|
|
|
|
|
|
|
|
|
| Pathway |
Source |
Scores of Genes |
p[Score] |
No. of Genes |
p[genes] |
Link to organ heatmap |
|
|
|
|
|
|
|
| Photosystems |
BioPath |
351 |
0.000 |
50 |
0.000 |
|
|
|
| additional photosystem II components |
BioPath |
150 |
0.000 |
20 |
0.000 |
|
|
| Chlorophyll a/b binding proteins |
BioPath |
138 |
0.000 |
17 |
0.000 |
|
|
| Photosynthesis |
KEGG |
133 |
0.000 |
21 |
0.000 |
|
|
| Photosystem I |
BioPath |
123 |
0.000 |
20 |
0.000 |
|
|
| biogenesis of chloroplast |
FunCat |
93 |
0.000 |
15 |
0.000 |
|
|
| photosynthesis |
FunCat |
90 |
0.000 |
13 |
0.000 |
|
|
| Photosystem II |
BioPath |
69 |
0.000 |
9 |
0.001 |
|
|
| photosystem I |
TAIR-GO |
67 |
0.000 |
8 |
0.000 |
|
|
| chlorophyll binding |
TAIR-GO |
60 |
0.000 |
7 |
0.000 |
|
|
| transport |
FunCat |
58 |
0.000 |
9 |
0.000 |
|
|
| photosystem II |
TAIR-GO |
51 |
0.000 |
6 |
0.000 |
|
|
| glycolysis and gluconeogenesis |
FunCat |
51 |
0.004 |
7 |
0.162 |
|
|
| Carbon fixation |
KEGG |
51 |
0.000 |
6 |
0.001 |
|
|
|
|
|
|
|
|
|
|
|
| photosynthesis |
TAIR-GO |
50 |
0.000 |
6 |
0.000 |
|
|
|
|
|
|
|
|
|
|
|
| light harvesting complex |
BioPath |
48 |
0.000 |
6 |
0.000 |
|
|
|
|
|
|
|
|
|
|
|
| respiration |
FunCat |
46 |
0.000 |
7 |
0.000 |
|
|
|
|
|
|
|
|
|
|
|
| aerobic respiration |
FunCat |
40 |
0.000 |
5 |
0.000 |
|
|
|
|
|
|
|
|
|
|
|
| photosystem II type I chlorophyll a /b binding protein |
BioPath |
36 |
0.000 |
4 |
0.000 |
|
|
|
|
|
|
|
|
|
|
|
| energy |
FunCat |
34 |
0.000 |
5 |
0.000 |
|
|
|
|
|
|
|
|
|
|
|
| transport facilitation |
FunCat |
32 |
0.000 |
5 |
0.000 |
|
|
|
|
|
|
|
|
|
|
|
|
|
|
|
|
|
|
|
|
|
|
|
|
|
|
|
|
|
|
|
|
|
|
|
|
|
|
|
|
|
|
|
|
|
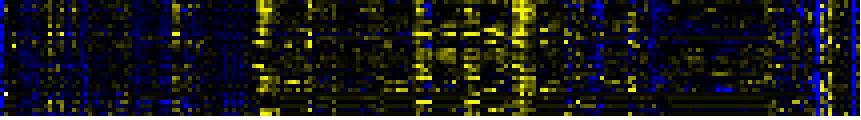
| Pathways co-expressed in the Stress data set ( with more than 9 annotation points) |
|
CYP74B2, HPL1 (At4g15440) |
|
|
|
|
|
|
|
|
| max. difference between log2-ratios: |
9.1 |
|
|
|
|
|
|
|
|
|
|
|
|
| max. difference between log2-ratios excluding lowest and highest 5%: |
2.4 |
|
|
|
|
|
|
|
|
|
|
|
|
| Pathway |
Source |
Scores of Genes |
p[Score] |
No. of Genes |
p[genes] |
Link to stress heatmap |
|
|
|
|
|
|
|
| Lipid signaling |
AcylLipid |
43 |
0.000 |
5 |
0.001 |
|
| response to wounding |
TAIR-GO |
36 |
0.000 |
4 |
0.000 |
| jasmonic acid biosynthesis |
TAIR-GO |
33 |
0.000 |
4 |
0.000 |
| jasmonic acid biosynthesis |
AraCyc |
33 |
0.000 |
4 |
0.000 |
| lipoxygenase pathway |
AraCyc |
33 |
0.000 |
4 |
0.000 |
| response to jasmonic acid stimulus |
TAIR-GO |
26 |
0.000 |
3 |
0.000 |
| oxylipin pathway |
LitPath |
20 |
0.000 |
2 |
0.000 |
| Phenylpropanoid Metabolism |
BioPath |
18 |
0.000 |
2 |
0.057 |
| lipid, fatty acid and isoprenoid metabolism |
FunCat |
17 |
0.000 |
2 |
0.001 |
|
|
|
|
|
|
|
|
|
|
|
| amino acid metabolism |
FunCat |
15 |
0.000 |
3 |
0.001 |
|
|
|
|
|
|
|
|
|
|
|
| response to abscisic acid stimulus |
TAIR-GO |
11 |
0.000 |
2 |
0.001 |
|
|
|
|
|
|
|
|
|
|
|
| Chlorophyll biosynthesis and breakdown |
BioPath |
10 |
0.000 |
1 |
0.012 |
|
|
|
|
|
|
|
|
|
|
|
| Glucosyltransferases for benzoic acids |
BioPath |
10 |
0.000 |
1 |
0.002 |
|
|
|
|
|
|
|
|
|
|
|
| Plastidial Isoprenoids (Chlorophylls, Carotenoids, Tocopherols, Plastoquinone, Phylloquinone) |
BioPath |
10 |
0.002 |
1 |
0.069 |
|
|
|
|
|
|
|
|
|
|
|
| starch metabolism |
BioPath |
10 |
0.000 |
1 |
0.010 |
|
|
|
|
|
|
|
|
|
|
|
| chlorophyll catabolism |
TAIR-GO |
10 |
0.000 |
1 |
0.001 |
|
|
|
|
|
|
|
|
|
|
|
| response to stress |
TAIR-GO |
10 |
0.000 |
1 |
0.001 |
|
|
|
|
|
|
|
|
|
|
|
| starch catabolism |
TAIR-GO |
10 |
0.000 |
1 |
0.001 |
|
|
|
|
|
|
|
|
|
|
|
| starch degradation |
AraCyc |
10 |
0.000 |
1 |
0.007 |
|
|
|
|
|
|
|
|
|
|
|
| C-compound and carbohydrate utilization |
FunCat |
10 |
0.000 |
1 |
0.000 |
|
|
|
|
|
|
|
|
|
|
|
| energy |
FunCat |
10 |
0.000 |
1 |
0.000 |
|
|
|
|
|
|
|
|
|
|
|
| metabolism of energy reserves (e.g. glycogen, trehalose) |
FunCat |
10 |
0.000 |
1 |
0.000 |
|
|
|
|
|
|
|
|
|
|
|
| Starch and sucrose metabolism |
KEGG |
10 |
0.000 |
1 |
0.033 |
|
|
|
|
|
|
|
|
|
|
|
| chlorophyll and phytochromobilin metabolism |
LitPath |
10 |
0.000 |
1 |
0.021 |
|
|
|
|
|
|
|
|
|
|
|
| chlorophyll catabolism |
LitPath |
10 |
0.000 |
1 |
0.000 |
|
|
|
|
|
|
|
|
|
|
|
|
|
|
|
|
|
|
|
|
|
|
|
|
|
|
|
|
|
|
|
|
|
|
|
|
|
|
|
|
|
|
|
|
|
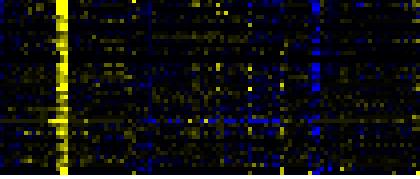
| Pathways co-expressed in the Hormone etc. data set (with more than 9 annotation points) |
|
CYP74B2, HPL1 (At4g15440) |
|
|
|
|
|
|
|
|
| max. difference between log2-ratios: |
5.5 |
|
|
|
|
|
|
|
|
|
|
|
|
| max. difference between log2-ratios excluding lowest and highest 5%: |
2.2 |
|
|
|
|
|
|
|
|
|
|
|
|
| Pathway |
Source |
Scores of Genes |
p[Score] |
No. of Genes |
p[genes] |
Link to hormones etc. heatmap |
|
|
|
|
|
|
|
| Lipid signaling |
AcylLipid |
34 |
0.000 |
4 |
0.012 |
|
|
|
|
|
|
| secondary metabolism |
FunCat |
24 |
0.000 |
6 |
0.000 |
|
|
|
|
|
| jasmonic acid biosynthesis |
TAIR-GO |
20 |
0.000 |
2 |
0.001 |
|
|
|
|
|
| response to wounding |
TAIR-GO |
20 |
0.000 |
2 |
0.001 |
|
|
|
|
|
| jasmonic acid biosynthesis |
AraCyc |
20 |
0.000 |
2 |
0.001 |
|
|
|
|
|
| lipoxygenase pathway |
AraCyc |
20 |
0.000 |
2 |
0.000 |
|
|
|
|
|
| oxylipin pathway |
LitPath |
20 |
0.000 |
2 |
0.000 |
|
|
|
|
|
| Biosynthesis of Amino Acids and Derivatives |
BioPath |
18 |
0.001 |
3 |
0.045 |
|
|
|
|
|
| Isoprenoid Biosynthesis in the Cytosol and in Mitochondria |
BioPath |
16 |
0.000 |
2 |
0.014 |
|
|
|
|
|
| auxin metabolism |
TAIR-GO |
13 |
0.000 |
2 |
0.000 |
|
|
|
|
|
| transport |
FunCat |
13 |
0.000 |
3 |
0.000 |
|
|
|
|
|
| transport facilitation |
FunCat |
13 |
0.000 |
3 |
0.000 |
|
|
|
|
|
|
|
|
|
|
|
| Glutathione metabolism |
BioPath |
12 |
0.000 |
2 |
0.018 |
|
|
|
|
|
|
|
|
|
|
|
| lipid, fatty acid and isoprenoid metabolism |
FunCat |
12 |
0.000 |
2 |
0.003 |
|
|
|
|
|
|
|
|
|
|
|
| transport ATPases |
FunCat |
11 |
0.000 |
2 |
0.002 |
|
|
|
|
|
|
|
|
|
|
|
| Glutathione metabolism |
KEGG |
11 |
0.000 |
2 |
0.002 |
|
|
|
|
|
|
|
|
|
|
|
| Aromatic amino acid (Phe, Tyr, Trp) metabolism |
BioPath |
10 |
0.000 |
1 |
0.075 |
|
|
|
|
|
|
|
|
|
|
|
| Biosynthesis of prenyl diphosphates |
BioPath |
10 |
0.000 |
1 |
0.050 |
|
|
|
|
|
|
|
|
|
|
|
| Chlorophyll biosynthesis and breakdown |
BioPath |
10 |
0.000 |
1 |
0.030 |
|
|
|
|
|
|
|
|
|
|
|
| Plastidial Isoprenoids (Chlorophylls, Carotenoids, Tocopherols, Plastoquinone, Phylloquinone) |
BioPath |
10 |
0.027 |
1 |
0.150 |
|
|
|
|
|
|
|
|
|
|
|
| aromatic amino acid family biosynthesis |
TAIR-GO |
10 |
0.000 |
1 |
0.007 |
|
|
|
|
|
|
|
|
|
|
|
| aromatic amino acid family biosynthesis, anthranilate pathway |
TAIR-GO |
10 |
0.000 |
1 |
0.000 |
|
|
|
|
|
|
|
|
|
|
|
| aromatic amino acid family biosynthesis, shikimate pathway |
TAIR-GO |
10 |
0.000 |
1 |
0.005 |
|
|
|
|
|
|
|
|
|
|
|
| chlorophyll catabolism |
TAIR-GO |
10 |
0.000 |
1 |
0.000 |
|
|
|
|
|
|
|
|
|
|
|
| cysteine biosynthesis |
TAIR-GO |
10 |
0.000 |
1 |
0.000 |
|
|
|
|
|
|
|
|
|
|
|
| glucosinolate biosynthesis |
TAIR-GO |
10 |
0.000 |
1 |
0.002 |
|
|
|
|
|
|
|
|
|
|
|
| response to biotic stimulus |
TAIR-GO |
10 |
0.000 |
1 |
0.000 |
|
|
|
|
|
|
|
|
|
|
|
| response to jasmonic acid stimulus |
TAIR-GO |
10 |
0.000 |
1 |
0.002 |
|
|
|
|
|
|
|
|
|
|
|
| response to stress |
TAIR-GO |
10 |
0.000 |
1 |
0.000 |
|
|
|
|
|
|
|
|
|
|
|
| alanine biosynthesis II |
AraCyc |
10 |
0.000 |
1 |
0.029 |
|
|
|
|
|
|
|
|
|
|
|
| chlorophyll biosynthesis |
AraCyc |
10 |
0.000 |
3 |
0.002 |
|
|
|
|
|
|
|
|
|
|
|
| cysteine biosynthesis I |
AraCyc |
10 |
0.000 |
1 |
0.065 |
|
|
|
|
|
|
|
|
|
|
|
| glucosinolate biosynthesis from homomethionine |
AraCyc |
10 |
0.000 |
1 |
0.001 |
|
|
|
|
|
|
|
|
|
|
|
| phenylalanine biosynthesis II |
AraCyc |
10 |
0.000 |
1 |
0.023 |
|
|
|
|
|
|
|
|
|
|
|
| sulfate assimilation III |
AraCyc |
10 |
0.000 |
1 |
0.048 |
|
|
|
|
|
|
|
|
|
|
|
| tyrosine biosynthesis I |
AraCyc |
10 |
0.000 |
1 |
0.004 |
|
|
|
|
|
|
|
|
|
|
|
| amino acid metabolism |
FunCat |
10 |
0.004 |
1 |
0.175 |
|
|
|
|
|
|
|
|
|
|
|
| Cysteine metabolism |
KEGG |
10 |
0.000 |
1 |
0.011 |
|
|
|
|
|
|
|
|
|
|
|
| Phenylalanine, tyrosine and tryptophan biosynthesis |
KEGG |
10 |
0.000 |
1 |
0.026 |
|
|
|
|
|
|
|
|
|
|
|
| Selenoamino acid metabolism |
KEGG |
10 |
0.000 |
1 |
0.013 |
|
|
|
|
|
|
|
|
|
|
|
| Sulfur metabolism |
KEGG |
10 |
0.000 |
1 |
0.007 |
|
|
|
|
|
|
|
|
|
|
|
| chlorophyll and phytochromobilin metabolism |
LitPath |
10 |
0.025 |
1 |
0.096 |
|
|
|
|
|
|
|
|
|
|
|
| chlorophyll catabolism |
LitPath |
10 |
0.000 |
1 |
0.001 |
|
|
|
|
|
|
|
|
|
|
|
| Glucosinolate Metabolism |
LitPath |
10 |
0.001 |
1 |
0.035 |
|
|
|
|
|
|
|
|
|
|
|
| Phe/Tyr biosynthesis |
LitPath |
10 |
0.000 |
1 |
0.000 |
|
|
|
|
|
|
|
|
|
|
|
| prenyl diphosphate (GPP,FPP, GGPP) biosynthesis |
LitPath |
10 |
0.000 |
1 |
0.022 |
|
|
|
|
|
|
|
|
|
|
|
| Shikimate pathway |
LitPath |
10 |
0.021 |
1 |
0.133 |
|
|
|
|
|
|
|
|
|
|
|
| Tyr biosynthesis |
LitPath |
10 |
0.000 |
1 |
0.000 |
|
|
|
|
|
|
|
|
|
|
|
|
|
|
|
|
|
|
|
|
|
|
|
|
|
|
|
|
|
|
|
|
|
|
|
|
|
|
|
|
|
|
|
|
|
|
|
|
|
|
|
|
|
|
|
|
|
|
|
|
|
|
| Pathways co-expressed in the Mutant data set (with more than 9 annotation points) |
|
CYP74B2, HPL1 (At4g15440) |
|
|
|
|
|
|
|
|
| max. difference between log2-ratios: |
5.8 |
|
|
|
|
|
|
|
|
|
|
|
|
| max. difference between log2-ratios excluding lowest and highest 5%: |
2.2 |
|
|
|
|
|
|
|
|
|
|
|
|
| Pathway |
Source |
Scores of Genes |
p[Score] |
No. of Genes |
p[genes] |
Link to mutants heatmap |
|
|
|
|
|
|
|
| Phenylpropanoid Metabolism |
BioPath |
20 |
0.000 |
2 |
0.080 |
|
|
|
|
| Sulfur metabolism |
KEGG |
15 |
0.000 |
2 |
0.000 |
|
|
|
| Biosynthesis of Amino Acids and Derivatives |
BioPath |
12 |
0.018 |
2 |
0.074 |
|
|
|
| Glutathione metabolism |
BioPath |
12 |
0.000 |
2 |
0.007 |
|
|
|
| cysteine biosynthesis I |
AraCyc |
12 |
0.000 |
2 |
0.001 |
|
|
|
| sulfate assimilation III |
AraCyc |
12 |
0.000 |
2 |
0.001 |
|
|
|
|
|
|
|
|
|
|
|
| nitrogen and sulfur metabolism |
FunCat |
12 |
0.000 |
2 |
0.000 |
|
|
|
|
|
|
|
|
|
|
|
| Lipid signaling |
AcylLipid |
12 |
0.000 |
2 |
0.000 |
|
|
|
|
|
|
|
|
|
|
|
| Oxidative phosphorylation |
KEGG |
11 |
0.000 |
3 |
0.001 |
|
|
|
|
|
|
|
|
|
|
|
| core phenylpropanoid metabolism |
BioPath |
10 |
0.000 |
1 |
0.029 |
|
|
|
|
|
|
|
|
|
|
|
| Flavonoid and anthocyanin metabolism |
BioPath |
10 |
0.000 |
1 |
0.042 |
|
|
|
|
|
|
|
|
|
|
|
| phenylpropanoid metabolism |
TAIR-GO |
10 |
0.000 |
1 |
0.001 |
|
|
|
|
|
|
|
|
|
|
|
| response to pathogenic fungi |
TAIR-GO |
10 |
0.000 |
1 |
0.000 |
|
|
|
|
|
|
|
|
|
|
|
| response to UV |
TAIR-GO |
10 |
0.000 |
1 |
0.007 |
|
|
|
|
|
|
|
|
|
|
|
| response to wounding |
TAIR-GO |
10 |
0.000 |
1 |
0.020 |
|
|
|
|
|
|
|
|
|
|
|
| flavonoid biosynthesis |
AraCyc |
10 |
0.000 |
1 |
0.008 |
|
|
|
|
|
|
|
|
|
|
|
| lignin biosynthesis |
AraCyc |
10 |
0.000 |
1 |
0.020 |
|
|
|
|
|
|
|
|
|
|
|
| lipoxygenase pathway |
AraCyc |
10 |
0.000 |
1 |
0.002 |
|
|
|
|
|
|
|
|
|
|
|
| lipid, fatty acid and isoprenoid metabolism |
FunCat |
10 |
0.000 |
1 |
0.012 |
|
|
|
|
|
|
|
|
|
|
|
| Stilbene, coumarine and lignin biosynthesis |
KEGG |
10 |
0.000 |
1 |
0.106 |
|
|
|
|
|
|
|
|
|
|
|
| Glucosinolate Metabolism |
LitPath |
10 |
0.000 |
1 |
0.007 |
|
|
|
|
|
|
|
|
|
|
|
| oxylipin pathway |
LitPath |
10 |
0.000 |
1 |
0.000 |
|
|
|
|
|
|
|
|
|
|
|
| Phenylpropanoid pathway |
LitPath |
10 |
0.000 |
1 |
0.106 |
|
|
|
|
|
|
|
|
|
|
|
|
|
|
|
|
|
|
|
|
|
|
|
|
|
|
|
|